Lithuania Infant Formula Market (2026-2032) | Companies, Analysis, Forecast, Share, Industry, Outlook, Trends, Competitive Landscape, Value, Growth, Segmentation, Size & Revenue
Market Forecast By Type (Infant Milk, Follow on Milk, Specialty Baby Milk, Growing-up Milk), By Ingredient (Carbohydrate, Fat, Protein, Minerals, Vitamins, Others), By Distribution Channel (Online, Offline) And Competitive Landscape
| Product Code: ETC8043088 | Publication Date: Sep 2024 | Updated Date: Apr 2026 | Product Type: Market Research Report | |
| Publisher: 6Wresearch | Author: Summon Dutta | No. of Pages: 75 | No. of Figures: 35 | No. of Tables: 20 |
Lithuania Infant Formula Market Size (2020-2030)
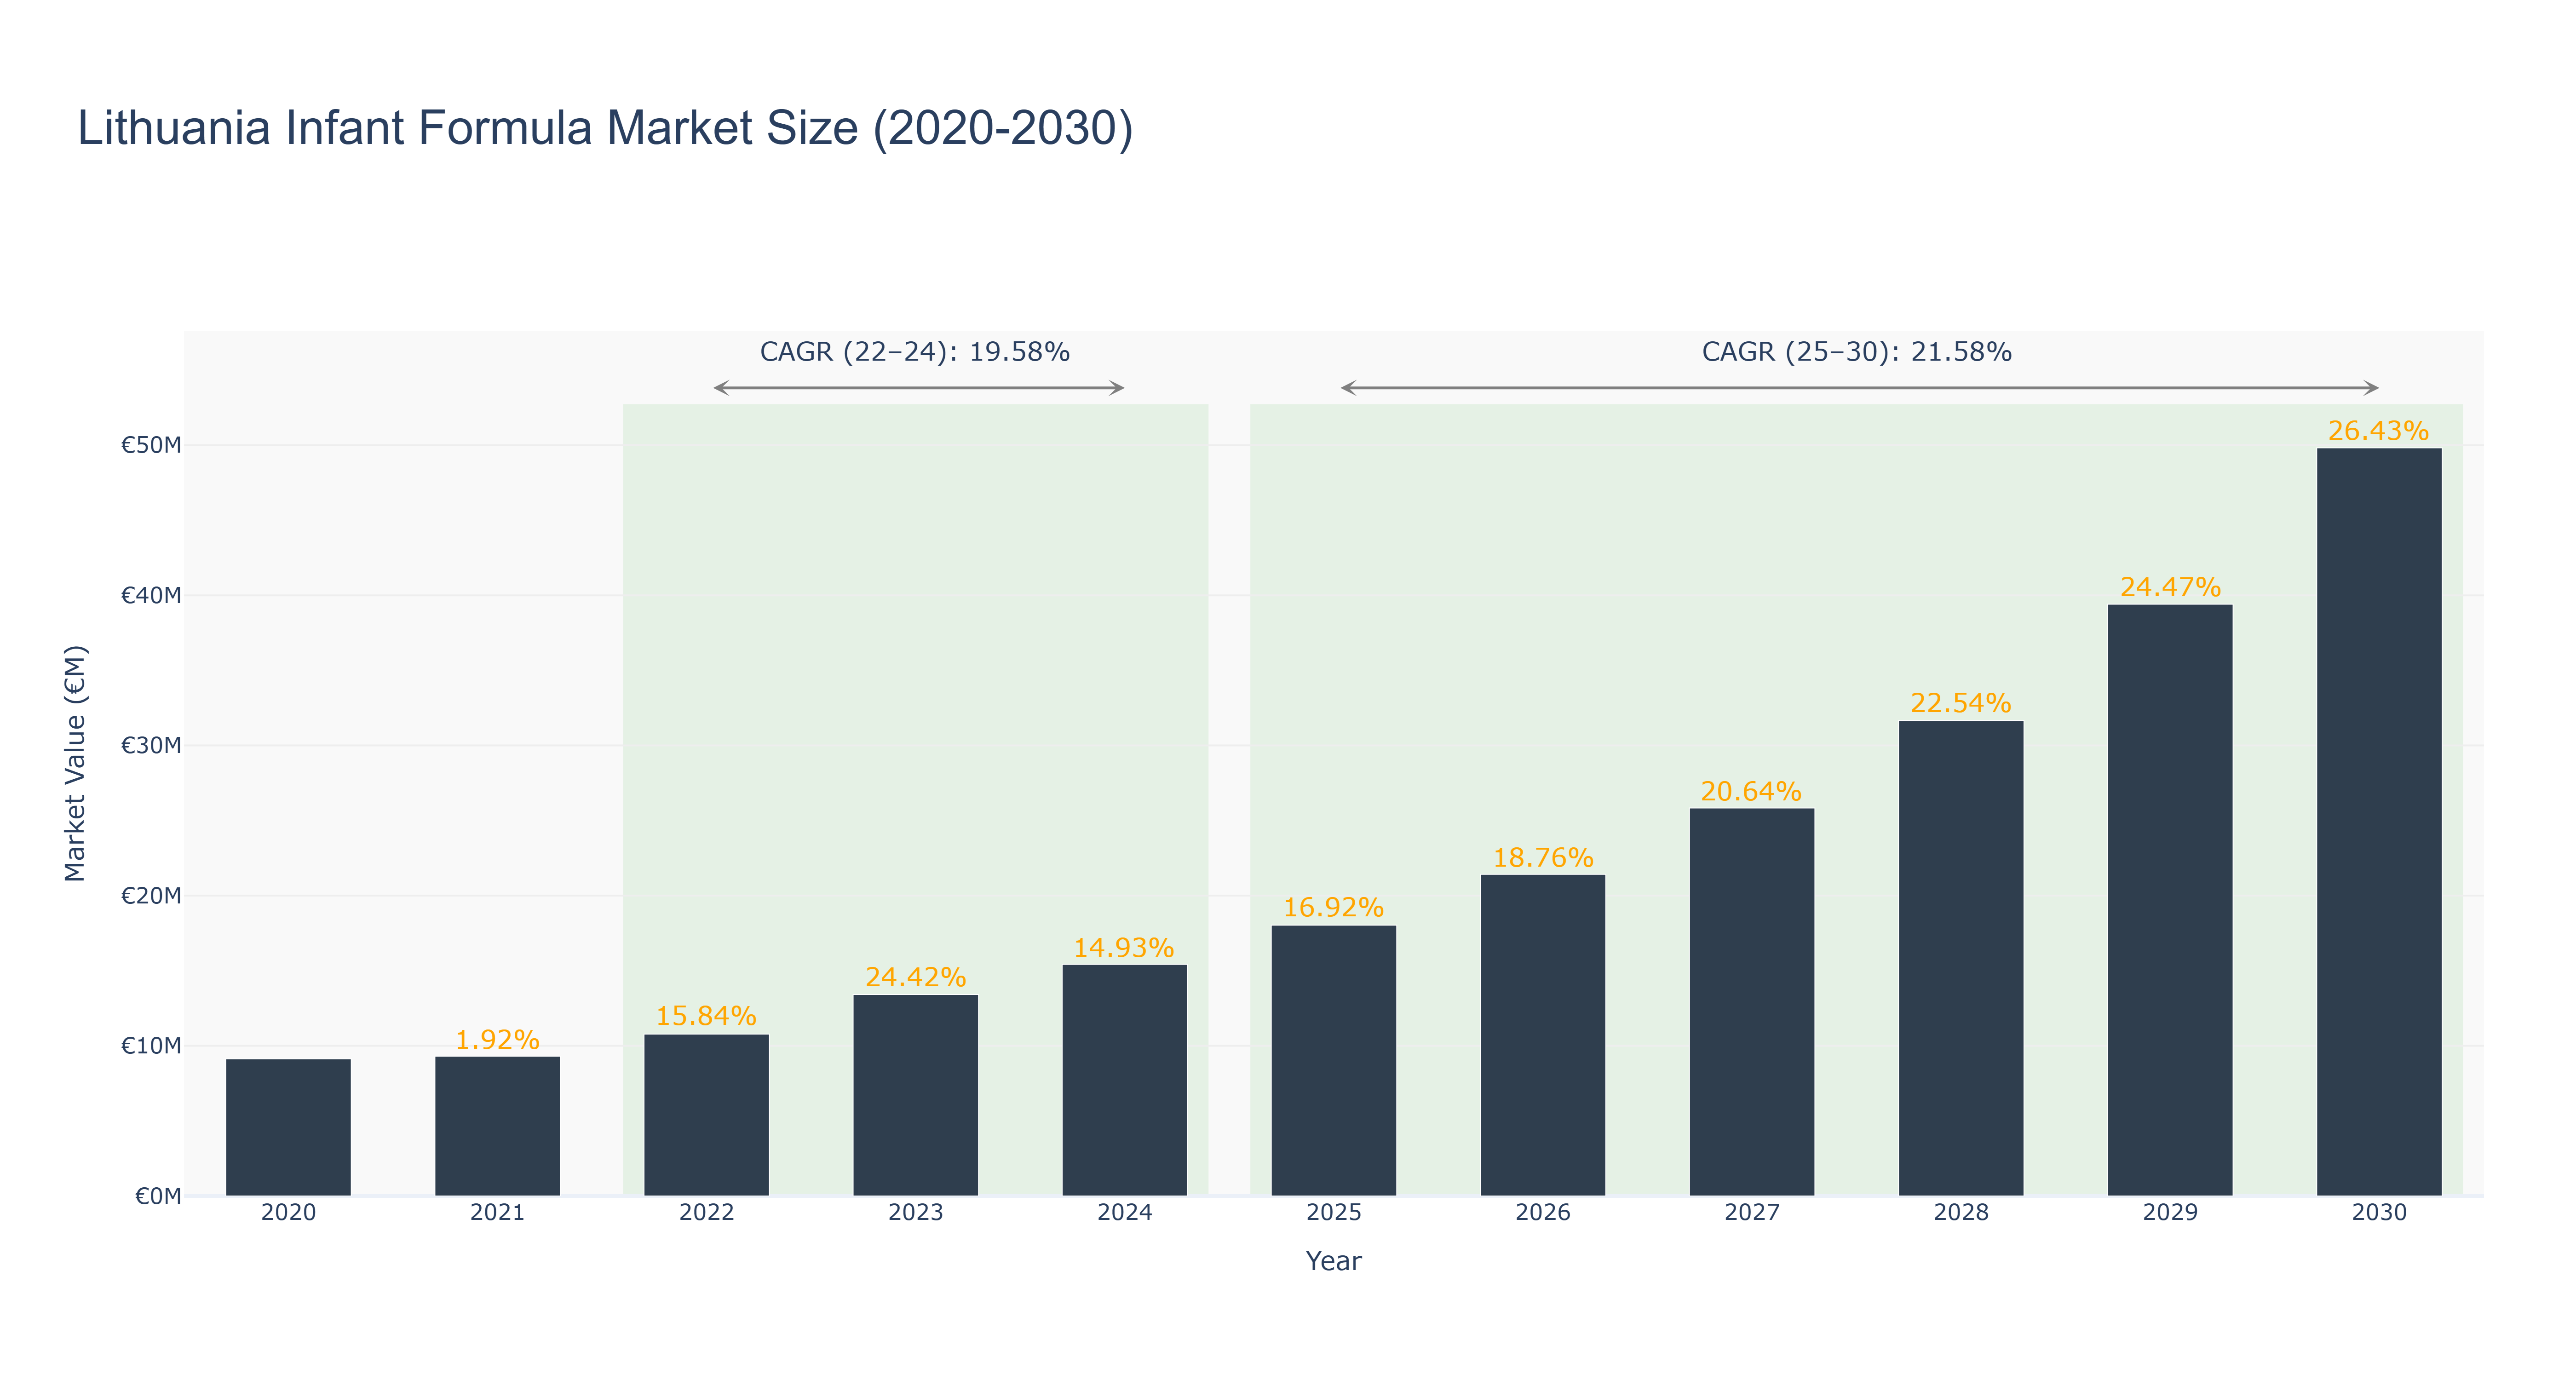
Lithuania Infant Formula Market has shown a promising growth trajectory over the years. The market size peaked at €49.82 million in 2030, with a steady increase from €9.14 million in 2020. The actual market size saw consistent growth from 2020 to 2024, driven by increasing demand for infant nutrition products. The forecasted market size from 2025 to 2030 is expected to maintain this upward trend, with a CAGR of 21.58% between 2025 and 2030. The market's growth can be attributed to factors such as rising awareness about infant health and nutrition, coupled with an increase in disposable income among consumers. Looking ahead, Lithuania is set to witness advancements in infant formula technology, aimed at enhancing product quality and nutritional value, further fueling market growth.
Lithuania Infant Formula Market: Production & Trade Performance (2019-2025)
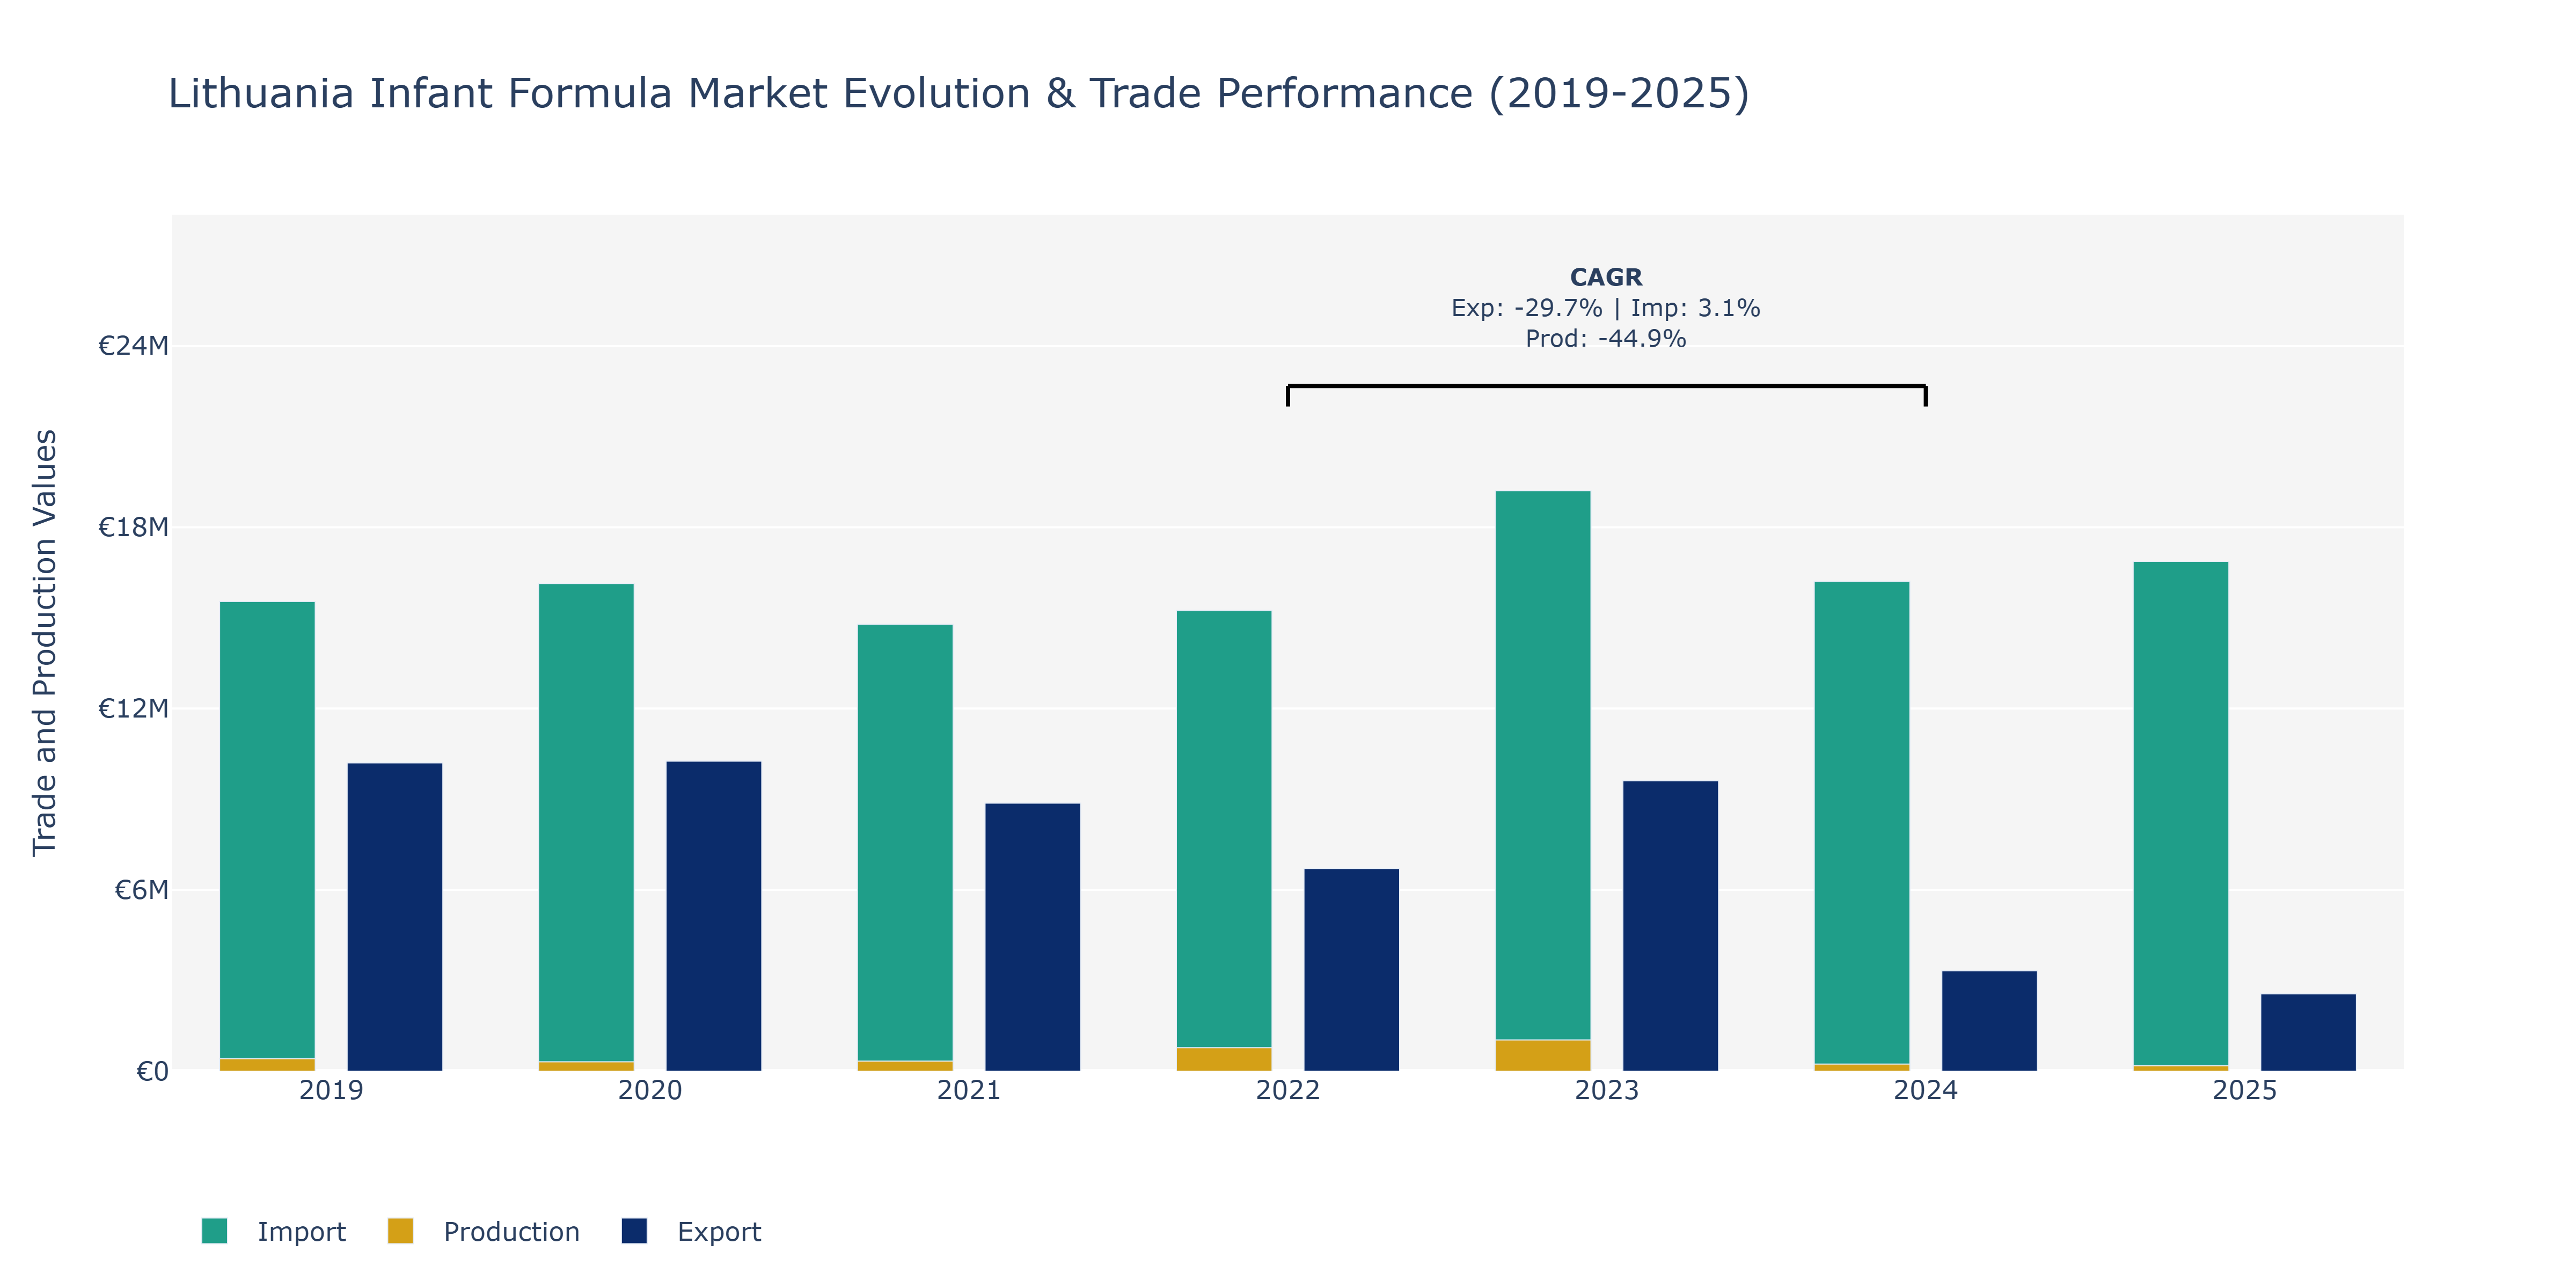
In the Lithuania Infant Formula Market, from 2019 to 2025, Exports saw a downward trend, starting at €10.2 million in 2019, declining to €2.56 million in 2025. Imports, on the other hand, fluctuated over the years, with a peak at €19.21 million in 2023. Production also experienced fluctuations, with a notable decline from €411.89 million in 2019 to €176.66 million in 2025. The decrease in exports could be attributed to changing consumer preferences towards more local or organic products, impacting international sales. Fluctuations in imports might be influenced by global market conditions, trade agreements, and exchange rates. The decline in production could reflect challenges in the supply chain, raw material costs, or regulatory changes impacting manufacturing processes. To adapt and thrive in this market, companies may need to focus on product innovation, cost-efficiency, and sustainability practices in line with evolving consumer demands.
Key Highlights of the Report:
- Lithuania Infant Formula Market Outlook
- Market Size of Lithuania Infant Formula Market, 2025
- Forecast of Lithuania Infant Formula Market, 2032
- Historical Data and Forecast of Lithuania Infant Formula Revenues & Volume for the Period 2022 - 2032
- Lithuania Infant Formula Market Trend Evolution
- Lithuania Infant Formula Market Drivers and Challenges
- Lithuania Infant Formula Price Trends
- Lithuania Infant Formula Porter's Five Forces
- Lithuania Infant Formula Industry Life Cycle
- Historical Data and Forecast of Lithuania Infant Formula Market Revenues & Volume By Type for the Period 2022 - 2032
- Historical Data and Forecast of Lithuania Infant Formula Market Revenues & Volume By Infant Milk for the Period 2022 - 2032
- Historical Data and Forecast of Lithuania Infant Formula Market Revenues & Volume By Follow on Milk for the Period 2022 - 2032
- Historical Data and Forecast of Lithuania Infant Formula Market Revenues & Volume By Specialty Baby Milk for the Period 2022 - 2032
- Historical Data and Forecast of Lithuania Infant Formula Market Revenues & Volume By Growing-up Milk for the Period 2022 - 2032
- Historical Data and Forecast of Lithuania Infant Formula Market Revenues & Volume By Ingredient for the Period 2022 - 2032
- Historical Data and Forecast of Lithuania Infant Formula Market Revenues & Volume By Carbohydrate for the Period 2022 - 2032
- Historical Data and Forecast of Lithuania Infant Formula Market Revenues & Volume By Fat for the Period 2022 - 2032
- Historical Data and Forecast of Lithuania Infant Formula Market Revenues & Volume By Protein for the Period 2022 - 2032
- Historical Data and Forecast of Lithuania Infant Formula Market Revenues & Volume By Minerals for the Period 2022 - 2032
- Historical Data and Forecast of Lithuania Infant Formula Market Revenues & Volume By Vitamins for the Period 2022 - 2032
- Historical Data and Forecast of Lithuania Infant Formula Market Revenues & Volume By Others for the Period 2022 - 2032
- Historical Data and Forecast of Lithuania Infant Formula Market Revenues & Volume By Distribution Channel for the Period 2022 - 2032
- Historical Data and Forecast of Lithuania Infant Formula Market Revenues & Volume By Online for the Period 2022 - 2032
- Historical Data and Forecast of Lithuania Infant Formula Market Revenues & Volume By Offline for the Period 2022 - 2032
- Lithuania Infant Formula Import Export Trade Statistics
- Market Opportunity Assessment By Type
- Market Opportunity Assessment By Ingredient
- Market Opportunity Assessment By Distribution Channel
- Lithuania Infant Formula Top Companies Market Share
- Lithuania Infant Formula Competitive Benchmarking By Technical and Operational Parameters
- Lithuania Infant Formula Company Profiles
- Lithuania Infant Formula Key Strategic Recommendations
Frequently Asked Questions About the Market Study (FAQs):
6Wresearch actively monitors the Lithuania Infant Formula Market and publishes its comprehensive annual report, highlighting emerging trends, growth drivers, revenue analysis, and forecast outlook. Our insights help businesses to make data-backed strategic decisions with ongoing market dynamics. Our analysts track relevent industries related to the Lithuania Infant Formula Market, allowing our clients with actionable intelligence and reliable forecasts tailored to emerging regional needs.
Yes, we provide customisation as per your requirements. To learn more, feel free to contact us on sales@6wresearch.com
1 Executive Summary |
2 Introduction |
2.1 Key Highlights of the Report |
2.2 Report Description |
2.3 Market Scope & Segmentation |
2.4 Research Methodology |
2.5 Assumptions |
3 Lithuania Infant Formula Market Overview |
3.1 Lithuania Country Macro Economic Indicators |
3.2 Lithuania Infant Formula Market Revenues & Volume, 2022 & 2032F |
3.3 Lithuania Infant Formula Market - Industry Life Cycle |
3.4 Lithuania Infant Formula Market - Porter's Five Forces |
3.5 Lithuania Infant Formula Market Revenues & Volume Share, By Type, 2022 & 2032F |
3.6 Lithuania Infant Formula Market Revenues & Volume Share, By Ingredient, 2022 & 2032F |
3.7 Lithuania Infant Formula Market Revenues & Volume Share, By Distribution Channel, 2022 & 2032F |
4 Lithuania Infant Formula Market Dynamics |
4.1 Impact Analysis |
4.2 Market Drivers |
4.3 Market Restraints |
5 Lithuania Infant Formula Market Trends |
6 Lithuania Infant Formula Market, By Types |
6.1 Lithuania Infant Formula Market, By Type |
6.1.1 Overview and Analysis |
6.1.2 Lithuania Infant Formula Market Revenues & Volume, By Type, 2022 - 2032F |
6.1.3 Lithuania Infant Formula Market Revenues & Volume, By Infant Milk, 2022 - 2032F |
6.1.4 Lithuania Infant Formula Market Revenues & Volume, By Follow on Milk, 2022 - 2032F |
6.1.5 Lithuania Infant Formula Market Revenues & Volume, By Specialty Baby Milk, 2022 - 2032F |
6.1.6 Lithuania Infant Formula Market Revenues & Volume, By Growing-up Milk, 2022 - 2032F |
6.2 Lithuania Infant Formula Market, By Ingredient |
6.2.1 Overview and Analysis |
6.2.2 Lithuania Infant Formula Market Revenues & Volume, By Carbohydrate, 2022 - 2032F |
6.2.3 Lithuania Infant Formula Market Revenues & Volume, By Fat, 2022 - 2032F |
6.2.4 Lithuania Infant Formula Market Revenues & Volume, By Protein, 2022 - 2032F |
6.2.5 Lithuania Infant Formula Market Revenues & Volume, By Minerals, 2022 - 2032F |
6.2.6 Lithuania Infant Formula Market Revenues & Volume, By Vitamins, 2022 - 2032F |
6.2.7 Lithuania Infant Formula Market Revenues & Volume, By Others, 2022 - 2032F |
6.3 Lithuania Infant Formula Market, By Distribution Channel |
6.3.1 Overview and Analysis |
6.3.2 Lithuania Infant Formula Market Revenues & Volume, By Online, 2022 - 2032F |
6.3.3 Lithuania Infant Formula Market Revenues & Volume, By Offline, 2022 - 2032F |
7 Lithuania Infant Formula Market Import-Export Trade Statistics |
7.1 Lithuania Infant Formula Market Export to Major Countries |
7.2 Lithuania Infant Formula Market Imports from Major Countries |
8 Lithuania Infant Formula Market Key Performance Indicators |
9 Lithuania Infant Formula Market - Opportunity Assessment |
9.1 Lithuania Infant Formula Market Opportunity Assessment, By Type, 2022 & 2032F |
9.2 Lithuania Infant Formula Market Opportunity Assessment, By Ingredient, 2022 & 2032F |
9.3 Lithuania Infant Formula Market Opportunity Assessment, By Distribution Channel, 2022 & 2032F |
10 Lithuania Infant Formula Market - Competitive Landscape |
10.1 Lithuania Infant Formula Market Revenue Share, By Companies, 2025 |
10.2 Lithuania Infant Formula Market Competitive Benchmarking, By Operating and Technical Parameters |
11 Company Profiles |
12 Recommendations |
13 Disclaimer |
Export potential assessment - trade Analytics for 2030
Export potential enables firms to identify high-growth global markets with greater confidence by combining advanced trade intelligence with a structured quantitative methodology. The framework analyzes emerging demand trends and country-level import patterns while integrating macroeconomic and trade datasets such as GDP and population forecasts, bilateral import–export flows, tariff structures, elasticity differentials between developed and developing economies, geographic distance, and import demand projections. Using weighted trade values from 2020–2024 as the base period to project country-to-country export potential for 2030, these inputs are operationalized through calculated drivers such as gravity model parameters, tariff impact factors, and projected GDP per-capita growth. Through an analysis of hidden potentials, demand hotspots, and market conditions that are most favorable to success, this method enables firms to focus on target countries, maximize returns, and global expansion with data, backed by accuracy.
By factoring in the projected importer demand gap that is currently unmet and could be potential opportunity, it identifies the potential for the Exporter (Country) among 190 countries, against the general trade analysis, which identifies the biggest importer or exporter.
To discover high-growth global markets and optimize your business strategy:
Click Here
Pricing
- Single User License$ 1,995
- Department License$ 2,400
- Site License$ 3,120
- Global License$ 3,795

Search
Thought Leadership and Analyst Meet


Our Clients
Latest Reports
- France Thermally Conductive Filler Dispersants Market (2026-2032) | Challenges, Restraints, Value, Share, Size, segmentation, Analysis, Trends, Investment Opportunities, Outlook, Pricing, Demand, Forecast, Revenue, Companies, Growth, Drivers, Strategy, Insights, Competition
- Egypt Thermally Conductive Filler Dispersants Market (2026-2032) | Competition, Forecast, Strategy, Value, Insights, Outlook, Investment Opportunities, Pricing, Demand, Share, segmentation, Drivers, Size, Companies, Restraints, Growth, Trends, Revenue, Challenges, Analysis
- Czech Republic Thermally Conductive Filler Dispersants Market (2026-2032) | Forecast, Pricing, Analysis, Drivers, Insights, Size, Demand, Growth, Challenges, segmentation, Competition, Outlook, Trends, Investment Opportunities, Companies, Strategy, Revenue, Share, Value, Restraints
- Colombia Thermally Conductive Filler Dispersants Market (2026-2032) | segmentation, Trends, Share, Drivers, Strategy, Companies, Demand, Insights, Size, Challenges, Value, Competition, Analysis, Growth, Revenue, Restraints, Forecast, Pricing, Outlook, Investment Opportunities
- China Thermally Conductive Filler Dispersants Market (2026-2032) | Restraints, Investment Opportunities, Pricing, Companies, Share, Size, Challenges, Trends, Outlook, Value, Analysis, Competition, Revenue, Drivers, Forecast, Demand, Insights, Growth, Strategy, segmentation
- Chile Thermally Conductive Filler Dispersants Market (2026-2032) | Investment Opportunities, Trends, Value, Restraints, Share, Companies, Forecast, segmentation, Pricing, Challenges, Demand, Size, Analysis, Drivers, Outlook, Growth, Competition, Strategy, Revenue, Insights
- Cambodia Thermally Conductive Filler Dispersants Market (2026-2032) | Analysis, Share, Outlook, Strategy, Pricing, Demand, Size, Growth, segmentation, Insights, Revenue, Forecast, Challenges, Competition, Companies, Investment Opportunities, Trends, Restraints, Value, Drivers
- Brazil Thermally Conductive Filler Dispersants Market (2026-2032) | Restraints, Forecast, Competition, Size, Revenue, Value, Investment Opportunities, Trends, Insights, Outlook, Growth, Analysis, Drivers, segmentation, Pricing, Challenges, Strategy, Share, Companies, Demand
- Bangladesh Thermally Conductive Filler Dispersants Market (2026-2032) | Restraints, Trends, Analysis, Competition, Insights, Forecast, Value, Investment Opportunities, Pricing, Share, Demand, Outlook, Revenue, segmentation, Companies, Drivers, Growth, Size, Challenges, Strategy
- Bahrain Thermally Conductive Filler Dispersants Market (2026-2032) | Trends, Outlook, Pricing, Demand, Value, Competition, Forecast, Growth, segmentation, Revenue, Companies, Analysis, Insights, Size, Drivers, Challenges, Strategy, Investment Opportunities, Share, Restraints
Industry Events and Analyst Meet

HIMTEX 2026

India Refining Summit 2026

India EV Show 2026

EV tech India Expo 2026

Auto Tech Asia 2026
Whitepaper
- Middle East & Africa Commercial Security Market Click here to view more.
- Middle East & Africa Fire Safety Systems & Equipment Market Click here to view more.
- GCC Drone Market Click here to view more.
- Middle East Lighting Fixture Market Click here to view more.
- GCC Physical & Perimeter Security Market Click here to view more.
6WResearch In News
- Doha a strategic location for EV manufacturing hub: IPA Qatar
- Demand for luxury TVs surging in the GCC, says Samsung
- Empowering Growth: The Thriving Journey of Bangladesh’s Cable Industry
- Demand for luxury TVs surging in the GCC, says Samsung
- Video call with a traditional healer? Once unthinkable, it’s now common in South Africa
- Intelligent Buildings To Smooth GCC’s Path To Net Zero