Lithuania Kick Scooter Market (2026-2032) | Industry, Trends, Share, Growth, Forecast, Companies, Analysis, Value, Outlook, Segmentation, Revenue & Size
Market Forecast By Product Type (Two Wheeled, Three Wheeled), By Battery Type (Lead Based, Nickel Based, Lithium Ion), By Price Range (Below US$ 200, US$ 200 ‚œ 375, US$ 375.1 ‚œ 750, US$ 750.1 ‚œ 1,100, Above US$ 1,100), By Wheel Size (<8‚„‚„, 8 ‚œ 8.5‚„‚„, 9 ‚œ 9.5‚„‚„, 10 ‚œ 10.5‚„‚„, >11‚„‚„), By End Use (Personal, Rental/ Sharing, Law Enforcement) And Competitive Landscape
| Product Code: ETC5036104 | Publication Date: Nov 2023 | Updated Date: Apr 2026 | Product Type: Market Research Report | |
| Publisher: 6Wresearch | Author: Shubham Padhi | No. of Pages: 60 | No. of Figures: 30 | No. of Tables: 5 |
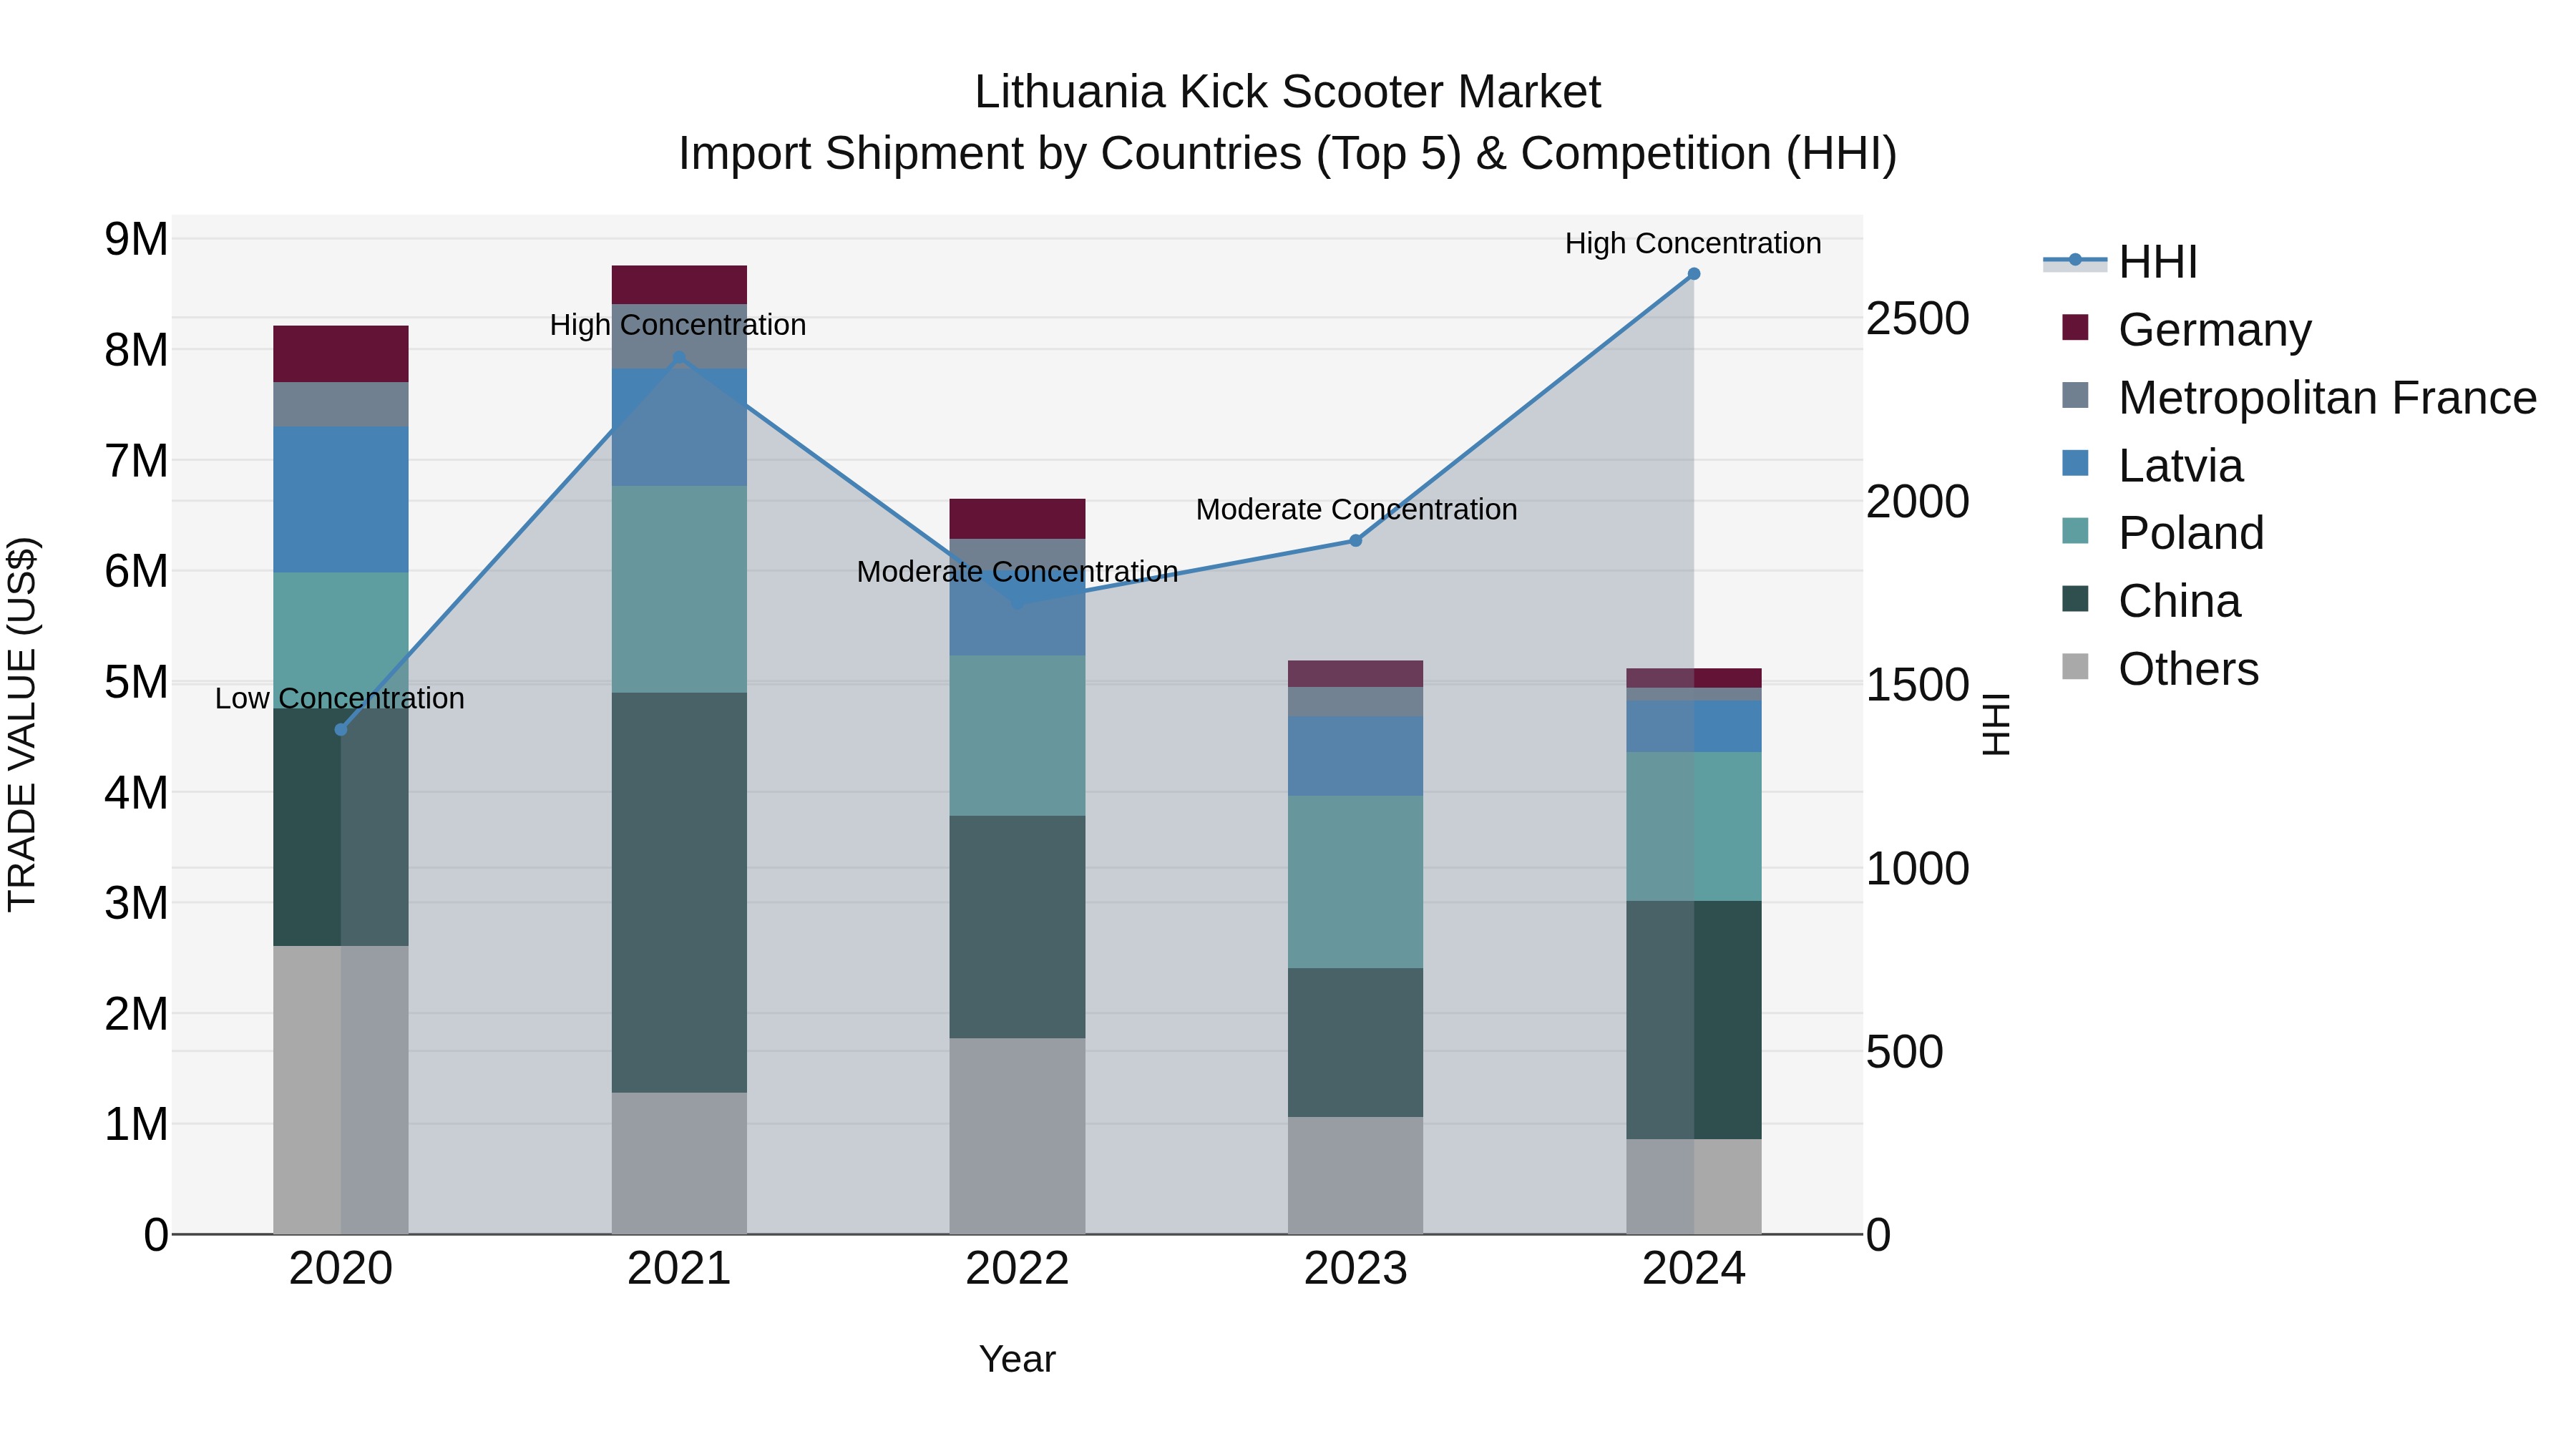
Lithuania Kick Scooter Market Top 5 Importing Countries and Market Competition (HHI) Analysis
In 2024, Lithuania saw a notable increase in the concentration of kick scooter import shipments, with top exporting countries being China, Poland, Latvia, Netherlands, and Estonia. Despite a negative CAGR of -11.17% from 2020 to 2024, there was a slight improvement in the growth rate from 2023 to 2024 at -1.36%. The market dynamics suggest a shift in supplier concentration, potentially indicating changes in market competitiveness and supply chain strategies within the kick scooter industry in Lithuania.
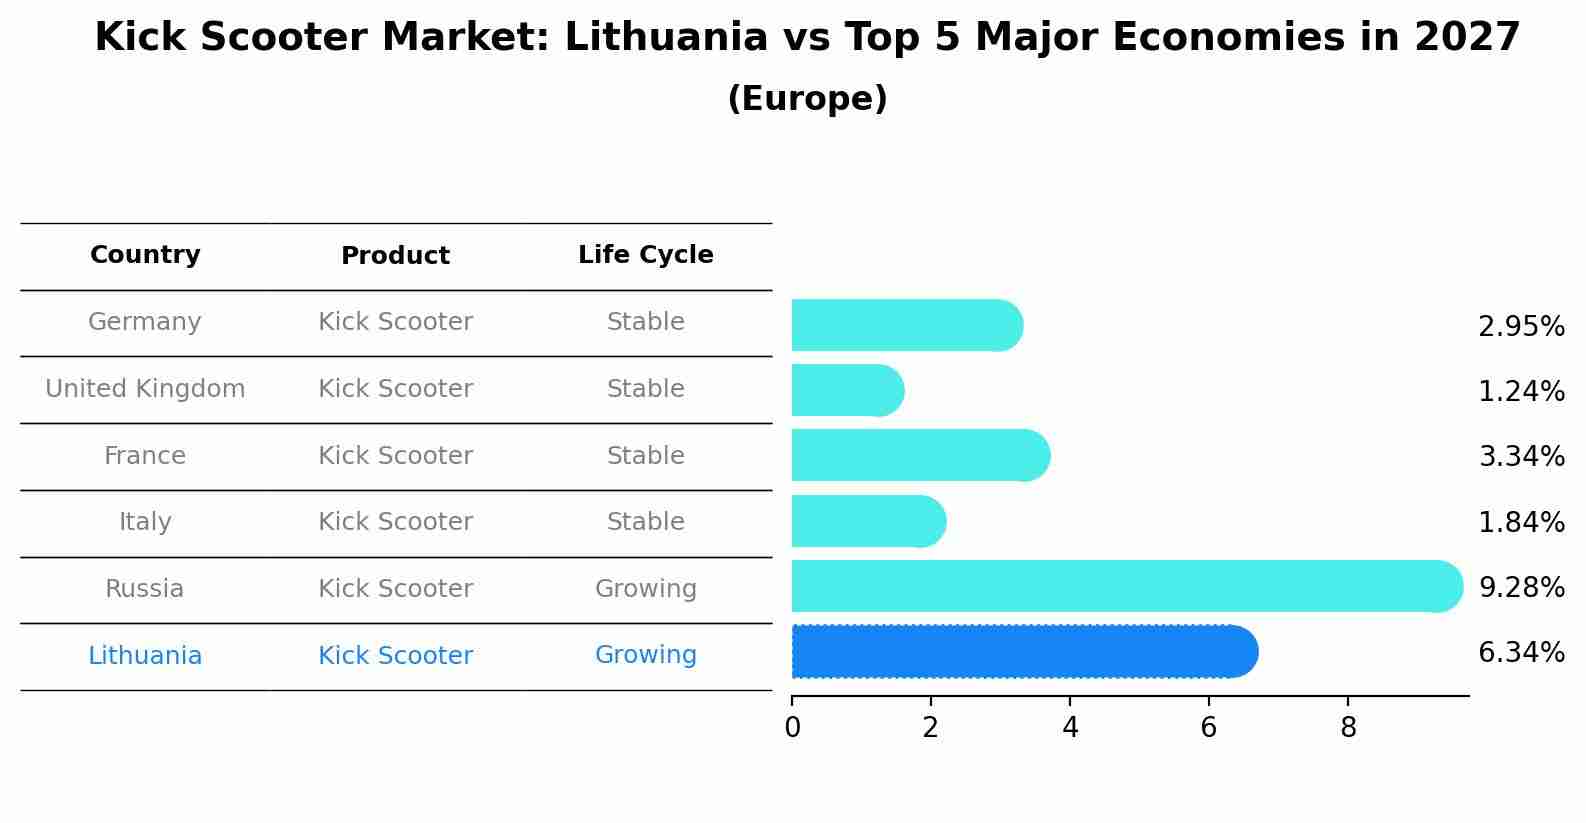
Kick Scooter Market: Lithuania vs Top 5 Major Economies in 2027 (Europe)
In the Europe region, the Kick Scooter market in Lithuania is projected to expand at a growing growth rate of 6.34% by 2027. The largest economy is Germany, followed by United Kingdom, France, Italy and Russia.
Key Highlights of the Report:
- Lithuania Kick Scooter Market Outlook
- Market Size of Lithuania Kick Scooter Market, 2025
- Forecast of Lithuania Kick Scooter Market, 2032
- Historical Data and Forecast of Lithuania Kick Scooter Revenues & Volume for the Period 2022 - 2032F
- Lithuania Kick Scooter Market Trend Evolution
- Lithuania Kick Scooter Market Drivers and Challenges
- Lithuania Kick Scooter Price Trends
- Lithuania Kick Scooter Porter`s Five Forces
- Lithuania Kick Scooter Industry Life Cycle
- Historical Data and Forecast of Lithuania Kick Scooter Market Revenues & Volume By Product Type for the Period 2022 - 2032F
- Historical Data and Forecast of Lithuania Kick Scooter Market Revenues & Volume By Two Wheeled for the Period 2022 - 2032F
- Historical Data and Forecast of Lithuania Kick Scooter Market Revenues & Volume By Three Wheeled for the Period 2022 - 2032F
- Historical Data and Forecast of Lithuania Kick Scooter Market Revenues & Volume By Battery Type for the Period 2022 - 2032F
- Historical Data and Forecast of Lithuania Kick Scooter Market Revenues & Volume By Lead Based for the Period 2022 - 2032F
- Historical Data and Forecast of Lithuania Kick Scooter Market Revenues & Volume By Nickel Based for the Period 2022 - 2032F
- Historical Data and Forecast of Lithuania Kick Scooter Market Revenues & Volume By Lithium Ion for the Period 2022 - 2032F
- Historical Data and Forecast of Lithuania Kick Scooter Market Revenues & Volume By Price Range for the Period 2022 - 2032F
- Historical Data and Forecast of Lithuania Kick Scooter Market Revenues & Volume By Below US$ 200 for the Period 2022 - 2032F
- Historical Data and Forecast of Lithuania Kick Scooter Market Revenues & Volume By US$ 200 375 for the Period 2022 - 2032F
- Historical Data and Forecast of Lithuania Kick Scooter Market Revenues & Volume By US$ 375.1 750 for the Period 2022 - 2032F
- Historical Data and Forecast of Lithuania Kick Scooter Market Revenues & Volume By US$ 750.1 1,100 for the Period 2022 - 2032F
- Historical Data and Forecast of Lithuania Kick Scooter Market Revenues & Volume By Above US$ 1,100 for the Period 2022 - 2032F
- Historical Data and Forecast of Lithuania Kick Scooter Market Revenues & Volume By Wheel Size for the Period 2022 - 2032F
- Historical Data and Forecast of Lithuania Kick Scooter Market Revenues & Volume By <8 for the Period 2022 - 2032F
- Historical Data and Forecast of Lithuania Kick Scooter Market Revenues & Volume By 8 8.5 for the Period 2022 - 2032F
- Historical Data and Forecast of Lithuania Kick Scooter Market Revenues & Volume By 9 9.5 for the Period 2022 - 2032F
- Historical Data and Forecast of Lithuania Kick Scooter Market Revenues & Volume By 10 10.5 for the Period 2022 - 2032F
- Historical Data and Forecast of Lithuania Kick Scooter Market Revenues & Volume By >11 for the Period 2022 - 2032F
- Historical Data and Forecast of Lithuania Kick Scooter Market Revenues & Volume By End Use for the Period 2022 - 2032F
- Historical Data and Forecast of Lithuania Kick Scooter Market Revenues & Volume By Personal for the Period 2022 - 2032F
- Historical Data and Forecast of Lithuania Kick Scooter Market Revenues & Volume By Rental/ Sharing for the Period 2022 - 2032F
- Historical Data and Forecast of Lithuania Kick Scooter Market Revenues & Volume By Law Enforcement for the Period 2022 - 2032F
- Lithuania Kick Scooter Import Export Trade Statistics
- Market Opportunity Assessment By Product Type
- Market Opportunity Assessment By Battery Type
- Market Opportunity Assessment By Price Range
- Market Opportunity Assessment By Wheel Size
- Market Opportunity Assessment By End Use
- Lithuania Kick Scooter Top Companies Market Share
- Lithuania Kick Scooter Competitive Benchmarking By Technical and Operational Parameters
- Lithuania Kick Scooter Company Profiles
- Lithuania Kick Scooter Key Strategic Recommendations
Frequently Asked Questions About the Market Study (FAQs):
6Wresearch actively monitors the Lithuania Kick Scooter Market and publishes its comprehensive annual report, highlighting emerging trends, growth drivers, revenue analysis, and forecast outlook. Our insights help businesses to make data-backed strategic decisions with ongoing market dynamics. Our analysts track relevent industries related to the Lithuania Kick Scooter Market, allowing our clients with actionable intelligence and reliable forecasts tailored to emerging regional needs.
Yes, we provide customisation as per your requirements. To learn more, feel free to contact us on sales@6wresearch.com
1 Executive Summary |
2 Introduction |
2.1 Key Highlights of the Report |
2.2 Report Description |
2.3 Market Scope & Segmentation |
2.4 Research Methodology |
2.5 Assumptions |
3 Lithuania Kick Scooter Market Overview |
3.1 Lithuania Country Macro Economic Indicators |
3.2 Lithuania Kick Scooter Market Revenues & Volume, 2022 & 2032F |
3.3 Lithuania Kick Scooter Market - Industry Life Cycle |
3.4 Lithuania Kick Scooter Market - Porter's Five Forces |
3.5 Lithuania Kick Scooter Market Revenues & Volume Share, By Product Type, 2022 & 2032F |
3.6 Lithuania Kick Scooter Market Revenues & Volume Share, By Battery Type, 2022 & 2032F |
3.7 Lithuania Kick Scooter Market Revenues & Volume Share, By Price Range, 2022 & 2032F |
3.8 Lithuania Kick Scooter Market Revenues & Volume Share, By Wheel Size, 2022 & 2032F |
3.9 Lithuania Kick Scooter Market Revenues & Volume Share, By End Use, 2022 & 2032F |
4 Lithuania Kick Scooter Market Dynamics |
4.1 Impact Analysis |
4.2 Market Drivers |
4.2.1 Increasing awareness and adoption of eco-friendly transportation solutions |
4.2.2 Growing emphasis on health and fitness, driving interest in outdoor activities like scooter riding |
4.2.3 Government initiatives promoting sustainable mobility options |
4.3 Market Restraints |
4.3.1 Seasonal nature of outdoor activities in Lithuania, impacting scooter usage during winter months |
4.3.2 Limited infrastructure and dedicated lanes for scooters, affecting convenience and safety |
4.3.3 Competition from other micro-mobility options like bicycles and electric scooters |
5 Lithuania Kick Scooter Market Trends |
6 Lithuania Kick Scooter Market Segmentations |
6.1 Lithuania Kick Scooter Market, By Product Type |
6.1.1 Overview and Analysis |
6.1.2 Lithuania Kick Scooter Market Revenues & Volume, By Two Wheeled, 2022 - 2032F |
6.1.3 Lithuania Kick Scooter Market Revenues & Volume, By Three Wheeled, 2022 - 2032F |
6.2 Lithuania Kick Scooter Market, By Battery Type |
6.2.1 Overview and Analysis |
6.2.2 Lithuania Kick Scooter Market Revenues & Volume, By Lead Based, 2022 - 2032F |
6.2.3 Lithuania Kick Scooter Market Revenues & Volume, By Nickel Based, 2022 - 2032F |
6.2.4 Lithuania Kick Scooter Market Revenues & Volume, By Lithium Ion, 2022 - 2032F |
6.3 Lithuania Kick Scooter Market, By Price Range |
6.3.1 Overview and Analysis |
6.3.2 Lithuania Kick Scooter Market Revenues & Volume, By Below US$ 200, 2022 - 2032F |
6.3.3 Lithuania Kick Scooter Market Revenues & Volume, By US$ 200 ? ?? 375, 2022 - 2032F |
6.3.4 Lithuania Kick Scooter Market Revenues & Volume, By US$ 375.1 ? ?? 750, 2022 - 2032F |
6.3.5 Lithuania Kick Scooter Market Revenues & Volume, By US$ 750.1 ? ?? 1,100, 2022 - 2032F |
6.3.6 Lithuania Kick Scooter Market Revenues & Volume, By Above US$ 1,100, 2022 - 2032F |
6.4 Lithuania Kick Scooter Market, By Wheel Size |
6.4.1 Overview and Analysis |
6.4.2 Lithuania Kick Scooter Market Revenues & Volume, By <8? ?? ?, 2022 - 2032F |
6.4.3 Lithuania Kick Scooter Market Revenues & Volume, By 8 ? ?? 8.5? ?? ?, 2022 - 2032F |
6.4.4 Lithuania Kick Scooter Market Revenues & Volume, By 9 ? ?? 9.5? ?? ?, 2022 - 2032F |
6.4.5 Lithuania Kick Scooter Market Revenues & Volume, By 10 ? ?? 10.5? ?? ?, 2022 - 2032F |
6.4.6 Lithuania Kick Scooter Market Revenues & Volume, By >11? ?? ?, 2022 - 2032F |
6.5 Lithuania Kick Scooter Market, By End Use |
6.5.1 Overview and Analysis |
6.5.2 Lithuania Kick Scooter Market Revenues & Volume, By Personal, 2022 - 2032F |
6.5.3 Lithuania Kick Scooter Market Revenues & Volume, By Rental/ Sharing, 2022 - 2032F |
6.5.4 Lithuania Kick Scooter Market Revenues & Volume, By Law Enforcement, 2022 - 2032F |
7 Lithuania Kick Scooter Market Import-Export Trade Statistics |
7.1 Lithuania Kick Scooter Market Export to Major Countries |
7.2 Lithuania Kick Scooter Market Imports from Major Countries |
8 Lithuania Kick Scooter Market Key Performance Indicators |
8.1 Average daily usage time per scooter |
8.2 Number of scooter-sharing stations in key cities |
8.3 Percentage of population using scooters for commuting or leisure activities |
8.4 Average distance covered per scooter ride |
8.5 Number of scooter-related events and competitions held annually |
9 Lithuania Kick Scooter Market - Opportunity Assessment |
9.1 Lithuania Kick Scooter Market Opportunity Assessment, By Product Type, 2022 & 2032F |
9.2 Lithuania Kick Scooter Market Opportunity Assessment, By Battery Type, 2022 & 2032F |
9.3 Lithuania Kick Scooter Market Opportunity Assessment, By Price Range, 2022 & 2032F |
9.4 Lithuania Kick Scooter Market Opportunity Assessment, By Wheel Size, 2022 & 2032F |
9.5 Lithuania Kick Scooter Market Opportunity Assessment, By End Use, 2022 & 2032F |
10 Lithuania Kick Scooter Market - Competitive Landscape |
10.1 Lithuania Kick Scooter Market Revenue Share, By Companies, 2025 |
10.2 Lithuania Kick Scooter Market Competitive Benchmarking, By Operating and Technical Parameters |
11 Company Profiles |
12 Recommendations | 13 Disclaimer |
Export potential assessment - trade Analytics for 2030
Export potential enables firms to identify high-growth global markets with greater confidence by combining advanced trade intelligence with a structured quantitative methodology. The framework analyzes emerging demand trends and country-level import patterns while integrating macroeconomic and trade datasets such as GDP and population forecasts, bilateral import–export flows, tariff structures, elasticity differentials between developed and developing economies, geographic distance, and import demand projections. Using weighted trade values from 2020–2024 as the base period to project country-to-country export potential for 2030, these inputs are operationalized through calculated drivers such as gravity model parameters, tariff impact factors, and projected GDP per-capita growth. Through an analysis of hidden potentials, demand hotspots, and market conditions that are most favorable to success, this method enables firms to focus on target countries, maximize returns, and global expansion with data, backed by accuracy.
By factoring in the projected importer demand gap that is currently unmet and could be potential opportunity, it identifies the potential for the Exporter (Country) among 190 countries, against the general trade analysis, which identifies the biggest importer or exporter.
To discover high-growth global markets and optimize your business strategy:
Click Here
Pricing
- Single User License$ 1,995
- Department License$ 2,400
- Site License$ 3,120
- Global License$ 3,795

Search
Thought Leadership and Analyst Meet


Our Clients
Latest Reports
- Canada Cloud CFD Market (2026-2032) | Size & Revenue, Industry, Growth, Competitive Landscape, Forecast, Segmentation, Value, Outlook, Trends, Share, Analysis, Companies
- Taiwan Food Delivery Platform Market (2026-2032) | Companies, Outlook, Analysis, Trends, Value, Revenue, Segmentation, Share, Forecast, Competitive Landscape, Growth, Size & Forecast
- United Kingdom (UK) Long-term Care Insurance Market (2026-2032) | Growth, Share, Consumer Insights, Drivers, Opportunities, Competition, Pricing Analysis, Segments, Restraints, Companies, Competitive, Value, Outlook, Size, Demand, Analysis, Challenges, Strategic Insights, Investment Trends, Revenue, Trends, Supply, Forecast
- United Kingdom (UK) Long Term Care Market (2026-2032) | Companies, Outlook, Analysis, Trends, Value, Revenue, Segmentation, Share, Forecast, Competitive Landscape, Growth, Size & Forecast
- Iraq Insulation and Waterproofing Market (2026-2032) | Outlook, Drivers, Growth, Size, Share, Industry, Revenue, Trends, Demand, Competitive, Strategic Insights, Opportunities, Segments, Companies, Challenges, Strategy, Consumer Insights, Analysis, Investment Trends, Value, Segmentation, Forecast, Restraints
- India Switchgear Market Outlook (2026-2032) | Size, Share, Trends, Growth, Revenue, Forecast, Analysis, Value, Outlook
- Pakistan Contraceptive Implants Market (2025-2031) | Demand, Growth, Size, Share, Industry, Pricing Analysis, Competitive, Strategic Insights, Strategy, Consumer Insights, Analysis, Investment Trends, Opportunities, Revenue, Segments, Value, Segmentation, Supply, Forecast, Restraints, Outlook, Competition, Drivers, Trends, Companies, Challenges
- Sri Lanka Packaging Market (2026-2032) | Outlook, Competition, Drivers, Trends, Demand, Pricing Analysis, Competitive, Strategic Insights, Companies, Challenges, Strategy, Consumer Insights, Analysis, Investment Trends, Opportunities, Growth, Size, Share, Industry, Revenue, Segments, Value, Segmentation, Supply, Forecast, Restraints
- India Kids Watches Market (2026-2032) | Strategy, Consumer Insights, Analysis, Investment Trends, Opportunities, Growth, Size, Share, Industry, Revenue, Segments, Value, Segmentation, Supply, Forecast, Restraints, Outlook, Competition, Drivers, Trends, Demand, Pricing Analysis, Competitive, Strategic Insights, Companies, Challenges
- Saudi Arabia Core Assurance Service Market (2025-2031) | Strategy, Consumer Insights, Analysis, Investment Trends, Opportunities, Growth, Size, Share, Industry, Revenue, Segments, Value, Segmentation, Supply, Forecast, Restraints, Outlook, Competition, Drivers, Trends, Demand, Pricing Analysis, Competitive, Strategic Insights, Companies, Challenges
Industry Events and Analyst Meet

India EV Show 2026

EV tech India Expo 2026

Auto Tech Asia 2026

Battery Tech India 2026

Smart Production Solutions Guangzhou 2026
Whitepaper
- Middle East & Africa Commercial Security Market Click here to view more.
- Middle East & Africa Fire Safety Systems & Equipment Market Click here to view more.
- GCC Drone Market Click here to view more.
- Middle East Lighting Fixture Market Click here to view more.
- GCC Physical & Perimeter Security Market Click here to view more.
6WResearch In News
- Doha a strategic location for EV manufacturing hub: IPA Qatar
- Demand for luxury TVs surging in the GCC, says Samsung
- Empowering Growth: The Thriving Journey of Bangladesh’s Cable Industry
- Demand for luxury TVs surging in the GCC, says Samsung
- Video call with a traditional healer? Once unthinkable, it’s now common in South Africa
- Intelligent Buildings To Smooth GCC’s Path To Net Zero