Lithuania Laser Projection Market (2026-2032) | Outlook, Industry, Value, Trends, Companies, Analysis, Revenue, Segmentation, Share, Size, Forecast & Growth
Market Forecast By Product Type (Laser Projector , CAD Laser Projection System), By Illumination Type (Laser Phosphor, Hybrid, RGB Laser, Laser Diode), By Vertical (Enterprise, Public Places, Cinema, Education, Retail, Medical, Industrial), By Resolution (WUXGA, WQXGA, and 2K, 4K, WXGA and XGA, HD and Full HD, Others) And Competitive Landscape
| Product Code: ETC5600803 | Publication Date: Nov 2023 | Updated Date: Mar 2026 | Product Type: Market Research Report | |
| Publisher: 6Wresearch | Author: Ravi Bhandari | No. of Pages: 60 | No. of Figures: 30 | No. of Tables: 5 |
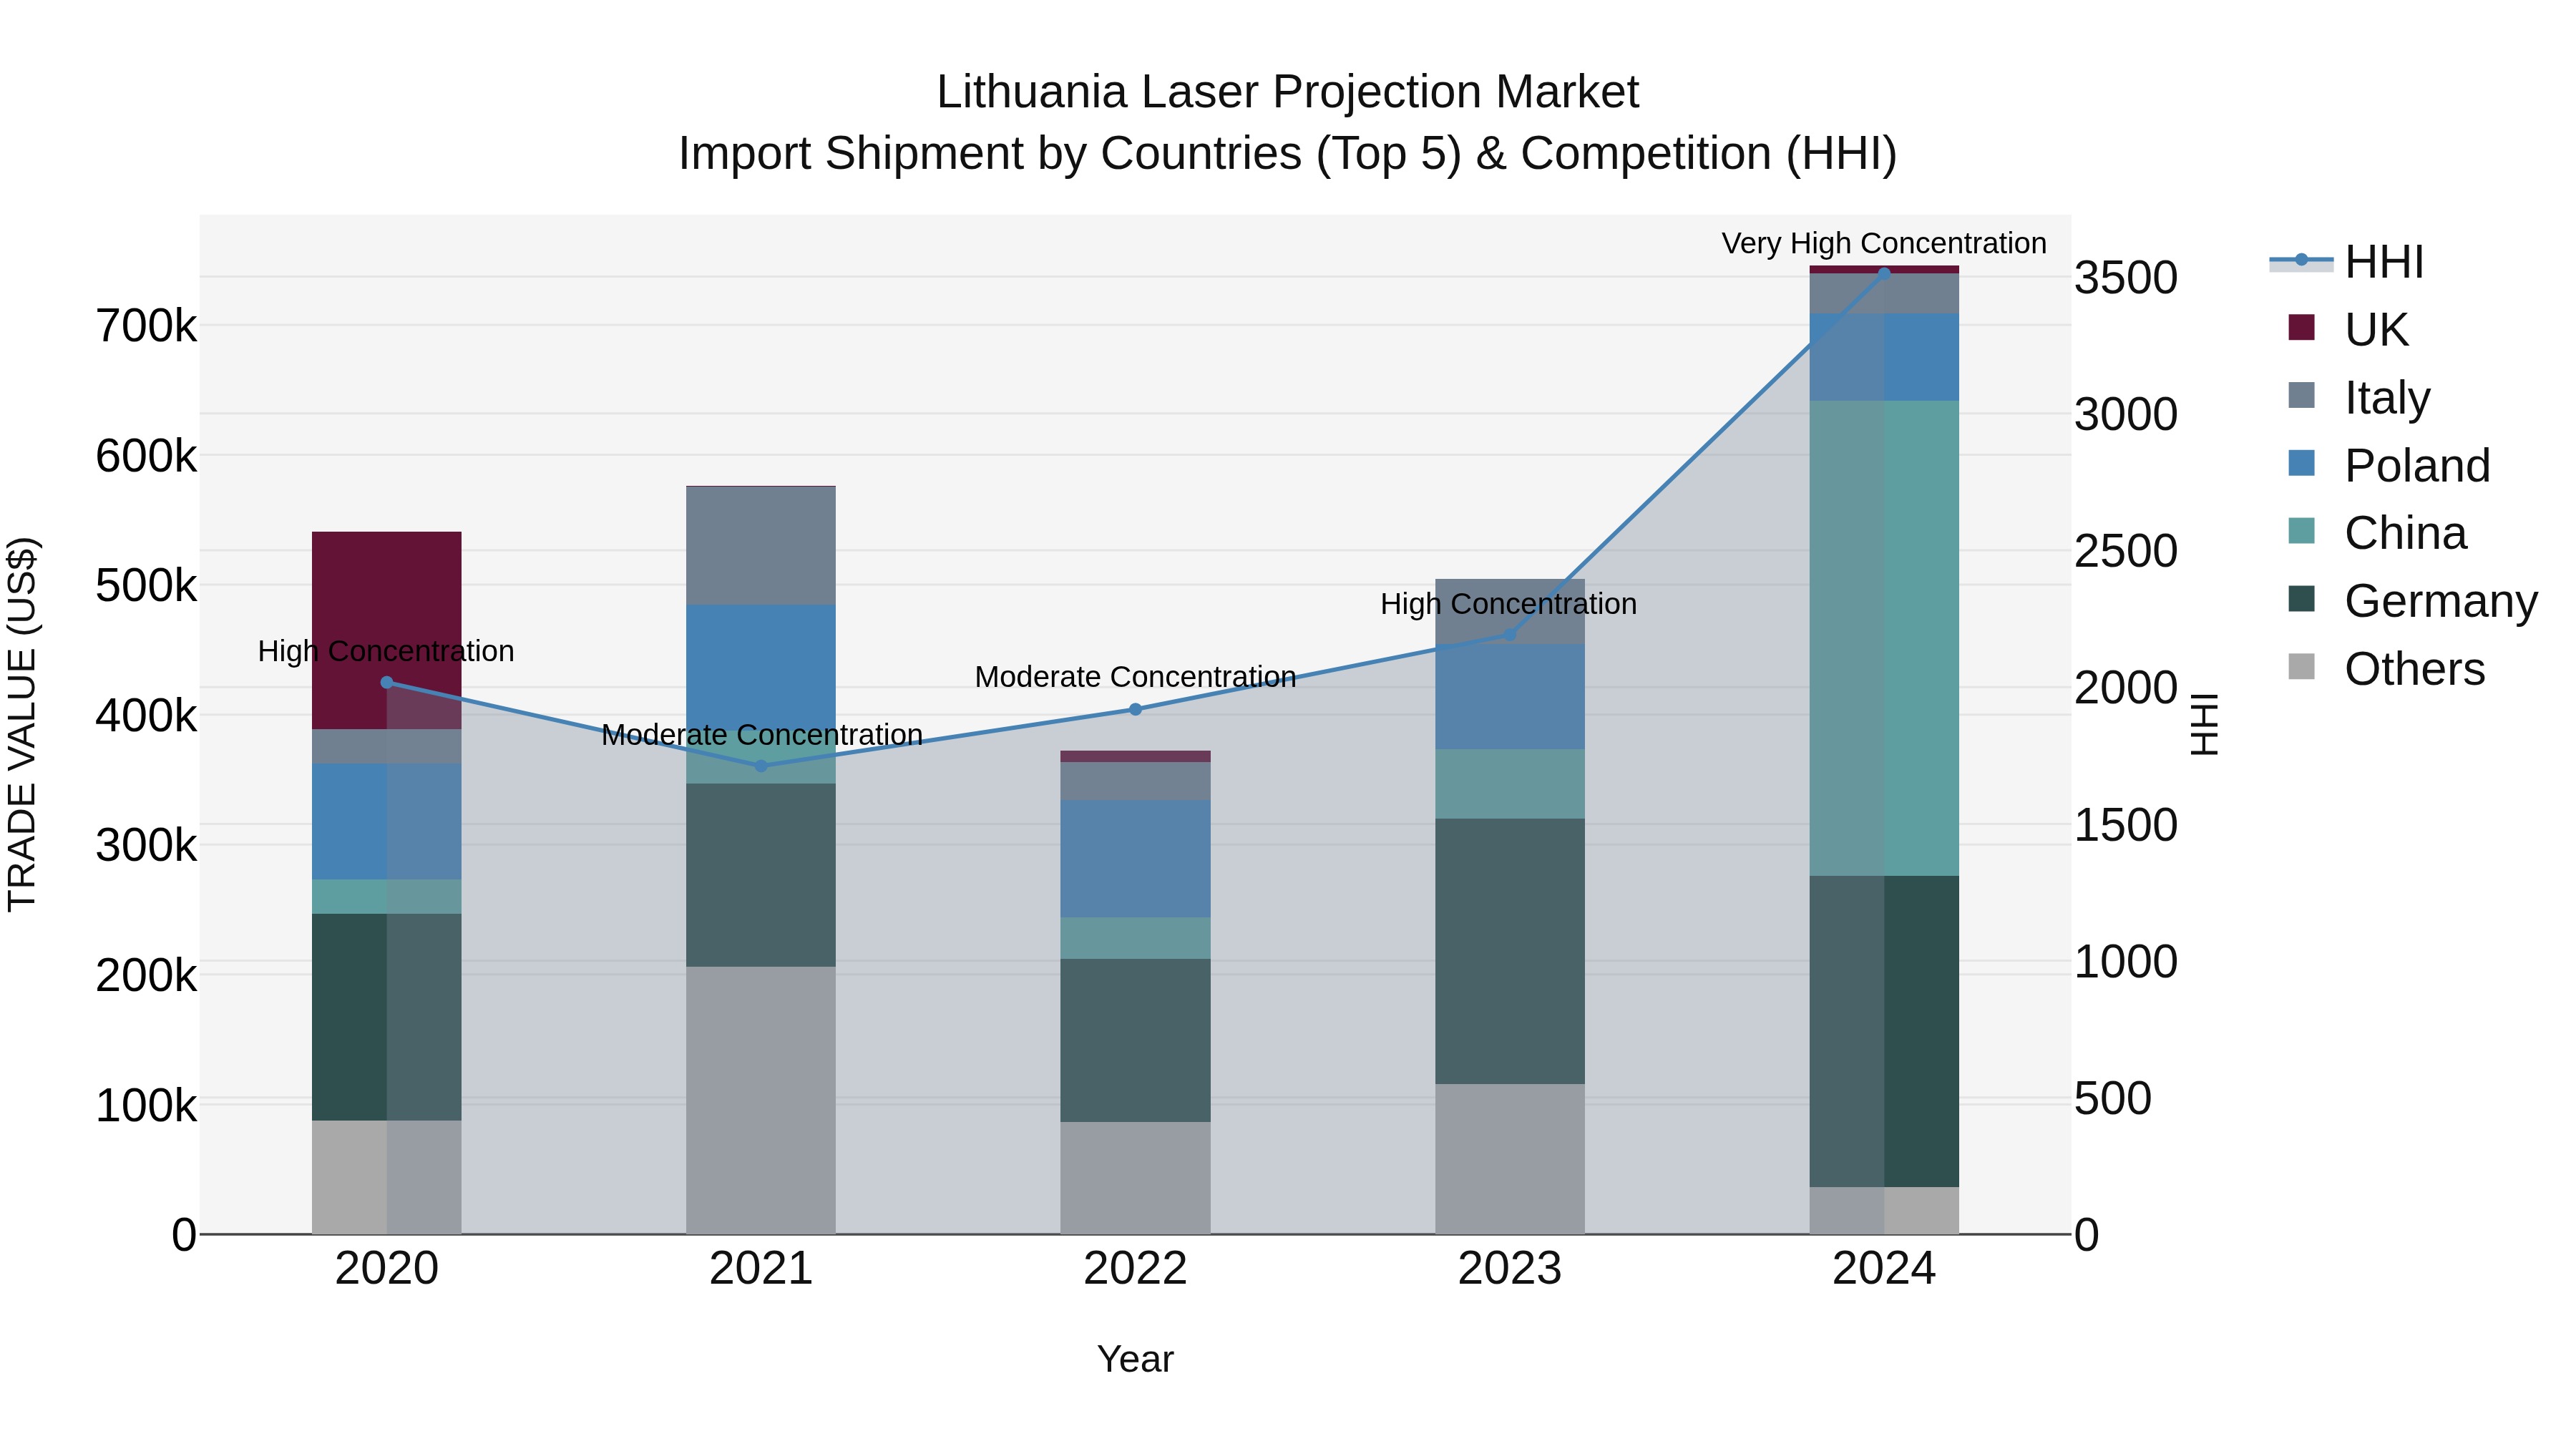
Lithuania Laser Projection Market Top 5 Importing Countries and Market Competition (HHI) Analysis
Lithuania`s laser projection import market saw significant growth in 2024, with China, Germany, Poland, Italy, and Latvia leading the pack as the top exporting countries. The market exhibited a very high concentration level, indicating a strong dominance by key players. With a notable Compound Annual Growth Rate (CAGR) of 8.37% from 2020 to 2024 and an impressive growth rate of 47.81% from 2023 to 2024, the laser projection sector in Lithuania is showing promising potential for further expansion and development in the coming years.
Key Highlights of the Report:
- Lithuania Laser Projection Market Outlook
- Market Size of Lithuania Laser Projection Market, 2025
- Forecast of Lithuania Laser Projection Market, 2032
- Historical Data and Forecast of Lithuania Laser Projection Revenues & Volume for the Period 2022 - 2032F
- Lithuania Laser Projection Market Trend Evolution
- Lithuania Laser Projection Market Drivers and Challenges
- Lithuania Laser Projection Price Trends
- Lithuania Laser Projection Porter`s Five Forces
- Lithuania Laser Projection Industry Life Cycle
- Historical Data and Forecast of Lithuania Laser Projection Market Revenues & Volume By Product Type for the Period 2022 - 2032F
- Historical Data and Forecast of Lithuania Laser Projection Market Revenues & Volume By Laser Projector for the Period 2022 - 2032F
- Historical Data and Forecast of Lithuania Laser Projection Market Revenues & Volume By CAD Laser Projection System for the Period 2022 - 2032F
- Historical Data and Forecast of Lithuania Laser Projection Market Revenues & Volume By Illumination Type for the Period 2022 - 2032F
- Historical Data and Forecast of Lithuania Laser Projection Market Revenues & Volume By Laser Phosphor for the Period 2022 - 2032F
- Historical Data and Forecast of Lithuania Laser Projection Market Revenues & Volume By Hybrid for the Period 2022 - 2032F
- Historical Data and Forecast of Lithuania Laser Projection Market Revenues & Volume By RGB Laser for the Period 2022 - 2032F
- Historical Data and Forecast of Lithuania Laser Projection Market Revenues & Volume By Laser Diode for the Period 2022 - 2032F
- Historical Data and Forecast of Lithuania Laser Projection Market Revenues & Volume By Vertical for the Period 2022 - 2032F
- Historical Data and Forecast of Lithuania Laser Projection Market Revenues & Volume By Enterprise for the Period 2022 - 2032F
- Historical Data and Forecast of Lithuania Laser Projection Market Revenues & Volume By Public Places for the Period 2022 - 2032F
- Historical Data and Forecast of Lithuania Laser Projection Market Revenues & Volume By Cinema for the Period 2022 - 2032F
- Historical Data and Forecast of Lithuania Laser Projection Market Revenues & Volume By Education for the Period 2022 - 2032F
- Historical Data and Forecast of Lithuania Laser Projection Market Revenues & Volume By Retail for the Period 2022 - 2032F
- Historical Data and Forecast of Lithuania Laser Projection Market Revenues & Volume By Medical for the Period 2022 - 2032F
- Historical Data and Forecast of Lithuania Laser Projection Market Revenues & Volume By Industrial for the Period 2022 - 2032F
- Historical Data and Forecast of Lithuania Laser Projection Market Revenues & Volume By Resolution for the Period 2022 - 2032F
- Historical Data and Forecast of Lithuania Laser Projection Market Revenues & Volume By WUXGA, WQXGA, and 2K for the Period 2022 - 2032F
- Historical Data and Forecast of Lithuania Laser Projection Market Revenues & Volume By 4K for the Period 2022 - 2032F
- Historical Data and Forecast of Lithuania Laser Projection Market Revenues & Volume By WXGA and XGA for the Period 2022 - 2032F
- Historical Data and Forecast of Lithuania Laser Projection Market Revenues & Volume By HD and Full HD for the Period 2022 - 2032F
- Historical Data and Forecast of Lithuania Laser Projection Market Revenues & Volume By Others for the Period 2022 - 2032F
- Lithuania Laser Projection Import Export Trade Statistics
- Market Opportunity Assessment By Product Type
- Market Opportunity Assessment By Illumination Type
- Market Opportunity Assessment By Vertical
- Market Opportunity Assessment By Resolution
- Lithuania Laser Projection Top Companies Market Share
- Lithuania Laser Projection Competitive Benchmarking By Technical and Operational Parameters
- Lithuania Laser Projection Company Profiles
- Lithuania Laser Projection Key Strategic Recommendations
Frequently Asked Questions About the Market Study (FAQs):
6Wresearch actively monitors the Lithuania Laser Projection Market and publishes its comprehensive annual report, highlighting emerging trends, growth drivers, revenue analysis, and forecast outlook. Our insights help businesses to make data-backed strategic decisions with ongoing market dynamics. Our analysts track relevent industries related to the Lithuania Laser Projection Market, allowing our clients with actionable intelligence and reliable forecasts tailored to emerging regional needs.
Yes, we provide customisation as per your requirements. To learn more, feel free to contact us on sales@6wresearch.com
1 Executive Summary |
2 Introduction |
2.1 Key Highlights of the Report |
2.2 Report Description |
2.3 Market Scope & Segmentation |
2.4 Research Methodology |
2.5 Assumptions |
3 Lithuania Laser Projection Market Overview |
3.1 Lithuania Country Macro Economic Indicators |
3.2 Lithuania Laser Projection Market Revenues & Volume, 2022 & 2032F |
3.3 Lithuania Laser Projection Market - Industry Life Cycle |
3.4 Lithuania Laser Projection Market - Porter's Five Forces |
3.5 Lithuania Laser Projection Market Revenues & Volume Share, By Product Type , 2022 & 2032F |
3.6 Lithuania Laser Projection Market Revenues & Volume Share, By Illumination Type , 2022 & 2032F |
3.7 Lithuania Laser Projection Market Revenues & Volume Share, By Vertical, 2022 & 2032F |
3.8 Lithuania Laser Projection Market Revenues & Volume Share, By Resolution, 2022 & 2032F |
4 Lithuania Laser Projection Market Dynamics |
4.1 Impact Analysis |
4.2 Market Drivers |
4.2.1 Increasing demand for high-quality visual experiences in various sectors like education, entertainment, and corporate settings. |
4.2.2 Technological advancements leading to improved laser projection systems with better brightness, resolution, and energy efficiency. |
4.2.3 Growing trend towards digitalization and smart solutions driving the adoption of laser projection technology. |
4.3 Market Restraints |
4.3.1 High initial investment costs associated with laser projection systems may deter some potential buyers. |
4.3.2 Limited awareness and understanding of the benefits of laser projection technology among consumers and businesses. |
4.3.3 Competition from other display technologies like LED displays and traditional projectors can pose a challenge to the growth of the laser projection market. |
5 Lithuania Laser Projection Market Trends |
6 Lithuania Laser Projection Market Segmentations |
6.1 Lithuania Laser Projection Market, By Product Type |
6.1.1 Overview and Analysis |
6.1.2 Lithuania Laser Projection Market Revenues & Volume, By Laser Projector , 2022 - 2032F |
6.1.3 Lithuania Laser Projection Market Revenues & Volume, By CAD Laser Projection System, 2022 - 2032F |
6.2 Lithuania Laser Projection Market, By Illumination Type |
6.2.1 Overview and Analysis |
6.2.2 Lithuania Laser Projection Market Revenues & Volume, By Laser Phosphor, 2022 - 2032F |
6.2.3 Lithuania Laser Projection Market Revenues & Volume, By Hybrid, 2022 - 2032F |
6.2.4 Lithuania Laser Projection Market Revenues & Volume, By RGB Laser, 2022 - 2032F |
6.2.5 Lithuania Laser Projection Market Revenues & Volume, By Laser Diode, 2022 - 2032F |
6.3 Lithuania Laser Projection Market, By Vertical |
6.3.1 Overview and Analysis |
6.3.2 Lithuania Laser Projection Market Revenues & Volume, By Enterprise, 2022 - 2032F |
6.3.3 Lithuania Laser Projection Market Revenues & Volume, By Public Places, 2022 - 2032F |
6.3.4 Lithuania Laser Projection Market Revenues & Volume, By Cinema, 2022 - 2032F |
6.3.5 Lithuania Laser Projection Market Revenues & Volume, By Education, 2022 - 2032F |
6.3.6 Lithuania Laser Projection Market Revenues & Volume, By Retail, 2022 - 2032F |
6.3.7 Lithuania Laser Projection Market Revenues & Volume, By Medical, 2022 - 2032F |
6.4 Lithuania Laser Projection Market, By Resolution |
6.4.1 Overview and Analysis |
6.4.2 Lithuania Laser Projection Market Revenues & Volume, By WUXGA, WQXGA, and 2K, 2022 - 2032F |
6.4.3 Lithuania Laser Projection Market Revenues & Volume, By 4K, 2022 - 2032F |
6.4.4 Lithuania Laser Projection Market Revenues & Volume, By WXGA and XGA, 2022 - 2032F |
6.4.5 Lithuania Laser Projection Market Revenues & Volume, By HD and Full HD, 2022 - 2032F |
6.4.6 Lithuania Laser Projection Market Revenues & Volume, By Others, 2022 - 2032F |
7 Lithuania Laser Projection Market Import-Export Trade Statistics |
7.1 Lithuania Laser Projection Market Export to Major Countries |
7.2 Lithuania Laser Projection Market Imports from Major Countries |
8 Lithuania Laser Projection Market Key Performance Indicators |
8.1 Average lifespan of laser projection systems in Lithuania. |
8.2 Adoption rate of laser projection technology in key sectors such as education, entertainment, and corporate. |
8.3 Number of partnerships or collaborations between laser projection technology providers and key players in the Lithuanian market. |
9 Lithuania Laser Projection Market - Opportunity Assessment |
9.1 Lithuania Laser Projection Market Opportunity Assessment, By Product Type , 2022 & 2032F |
9.2 Lithuania Laser Projection Market Opportunity Assessment, By Illumination Type , 2022 & 2032F |
9.3 Lithuania Laser Projection Market Opportunity Assessment, By Vertical, 2022 & 2032F |
9.4 Lithuania Laser Projection Market Opportunity Assessment, By Resolution, 2022 & 2032F |
10 Lithuania Laser Projection Market - Competitive Landscape |
10.1 Lithuania Laser Projection Market Revenue Share, By Companies, 2025 |
10.2 Lithuania Laser Projection Market Competitive Benchmarking, By Operating and Technical Parameters |
11 Company Profiles |
12 Recommendations | 13 Disclaimer |
Global Go To Market Strategy - 2030
Export potential enables firms to identify high-growth global markets with greater confidence by combining advanced trade intelligence with a structured quantitative methodology. The framework analyzes emerging demand trends and country-level import patterns while integrating macroeconomic and trade datasets such as GDP and population forecasts, bilateral import–export flows, tariff structures, elasticity differentials between developed and developing economies, geographic distance, and import demand projections. Using weighted trade values from 2020–2024 as the base period to project country-to-country export potential for 2030, these inputs are operationalized through calculated drivers such as gravity model parameters, tariff impact factors, and projected GDP per-capita growth. Through an analysis of hidden potentials, demand hotspots, and market conditions that are most favorable to success, this method enables firms to focus on target countries, maximize returns, and global expansion with data, backed by accuracy.
By factoring in the projected importer demand gap that is currently unmet and could be potential opportunity, it identifies the potential for the Exporter (Country) among 190 countries, against the general trade analysis, which identifies the biggest importer or exporter.
To discover high-growth global markets and optimize your business strategy:
Click Here
Pricing
- Single User License$ 1,995
- Department License$ 2,400
- Site License$ 3,120
- Global License$ 3,795

Leadership Perspectives from Industry Events
Search
Thought Leadership and Analyst Meet


Our Clients
6WResearch In News
- Doha a strategic location for EV manufacturing hub: IPA Qatar
- Demand for luxury TVs surging in the GCC, says Samsung
- Empowering Growth: The Thriving Journey of Bangladesh’s Cable Industry
- Demand for luxury TVs surging in the GCC, says Samsung
- Video call with a traditional healer? Once unthinkable, it’s now common in South Africa
- Intelligent Buildings To Smooth GCC’s Path To Net Zero
Latest Reports
- Cape Verde Portable Hand-Thrown Extinguisher Market (2026-2032)
- Canada Portable Hand-Thrown Extinguisher Market (2026-2032)
- Cameroon Portable Hand-Thrown Extinguisher Market (2026-2032)
- Burundi Portable Hand-Thrown Extinguisher Market (2026-2032)
- Burkina Faso Portable Hand-Thrown Extinguisher Market (2026-2032)
- Bulgaria Portable Hand-Thrown Extinguisher Market (2026-2032)
- Brunei Portable Hand-Thrown Extinguisher Market (2026-2032)
- Botswana Portable Hand-Thrown Extinguisher Market (2026-2032)
- Bosnia and Herzegovina Portable Hand-Thrown Extinguisher Market (2026-2032)
- Bolivia Portable Hand-Thrown Extinguisher Market (2026-2032)
Industry Events and Analyst Meet

HIMTEX 2026

India Refining Summit 2026

India EV Show 2026

EV tech India Expo 2026

Auto Tech Asia 2026
Whitepaper
- Middle East & Africa Commercial Security Market Click here to view more.
- Middle East & Africa Fire Safety Systems & Equipment Market Click here to view more.
- GCC Drone Market Click here to view more.
- Middle East Lighting Fixture Market Click here to view more.
- GCC Physical & Perimeter Security Market Click here to view more.