Lithuania Lecithin Market (2026-2032) | Companies, Value, Size, Industry, Share, Outlook, Segmentation, Forecast, Analysis, Growth, Revenue & Trends
Market Forecast By Source (Soy, Sunflower, Rapeseed, Others), By End-use (Convenience Food, Bakery, Confectionary, Pharmaceutical, Personal Care And Cosmetics, Animal Feed, Other Industrial), By Form (Liquid, Powder, Granules) And Competitive Landscape
| Product Code: ETC5359560 | Publication Date: Nov 2023 | Updated Date: Apr 2026 | Product Type: Market Research Report | |
| Publisher: 6Wresearch | Author: Ravi Bhandari | No. of Pages: 60 | No. of Figures: 30 | No. of Tables: 5 |
Lithuania Lecithin Market Size (2020-2030)
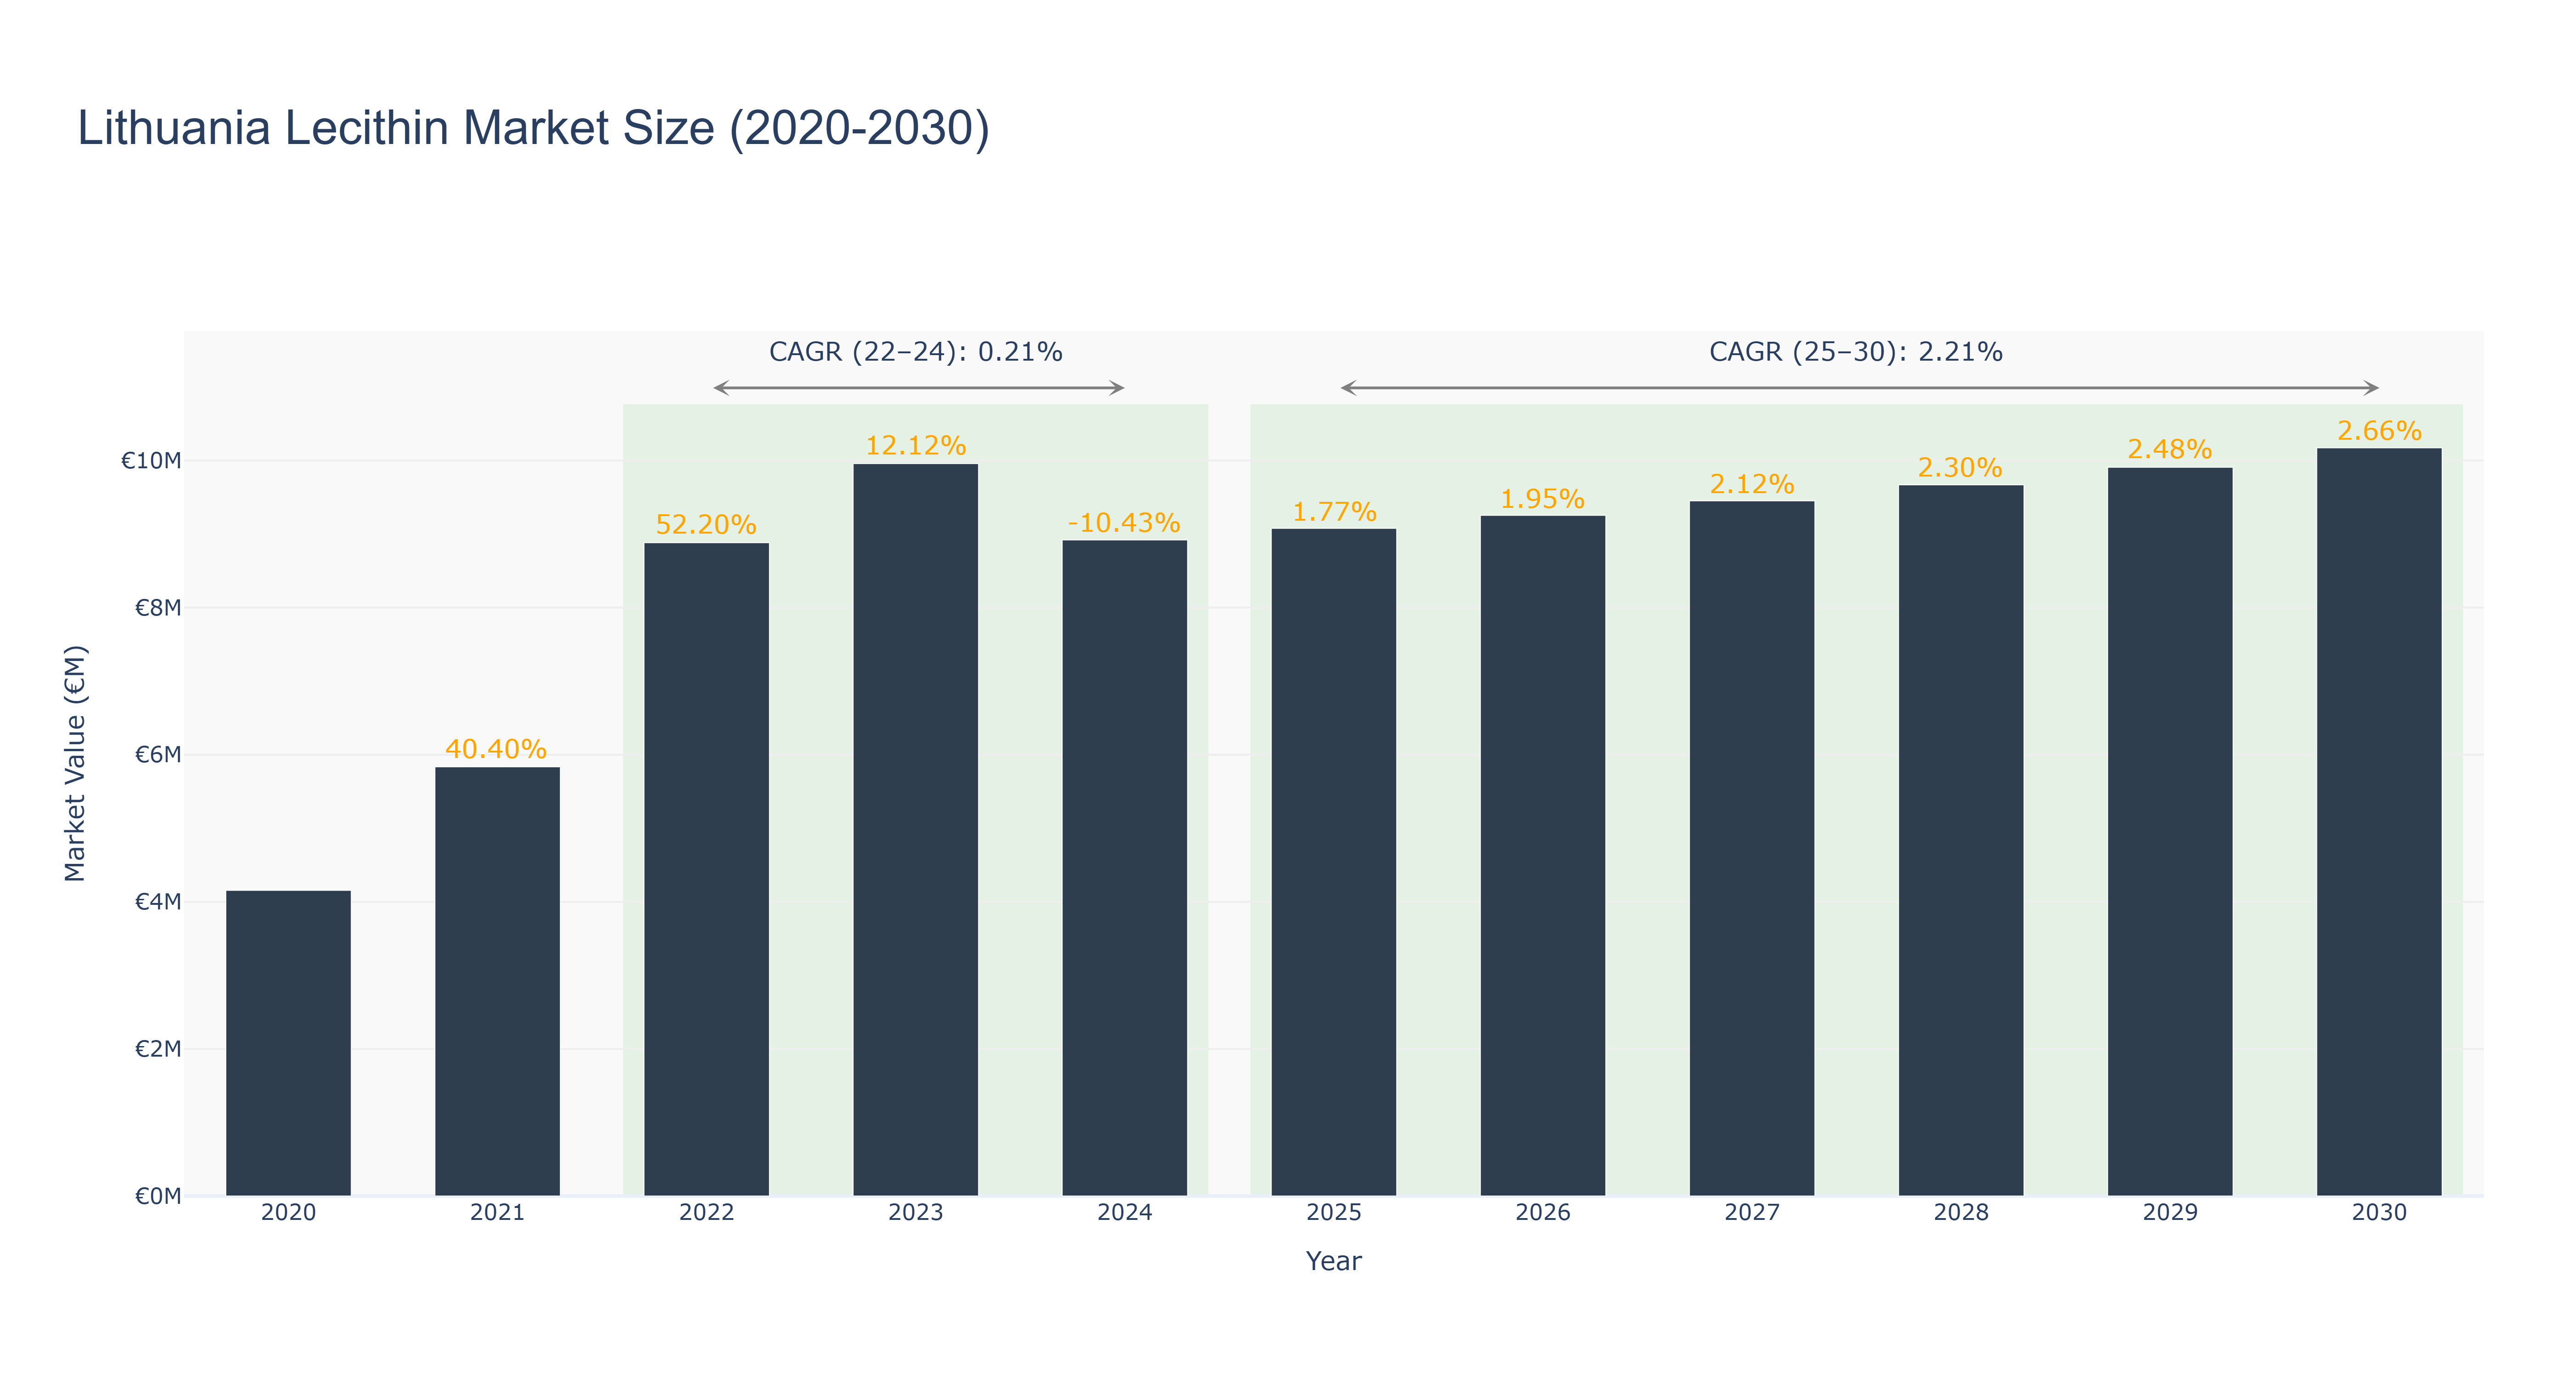
Lithuania Lecithin Market has shown a steady growth trajectory over the years. The peak market size was €10.17 million in 2030, with forecasted growth continuing till then. The actual market size saw fluctuations from €4.16 million in 2020 to €8.92 million in 2024, followed by an upward trend reaching €10.17 million in 2030. The CAGR values for the periods 2022-24 and 2025-30 were 0.214% and 2.21%, respectively. The market experienced a decline in 2024 due to external economic factors but rebounded swiftly. Industry drivers like increasing health consciousness and demand for natural emulsifiers have fueled this market's growth. Looking ahead, Lithuania is set to introduce new regulations promoting sustainable sourcing of lecithin, aligning with global environmental initiatives.
Lithuania Lecithin Market: Production & Trade Performance (2019-2025)
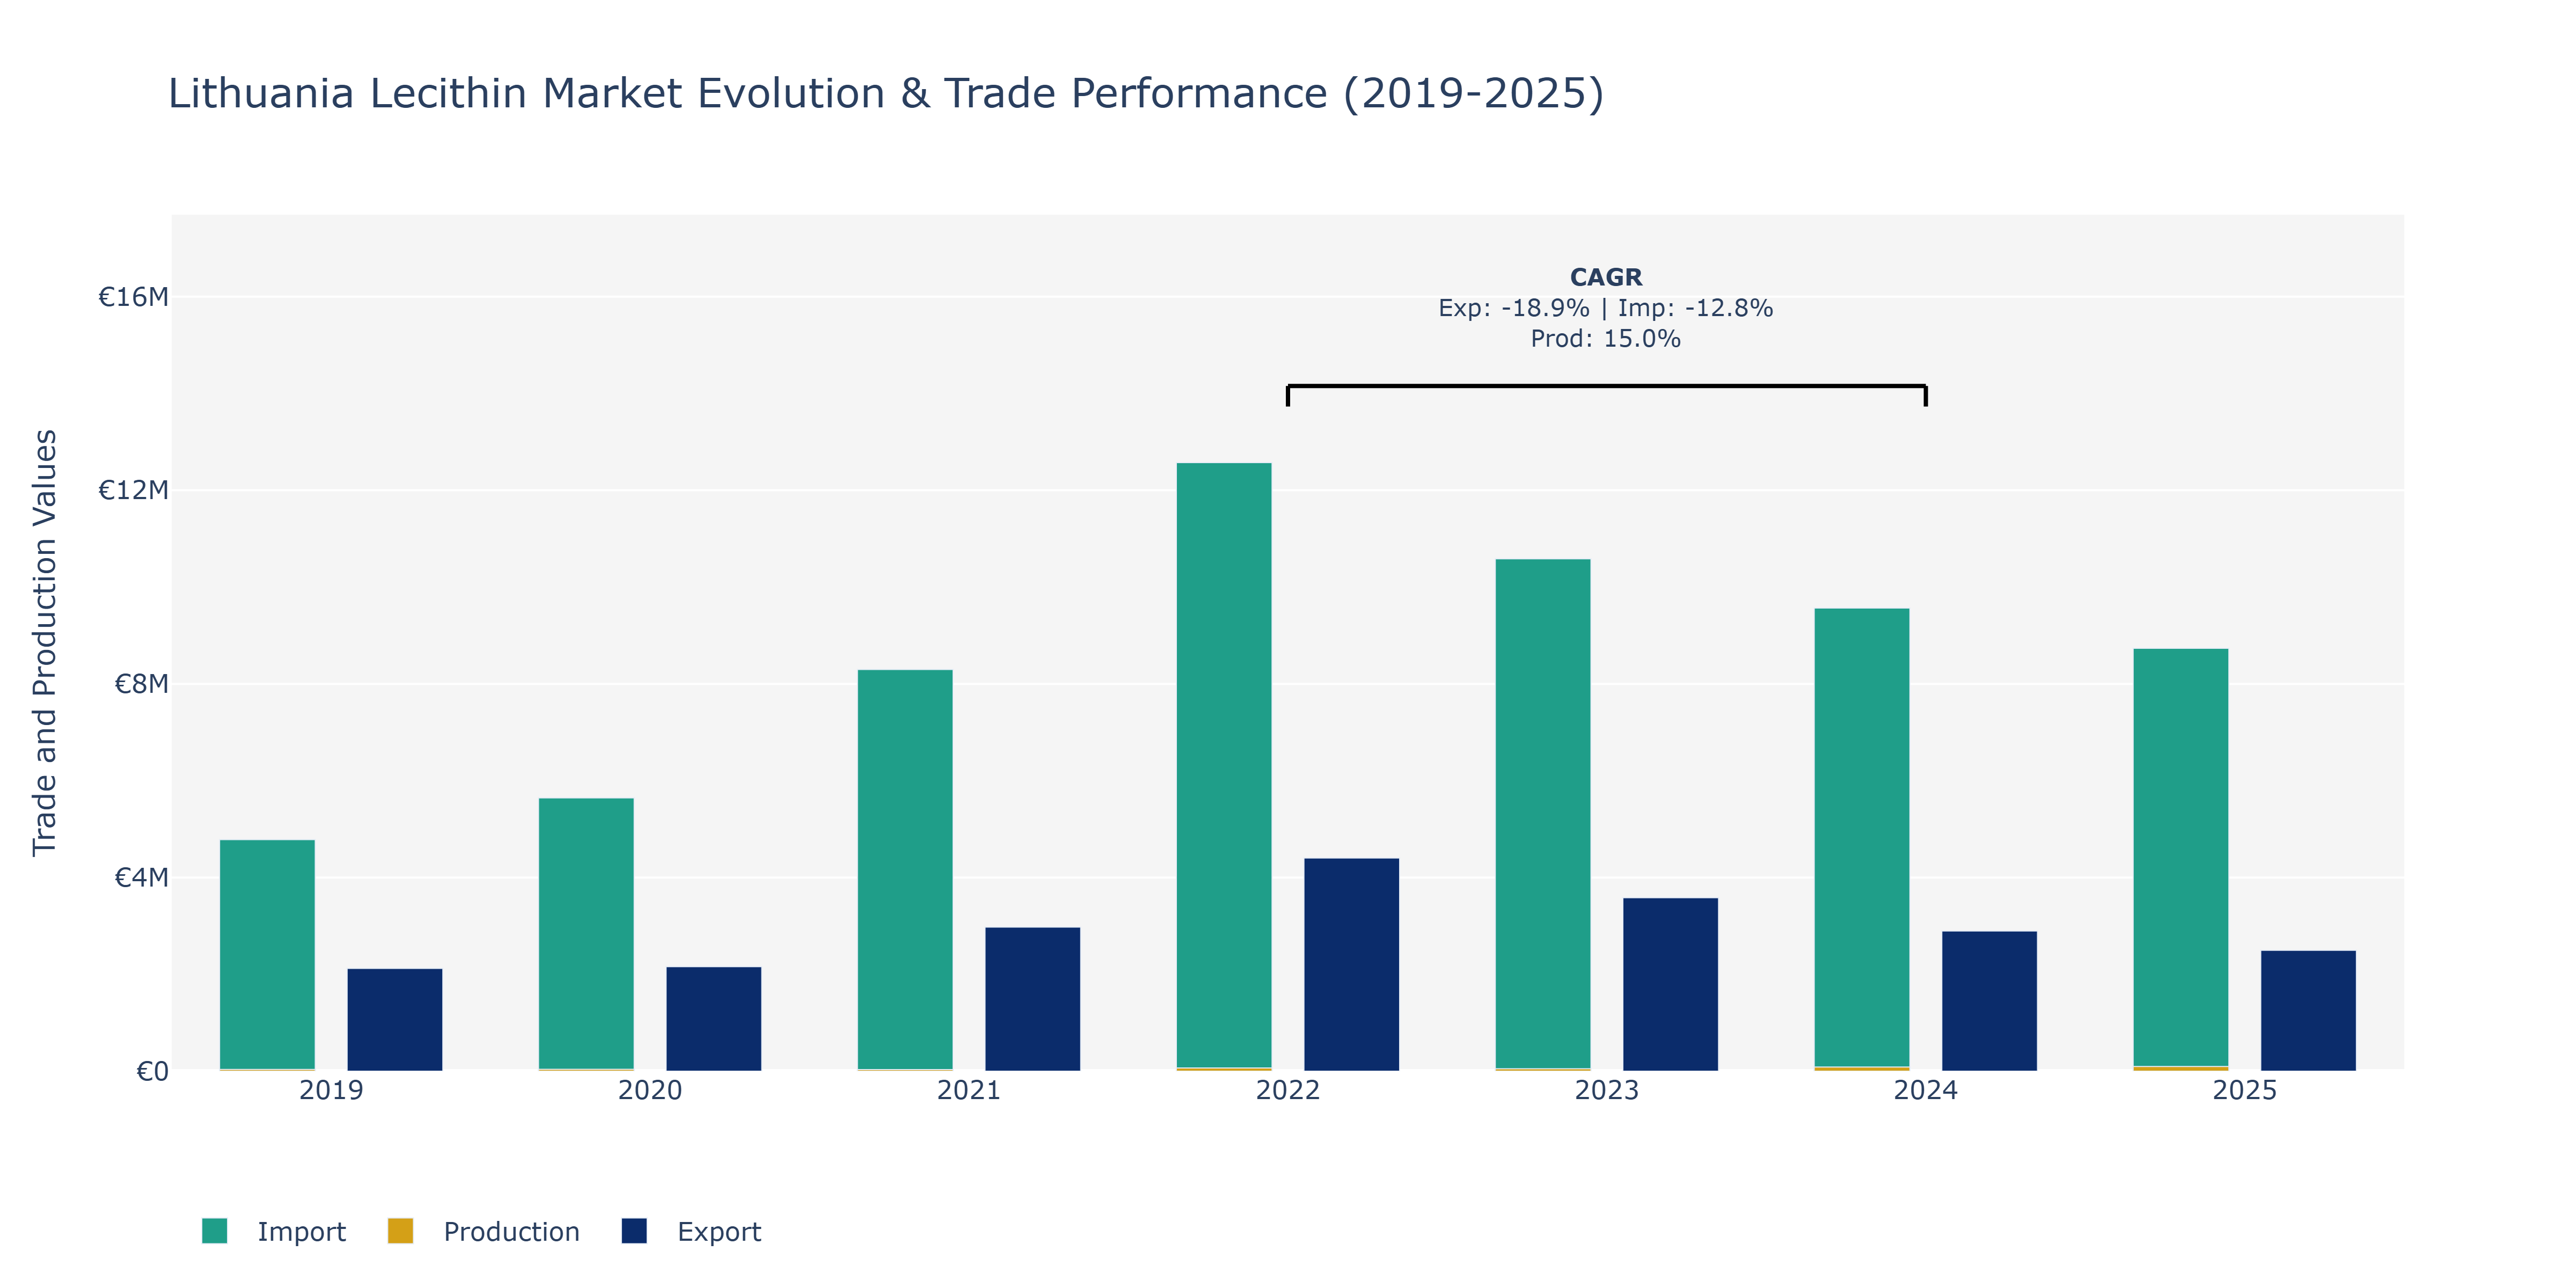
Between 2019 and 2025, the Lithuania Lecithin Market witnessed varying trends in Exports, Imports, and Production. Exports showed a gradual decline from a peak of €4.4 million in 2022 to €2.5 million in 2025. Conversely, Imports surged consistently, reaching €8.74 million in 2025 from €4.78 million in 2019. Production displayed fluctuating patterns, peaking at €97.5 million in 2025, showcasing a notable 15.03% increase from 2022. The fluctuations in Exports could be attributed to global demand shifts for lecithin-based products, while the steady rise in Imports might reflect Lithuania's increased dependency on foreign sources. The growth in Production could be linked to advancements in manufacturing technologies and increased domestic consumption. These trends emphasize the market's responsiveness to both domestic and international factors, underlining the need for strategic planning and market agility in the Lithuania Lecithin Market.
Key Highlights of the Report:
- Lithuania Lecithin Market Outlook
- Market Size of Lithuania Lecithin Market, 2025
- Forecast of Lithuania Lecithin Market, 2032
- Historical Data and Forecast of Lithuania Lecithin Revenues & Volume for the Period 2022 - 2032F
- Lithuania Lecithin Market Trend Evolution
- Lithuania Lecithin Market Drivers and Challenges
- Lithuania Lecithin Price Trends
- Lithuania Lecithin Porter`s Five Forces
- Lithuania Lecithin Industry Life Cycle
- Historical Data and Forecast of Lithuania Lecithin Market Revenues & Volume By Source for the Period 2022 - 2032F
- Historical Data and Forecast of Lithuania Lecithin Market Revenues & Volume By Soy for the Period 2022 - 2032F
- Historical Data and Forecast of Lithuania Lecithin Market Revenues & Volume By Sunflower for the Period 2022 - 2032F
- Historical Data and Forecast of Lithuania Lecithin Market Revenues & Volume By Rapeseed for the Period 2022 - 2032F
- Historical Data and Forecast of Lithuania Lecithin Market Revenues & Volume By Others for the Period 2022 - 2032F
- Historical Data and Forecast of Lithuania Lecithin Market Revenues & Volume By End-use for the Period 2022 - 2032F
- Historical Data and Forecast of Lithuania Lecithin Market Revenues & Volume By Convenience Food for the Period 2022 - 2032F
- Historical Data and Forecast of Lithuania Lecithin Market Revenues & Volume By Bakery for the Period 2022 - 2032F
- Historical Data and Forecast of Lithuania Lecithin Market Revenues & Volume By Confectionary for the Period 2022 - 2032F
- Historical Data and Forecast of Lithuania Lecithin Market Revenues & Volume By Pharmaceutical for the Period 2022 - 2032F
- Historical Data and Forecast of Lithuania Lecithin Market Revenues & Volume By Personal Care And Cosmetics for the Period 2022 - 2032F
- Historical Data and Forecast of Lithuania Lecithin Market Revenues & Volume By Animal Feed for the Period 2022 - 2032F
- Historical Data and Forecast of Lithuania Lecithin Market Revenues & Volume By Other Industrial for the Period 2022 - 2032F
- Historical Data and Forecast of Lithuania Lecithin Market Revenues & Volume By Form for the Period 2022 - 2032F
- Historical Data and Forecast of Lithuania Lecithin Market Revenues & Volume By Liquid for the Period 2022 - 2032F
- Historical Data and Forecast of Lithuania Lecithin Market Revenues & Volume By Powder for the Period 2022 - 2032F
- Historical Data and Forecast of Lithuania Lecithin Market Revenues & Volume By Granules for the Period 2022 - 2032F
- Lithuania Lecithin Import Export Trade Statistics
- Market Opportunity Assessment By Source
- Market Opportunity Assessment By End-use
- Market Opportunity Assessment By Form
- Lithuania Lecithin Top Companies Market Share
- Lithuania Lecithin Competitive Benchmarking By Technical and Operational Parameters
- Lithuania Lecithin Company Profiles
- Lithuania Lecithin Key Strategic Recommendations
Frequently Asked Questions About the Market Study (FAQs):
6Wresearch actively monitors the Lithuania Lecithin Market and publishes its comprehensive annual report, highlighting emerging trends, growth drivers, revenue analysis, and forecast outlook. Our insights help businesses to make data-backed strategic decisions with ongoing market dynamics. Our analysts track relevent industries related to the Lithuania Lecithin Market, allowing our clients with actionable intelligence and reliable forecasts tailored to emerging regional needs.
Yes, we provide customisation as per your requirements. To learn more, feel free to contact us on sales@6wresearch.com
1 Executive Summary |
2 Introduction |
2.1 Key Highlights of the Report |
2.2 Report Description |
2.3 Market Scope & Segmentation |
2.4 Research Methodology |
2.5 Assumptions |
3 Lithuania Lecithin Market Overview |
3.1 Lithuania Country Macro Economic Indicators |
3.2 Lithuania Lecithin Market Revenues & Volume, 2022 & 2032F |
3.3 Lithuania Lecithin Market - Industry Life Cycle |
3.4 Lithuania Lecithin Market - Porter's Five Forces |
3.5 Lithuania Lecithin Market Revenues & Volume Share, By Source, 2022 & 2032F |
3.6 Lithuania Lecithin Market Revenues & Volume Share, By End-use, 2022 & 2032F |
3.7 Lithuania Lecithin Market Revenues & Volume Share, By Form, 2022 & 2032F |
4 Lithuania Lecithin Market Dynamics |
4.1 Impact Analysis |
4.2 Market Drivers |
4.2.1 Increasing consumer awareness about health benefits of lecithin |
4.2.2 Growing demand for natural emulsifiers in food and beverage industry |
4.2.3 Rise in adoption of lecithin in pharmaceuticals for its functional properties |
4.3 Market Restraints |
4.3.1 Fluctuating prices of raw materials impacting production costs |
4.3.2 Stringent regulations related to GMO lecithin in the European market |
5 Lithuania Lecithin Market Trends |
6 Lithuania Lecithin Market Segmentations |
6.1 Lithuania Lecithin Market, By Source |
6.1.1 Overview and Analysis |
6.1.2 Lithuania Lecithin Market Revenues & Volume, By Soy, 2022 - 2032F |
6.1.3 Lithuania Lecithin Market Revenues & Volume, By Sunflower, 2022 - 2032F |
6.1.4 Lithuania Lecithin Market Revenues & Volume, By Rapeseed, 2022 - 2032F |
6.1.5 Lithuania Lecithin Market Revenues & Volume, By Others, 2022 - 2032F |
6.2 Lithuania Lecithin Market, By End-use |
6.2.1 Overview and Analysis |
6.2.2 Lithuania Lecithin Market Revenues & Volume, By Convenience Food, 2022 - 2032F |
6.2.3 Lithuania Lecithin Market Revenues & Volume, By Bakery, 2022 - 2032F |
6.2.4 Lithuania Lecithin Market Revenues & Volume, By Confectionary, 2022 - 2032F |
6.2.5 Lithuania Lecithin Market Revenues & Volume, By Pharmaceutical, 2022 - 2032F |
6.2.6 Lithuania Lecithin Market Revenues & Volume, By Personal Care And Cosmetics, 2022 - 2032F |
6.2.7 Lithuania Lecithin Market Revenues & Volume, By Animal Feed, 2022 - 2032F |
6.3 Lithuania Lecithin Market, By Form |
6.3.1 Overview and Analysis |
6.3.2 Lithuania Lecithin Market Revenues & Volume, By Liquid, 2022 - 2032F |
6.3.3 Lithuania Lecithin Market Revenues & Volume, By Powder, 2022 - 2032F |
6.3.4 Lithuania Lecithin Market Revenues & Volume, By Granules, 2022 - 2032F |
7 Lithuania Lecithin Market Import-Export Trade Statistics |
7.1 Lithuania Lecithin Market Export to Major Countries |
7.2 Lithuania Lecithin Market Imports from Major Countries |
8 Lithuania Lecithin Market Key Performance Indicators |
8.1 Percentage increase in demand from the food industry for lecithin applications |
8.2 Number of new product launches containing lecithin as an ingredient |
8.3 Growth in research and development investments in lecithin applications |
9 Lithuania Lecithin Market - Opportunity Assessment |
9.1 Lithuania Lecithin Market Opportunity Assessment, By Source, 2022 & 2032F |
9.2 Lithuania Lecithin Market Opportunity Assessment, By End-use, 2022 & 2032F |
9.3 Lithuania Lecithin Market Opportunity Assessment, By Form, 2022 & 2032F |
10 Lithuania Lecithin Market - Competitive Landscape |
10.1 Lithuania Lecithin Market Revenue Share, By Companies, 2025 |
10.2 Lithuania Lecithin Market Competitive Benchmarking, By Operating and Technical Parameters |
11 Company Profiles |
12 Recommendations | 13 Disclaimer |
Global Go To Market Strategy - 2030
Export potential enables firms to identify high-growth global markets with greater confidence by combining advanced trade intelligence with a structured quantitative methodology. The framework analyzes emerging demand trends and country-level import patterns while integrating macroeconomic and trade datasets such as GDP and population forecasts, bilateral import–export flows, tariff structures, elasticity differentials between developed and developing economies, geographic distance, and import demand projections. Using weighted trade values from 2020–2024 as the base period to project country-to-country export potential for 2030, these inputs are operationalized through calculated drivers such as gravity model parameters, tariff impact factors, and projected GDP per-capita growth. Through an analysis of hidden potentials, demand hotspots, and market conditions that are most favorable to success, this method enables firms to focus on target countries, maximize returns, and global expansion with data, backed by accuracy.
By factoring in the projected importer demand gap that is currently unmet and could be potential opportunity, it identifies the potential for the Exporter (Country) among 190 countries, against the general trade analysis, which identifies the biggest importer or exporter.
To discover high-growth global markets and optimize your business strategy:
Click Here
Pricing
- Single User License$ 1,995
- Department License$ 2,400
- Site License$ 3,120
- Global License$ 3,795

Leadership Perspectives from Industry Events
Search
Thought Leadership and Analyst Meet


Our Clients
6WResearch In News
- India Air Conditioner Market Set for Strong Rebound in 2026 After Weather-Led Correction and GST-Driven Recovery: 6Wresearch
- ADAS in India: How Automatic Emergency Braking, Blind Spot Detection & Driver Monitoring are Transforming Road Safety
- Doha a strategic location for EV manufacturing hub: IPA Qatar
- Demand for luxury TVs surging in the GCC, says Samsung
- Empowering Growth: The Thriving Journey of Bangladesh’s Cable Industry
- Demand for luxury TVs surging in the GCC, says Samsung
Latest Reports
- Poland Fire Protection Systems Market (2026-2032)
- Cape Verde Portable Hand-Thrown Extinguisher Market (2026-2032)
- Canada Portable Hand-Thrown Extinguisher Market (2026-2032)
- Cameroon Portable Hand-Thrown Extinguisher Market (2026-2032)
- Burundi Portable Hand-Thrown Extinguisher Market (2026-2032)
- Burkina Faso Portable Hand-Thrown Extinguisher Market (2026-2032)
- Bulgaria Portable Hand-Thrown Extinguisher Market (2026-2032)
- Brunei Portable Hand-Thrown Extinguisher Market (2026-2032)
- Botswana Portable Hand-Thrown Extinguisher Market (2026-2032)
- Bosnia and Herzegovina Portable Hand-Thrown Extinguisher Market (2026-2032)
Industry Events and Analyst Meet

HIMTEX 2026

India Refining Summit 2026

India EV Show 2026

EV tech India Expo 2026

Auto Tech Asia 2026
Whitepaper
- Middle East & Africa Commercial Security Market Click here to view more.
- Middle East & Africa Fire Safety Systems & Equipment Market Click here to view more.
- GCC Drone Market Click here to view more.
- Middle East Lighting Fixture Market Click here to view more.
- GCC Physical & Perimeter Security Market Click here to view more.