Lithuania Lignin Derivatives Market (2026-2032) | Companies, Drivers, Demand, Challenges, Size, Outlook, Share, Strategic Insights, Opportunities, Forecast, Growth, Consumer Insights, Revenue, Competitive, Segments, Supply, Segmentation, Competition, Analysis, Strategy, Pricing Analysis, Value, Industry, Restraints, Investment Trends, Trends
Market Forecast By Technology Type (Sulfonation, Oxidation, Hydrogenation), By Application (Concrete Additives, Animal Feed, Cosmetics, Dye Production), By End User (Construction Companies, Livestock Farmers, Personal Care Manufacturers, Textile Industries), By Product Type (Lignosulfonates, Vanillin, Phenolic Resins, Kraft Lignin) And Competitive Landscape
| Product Code: ETC12535674 | Publication Date: Apr 2025 | Updated Date: Apr 2026 | Product Type: Market Research Report | |
| Publisher: 6Wresearch | Author: Sachin Kumar Rai | No. of Pages: 65 | No. of Figures: 34 | No. of Tables: 19 |
Lithuania Lignin Derivatives Market Size (2020-2030)
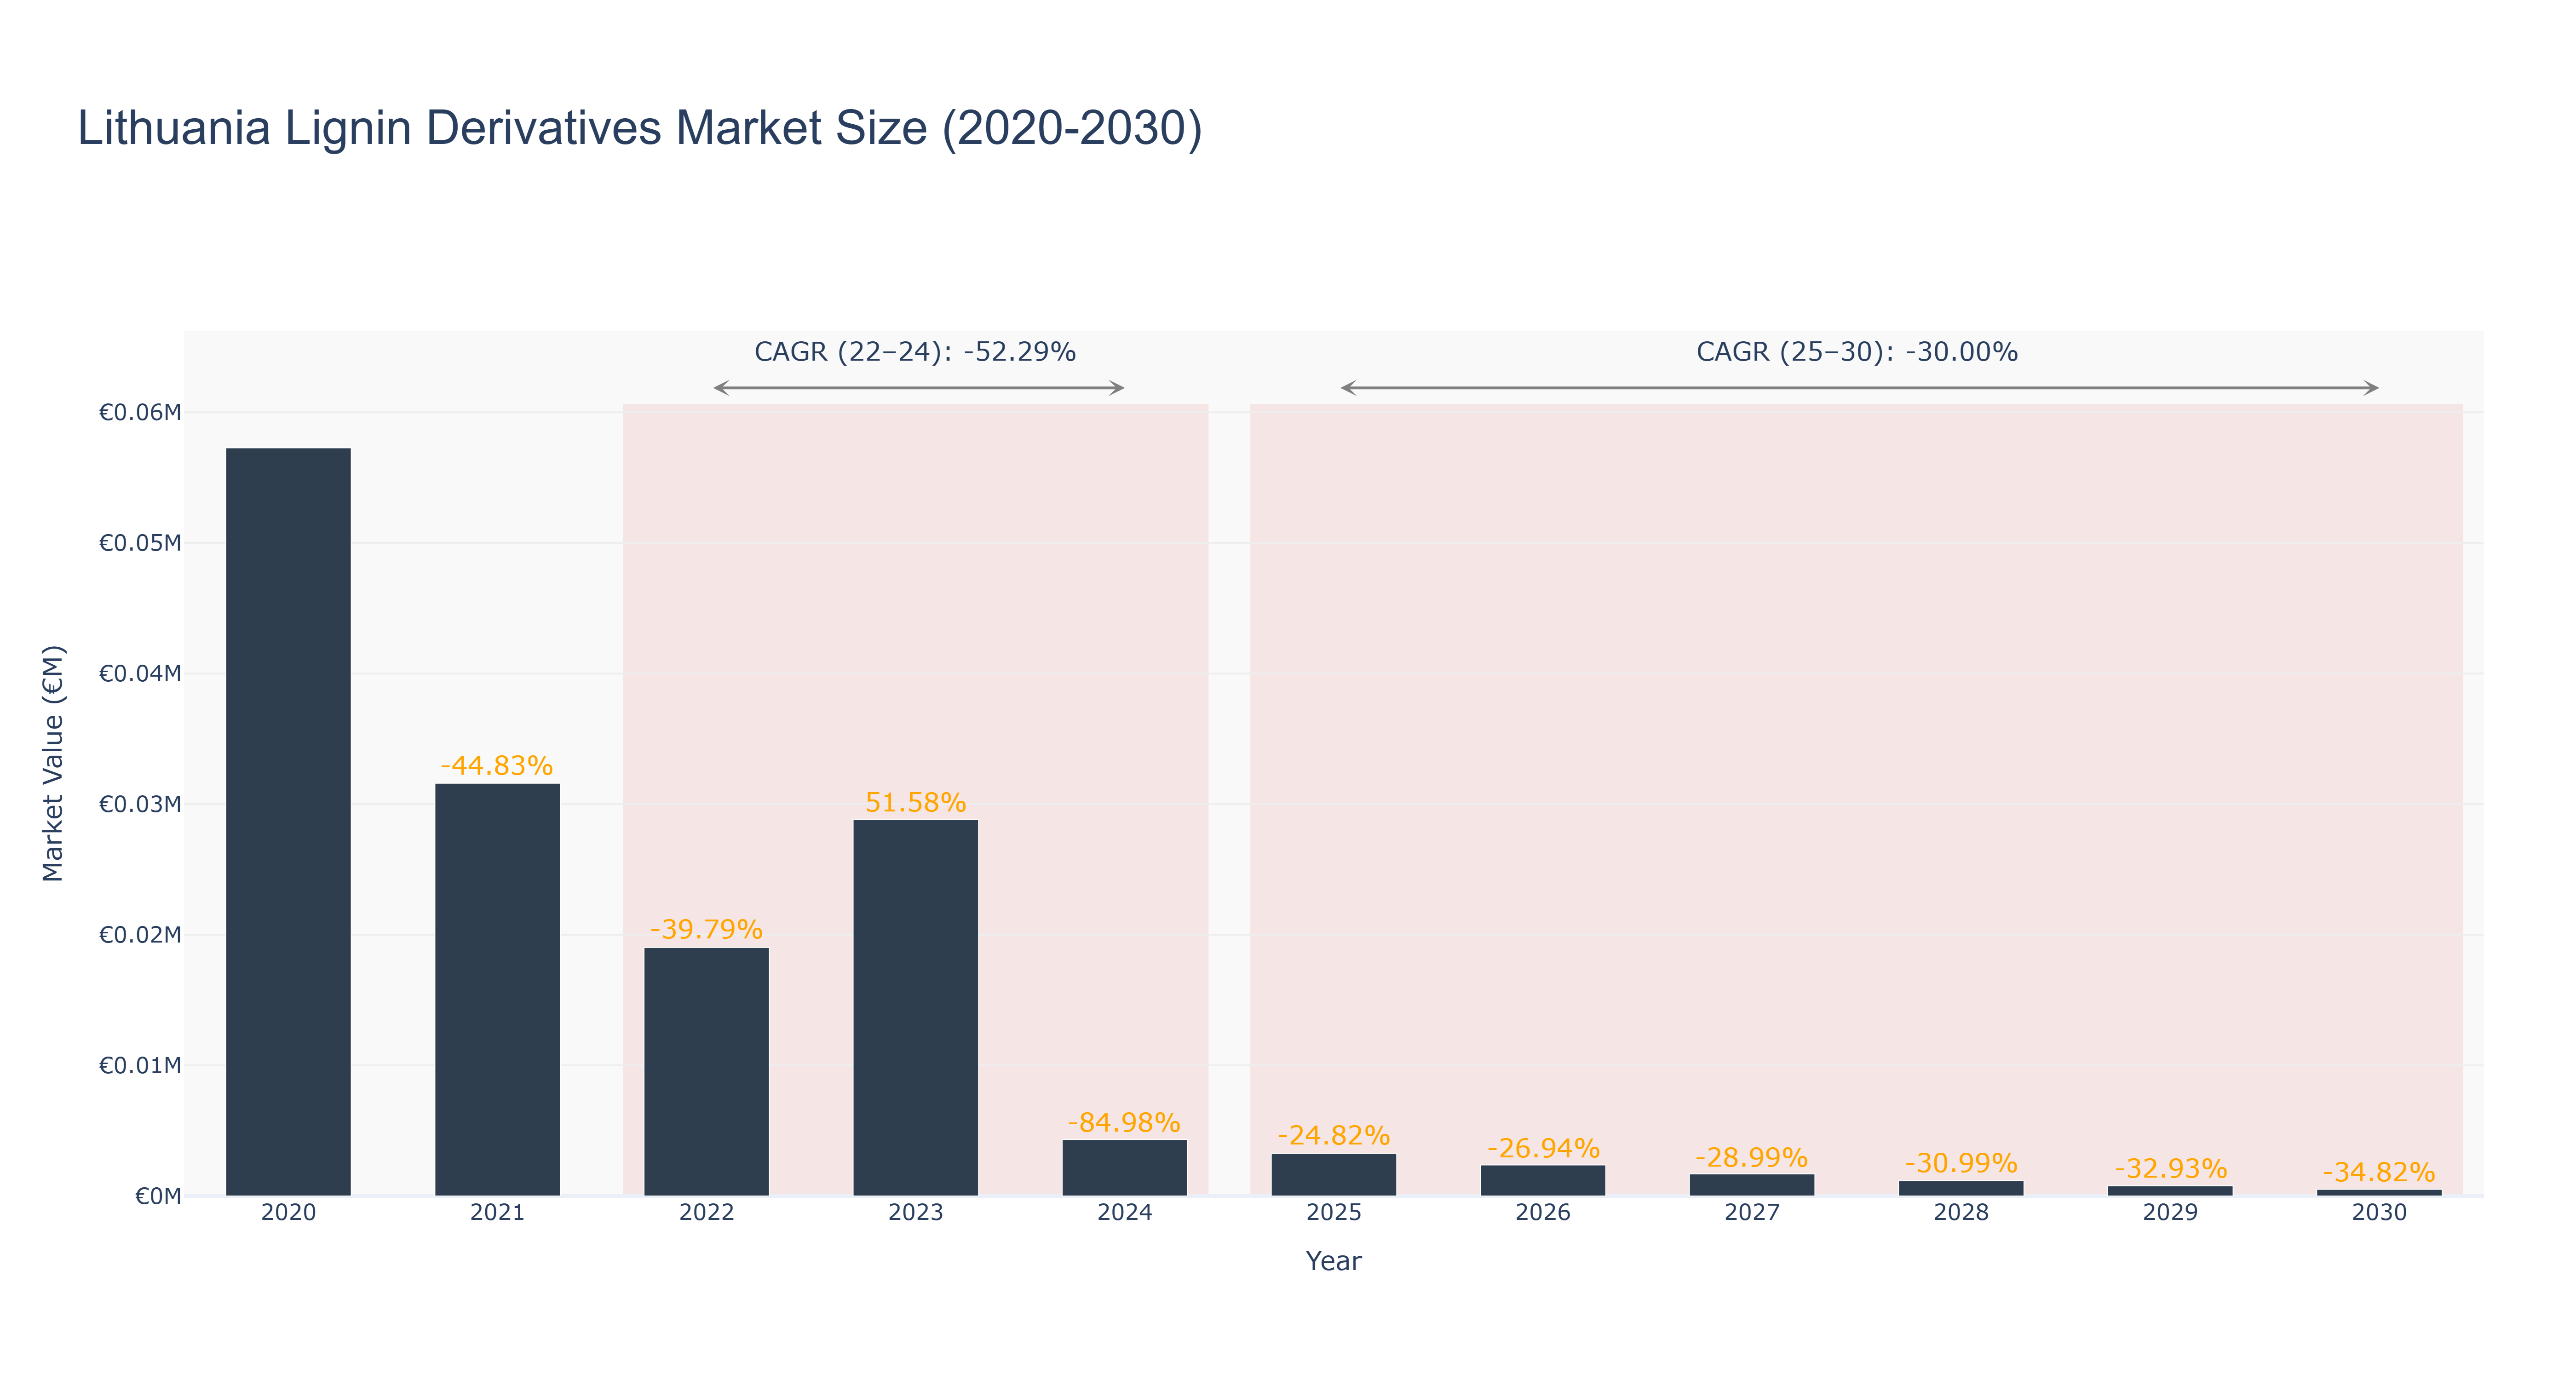
The Lithuania Lignin Derivatives Market has experienced a volatile trajectory, peaking at €57.28 thousand in 2020 before declining sharply in subsequent years. The actual market size decreased to €31.60 thousand in 2021 and further to €19.03 thousand in 2022, reflecting a compounded annual growth rate (CAGR) of -52.29% from 2022 to 2024, with a projected market size of €4.33 thousand in 2024. The market witnessed a temporary rebound in 2023, reaching €28.84 thousand, but is expected to decline again, with forecasted sizes of €3.26 thousand in 2025 and €1.69 thousand by 2027, translating to a CAGR of -30.00% for the 2025-2030 period. Key factors contributing to this decline include shifts in demand dynamics and competition from alternative materials. Future developments in sustainable practices and innovations in lignin utilization may provide some stabilization, but overall market prospects remain challenging.
Lithuania Lignin Derivatives Market: Production & Trade Performance (2019-2025)
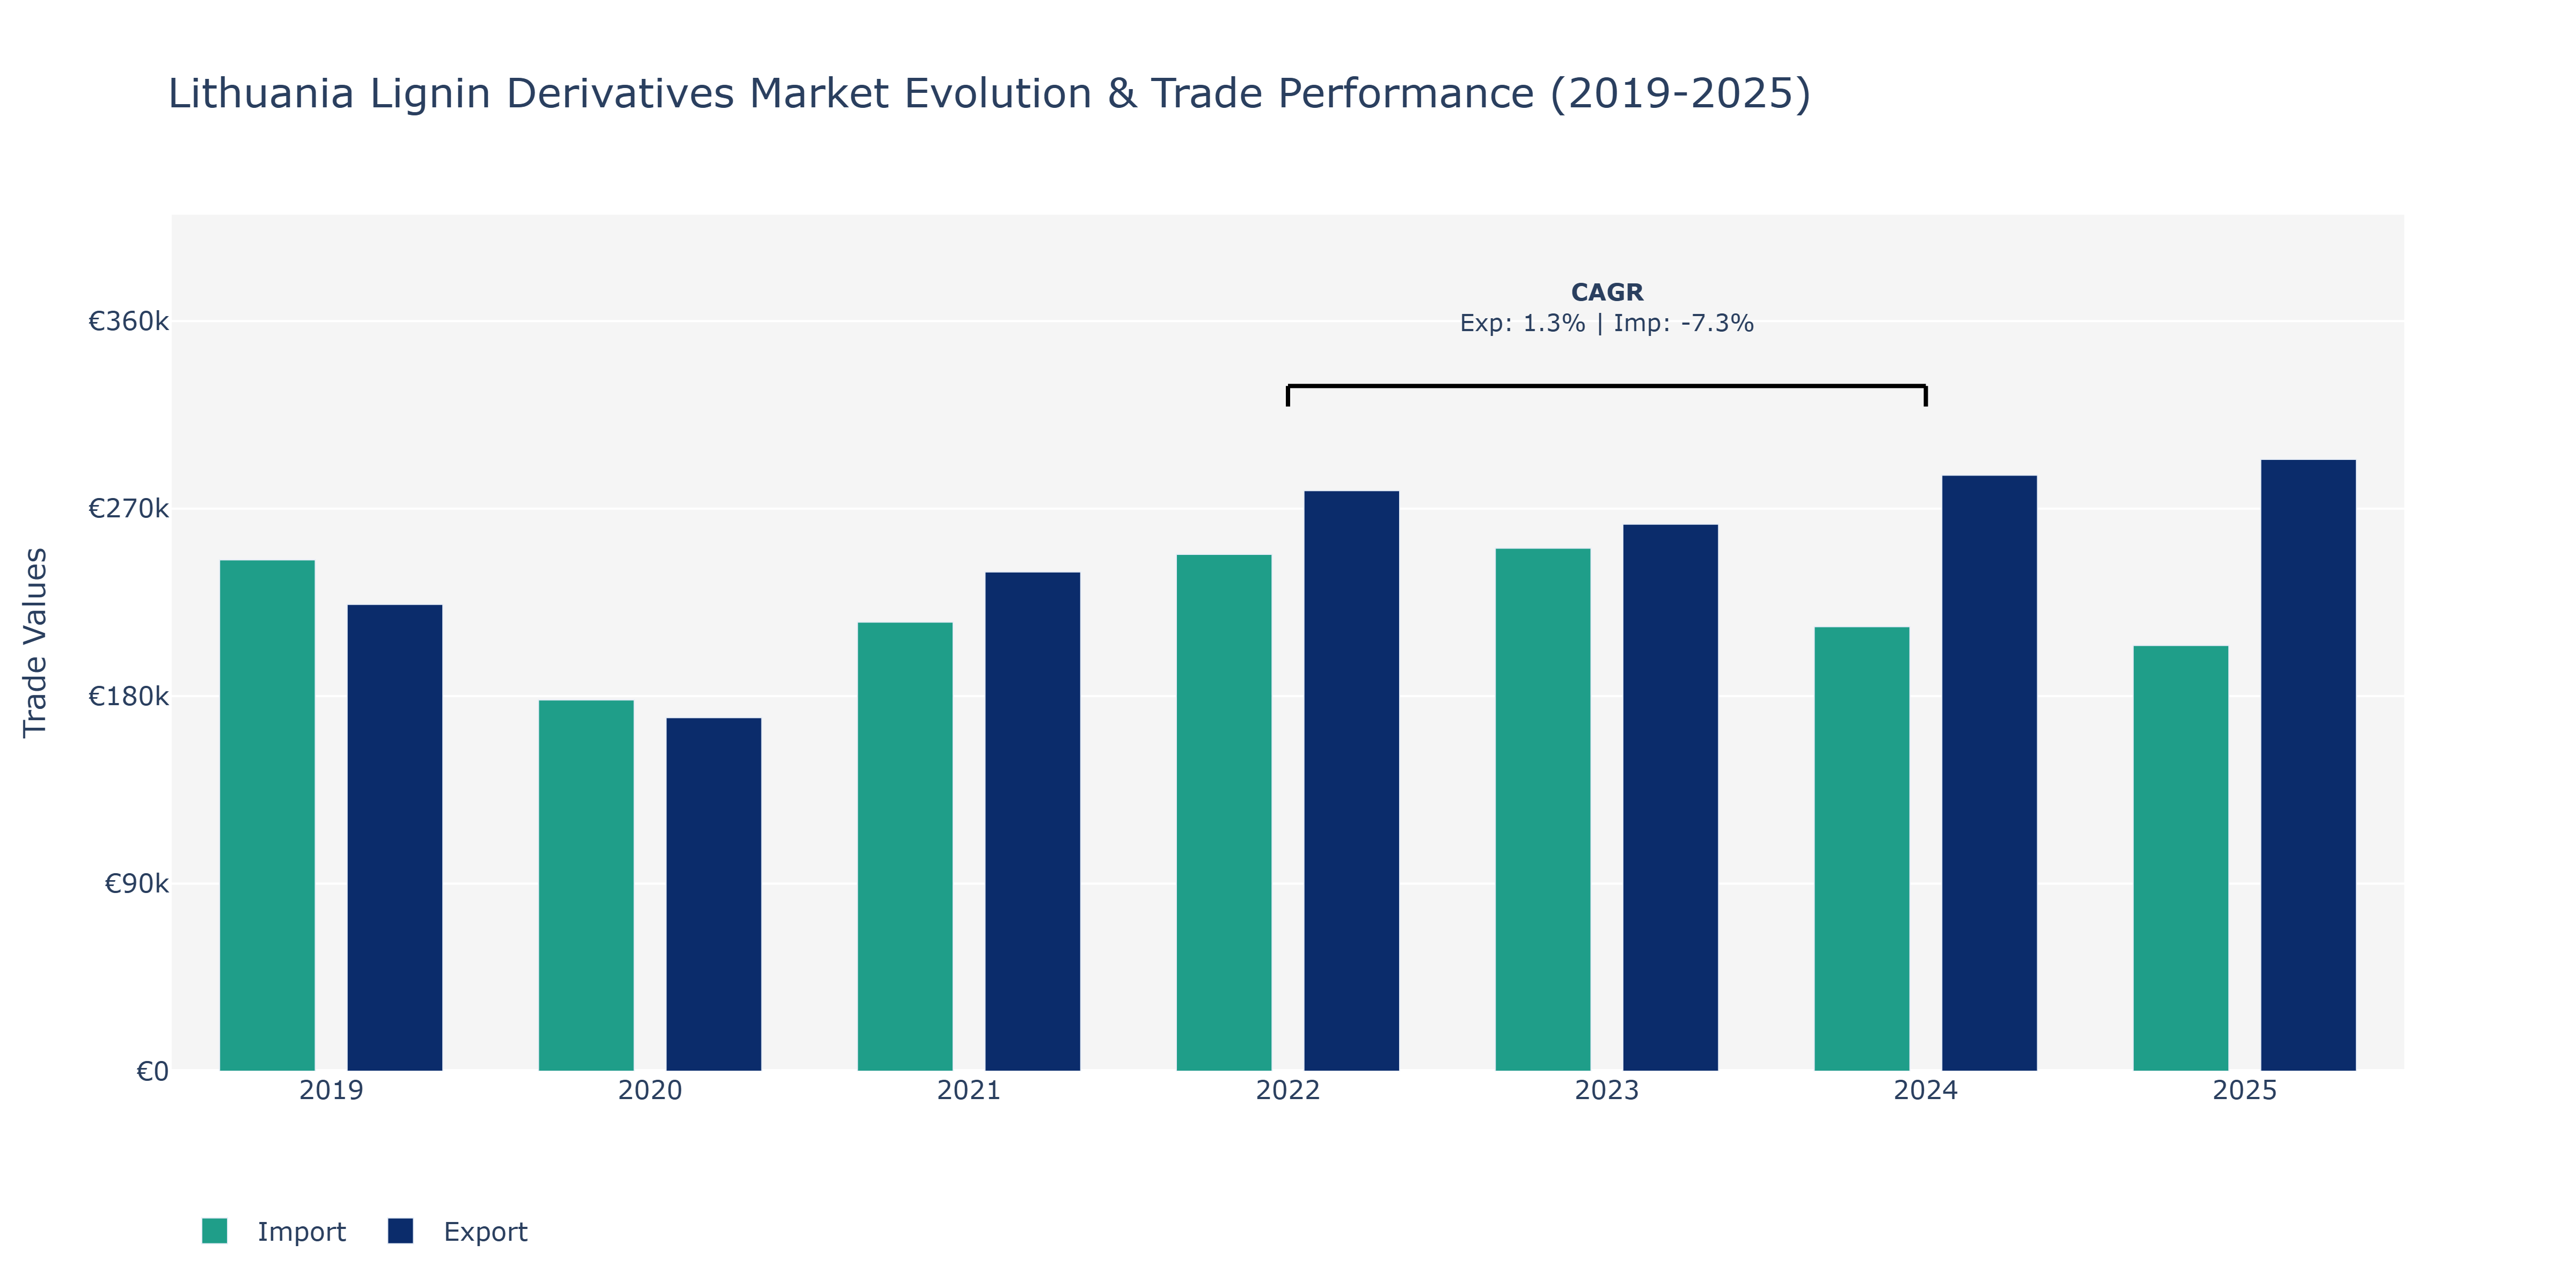
In the Lithuania Lignin Derivatives Market, between 2019 and 2025, Export values showed fluctuations, starting at €224.03 thousand in 2019, decreasing to €169.65 thousand in 2020, before reaching a peak of €293.61 thousand in 2025. Imports followed a similar trend, with values of €245.37 thousand in 2019, decreasing to €178.17 thousand in 2020, peaking at €248.00 thousand in 2022, and then slightly declining to €204.34 thousand in 2025. The market witnessed a notable decrease in imports in 2024, aligning with unstable global trade dynamics due to geopolitical tensions impacting the flow of goods. Conversely, the surge in exports in 2025 could be attributed to Lithuania's strategic initiatives to expand its market reach and capitalize on the increasing demand for lignin derivatives in sustainable industries like construction and agriculture. Such market movements highlight the market's resilience and adaptability to external factors, driving strategic decision-making among key industry players.
Key Highlights of the Report:
- Lithuania Lignin Derivatives Market Outlook
- Market Size of Lithuania Lignin Derivatives Market, 2025
- Forecast of Lithuania Lignin Derivatives Market, 2032
- Historical Data and Forecast of Lithuania Lignin Derivatives Revenues & Volume for the Period 2022 - 2032F
- Lithuania Lignin Derivatives Market Trend Evolution
- Lithuania Lignin Derivatives Market Drivers and Challenges
- Lithuania Lignin Derivatives Price Trends
- Lithuania Lignin Derivatives Porter's Five Forces
- Lithuania Lignin Derivatives Industry Life Cycle
- Historical Data and Forecast of Lithuania Lignin Derivatives Market Revenues & Volume By Technology Type for the Period 2022 - 2032F
- Historical Data and Forecast of Lithuania Lignin Derivatives Market Revenues & Volume By Sulfonation for the Period 2022 - 2032F
- Historical Data and Forecast of Lithuania Lignin Derivatives Market Revenues & Volume By Oxidation for the Period 2022 - 2032F
- Historical Data and Forecast of Lithuania Lignin Derivatives Market Revenues & Volume By Hydrogenation for the Period 2022 - 2032F
- Historical Data and Forecast of Lithuania Lignin Derivatives Market Revenues & Volume By Application for the Period 2022 - 2032F
- Historical Data and Forecast of Lithuania Lignin Derivatives Market Revenues & Volume By Concrete Additives for the Period 2022 - 2032F
- Historical Data and Forecast of Lithuania Lignin Derivatives Market Revenues & Volume By Animal Feed for the Period 2022 - 2032F
- Historical Data and Forecast of Lithuania Lignin Derivatives Market Revenues & Volume By Cosmetics for the Period 2022 - 2032F
- Historical Data and Forecast of Lithuania Lignin Derivatives Market Revenues & Volume By Dye Production for the Period 2022 - 2032F
- Historical Data and Forecast of Lithuania Lignin Derivatives Market Revenues & Volume By End User for the Period 2022 - 2032F
- Historical Data and Forecast of Lithuania Lignin Derivatives Market Revenues & Volume By Construction Companies for the Period 2022 - 2032F
- Historical Data and Forecast of Lithuania Lignin Derivatives Market Revenues & Volume By Livestock Farmers for the Period 2022 - 2032F
- Historical Data and Forecast of Lithuania Lignin Derivatives Market Revenues & Volume By Personal Care Manufacturers for the Period 2022 - 2032F
- Historical Data and Forecast of Lithuania Lignin Derivatives Market Revenues & Volume By Textile Industries for the Period 2022 - 2032F
- Historical Data and Forecast of Lithuania Lignin Derivatives Market Revenues & Volume By Product Type for the Period 2022 - 2032F
- Historical Data and Forecast of Lithuania Lignin Derivatives Market Revenues & Volume By Lignosulfonates for the Period 2022 - 2032F
- Historical Data and Forecast of Lithuania Lignin Derivatives Market Revenues & Volume By Vanillin for the Period 2022 - 2032F
- Historical Data and Forecast of Lithuania Lignin Derivatives Market Revenues & Volume By Phenolic Resins for the Period 2022 - 2032F
- Historical Data and Forecast of Lithuania Lignin Derivatives Market Revenues & Volume By Kraft Lignin for the Period 2022 - 2032F
- Lithuania Lignin Derivatives Import Export Trade Statistics
- Market Opportunity Assessment By Technology Type
- Market Opportunity Assessment By Application
- Market Opportunity Assessment By End User
- Market Opportunity Assessment By Product Type
- Lithuania Lignin Derivatives Top Companies Market Share
- Lithuania Lignin Derivatives Competitive Benchmarking By Technical and Operational Parameters
- Lithuania Lignin Derivatives Company Profiles
- Lithuania Lignin Derivatives Key Strategic Recommendations
Frequently Asked Questions About the Market Study (FAQs):
6Wresearch actively monitors the Lithuania Lignin Derivatives Market and publishes its comprehensive annual report, highlighting emerging trends, growth drivers, revenue analysis, and forecast outlook. Our insights help businesses to make data-backed strategic decisions with ongoing market dynamics. Our analysts track relevent industries related to the Lithuania Lignin Derivatives Market, allowing our clients with actionable intelligence and reliable forecasts tailored to emerging regional needs.
Yes, we provide customisation as per your requirements. To learn more, feel free to contact us on sales@6wresearch.com
1 Executive Summary |
2 Introduction |
2.1 Key Highlights of the Report |
2.2 Report Description |
2.3 Market Scope & Segmentation |
2.4 Research Methodology |
2.5 Assumptions |
3 Lithuania Lignin Derivatives Market Overview |
3.1 Lithuania Country Macro Economic Indicators |
3.2 Lithuania Lignin Derivatives Market Revenues & Volume, 2022 & 2032F |
3.3 Lithuania Lignin Derivatives Market - Industry Life Cycle |
3.4 Lithuania Lignin Derivatives Market - Porter's Five Forces |
3.5 Lithuania Lignin Derivatives Market Revenues & Volume Share, By Technology Type, 2022 & 2032F |
3.6 Lithuania Lignin Derivatives Market Revenues & Volume Share, By Application, 2022 & 2032F |
3.7 Lithuania Lignin Derivatives Market Revenues & Volume Share, By End User, 2022 & 2032F |
3.8 Lithuania Lignin Derivatives Market Revenues & Volume Share, By Product Type, 2022 & 2032F |
4 Lithuania Lignin Derivatives Market Dynamics |
4.1 Impact Analysis |
4.2 Market Drivers |
4.2.1 Increasing demand for eco-friendly products and sustainable solutions in various industries |
4.2.2 Growing research and development activities for new applications of lignin derivatives |
4.2.3 Favorable government regulations promoting the use of bio-based materials |
4.3 Market Restraints |
4.3.1 High production costs associated with the extraction and purification of lignin derivatives |
4.3.2 Limited awareness among end-users about the benefits of lignin derivatives compared to synthetic alternatives |
5 Lithuania Lignin Derivatives Market Trends |
6 Lithuania Lignin Derivatives Market, By Types |
6.1 Lithuania Lignin Derivatives Market, By Technology Type |
6.1.1 Overview and Analysis |
6.1.2 Lithuania Lignin Derivatives Market Revenues & Volume, By Technology Type, 2022 - 2032F |
6.1.3 Lithuania Lignin Derivatives Market Revenues & Volume, By Sulfonation, 2022 - 2032F |
6.1.4 Lithuania Lignin Derivatives Market Revenues & Volume, By Oxidation, 2022 - 2032F |
6.1.5 Lithuania Lignin Derivatives Market Revenues & Volume, By Hydrogenation, 2022 - 2032F |
6.2 Lithuania Lignin Derivatives Market, By Application |
6.2.1 Overview and Analysis |
6.2.2 Lithuania Lignin Derivatives Market Revenues & Volume, By Concrete Additives, 2022 - 2032F |
6.2.3 Lithuania Lignin Derivatives Market Revenues & Volume, By Animal Feed, 2022 - 2032F |
6.2.4 Lithuania Lignin Derivatives Market Revenues & Volume, By Cosmetics, 2022 - 2032F |
6.2.5 Lithuania Lignin Derivatives Market Revenues & Volume, By Dye Production, 2022 - 2032F |
6.3 Lithuania Lignin Derivatives Market, By End User |
6.3.1 Overview and Analysis |
6.3.2 Lithuania Lignin Derivatives Market Revenues & Volume, By Construction Companies, 2022 - 2032F |
6.3.3 Lithuania Lignin Derivatives Market Revenues & Volume, By Livestock Farmers, 2022 - 2032F |
6.3.4 Lithuania Lignin Derivatives Market Revenues & Volume, By Personal Care Manufacturers, 2022 - 2032F |
6.3.5 Lithuania Lignin Derivatives Market Revenues & Volume, By Textile Industries, 2022 - 2032F |
6.4 Lithuania Lignin Derivatives Market, By Product Type |
6.4.1 Overview and Analysis |
6.4.2 Lithuania Lignin Derivatives Market Revenues & Volume, By Lignosulfonates, 2022 - 2032F |
6.4.3 Lithuania Lignin Derivatives Market Revenues & Volume, By Vanillin, 2022 - 2032F |
6.4.4 Lithuania Lignin Derivatives Market Revenues & Volume, By Phenolic Resins, 2022 - 2032F |
6.4.5 Lithuania Lignin Derivatives Market Revenues & Volume, By Kraft Lignin, 2022 - 2032F |
7 Lithuania Lignin Derivatives Market Import-Export Trade Statistics |
7.1 Lithuania Lignin Derivatives Market Export to Major Countries |
7.2 Lithuania Lignin Derivatives Market Imports from Major Countries |
8 Lithuania Lignin Derivatives Market Key Performance Indicators |
8.1 Percentage increase in research funding for lignin derivative applications |
8.2 Number of patents filed for new lignin derivative products or processes |
8.3 Growth in the number of partnerships between lignin derivative manufacturers and end-user industries |
8.4 Improvement in the efficiency of lignin extraction and purification processes |
9 Lithuania Lignin Derivatives Market - Opportunity Assessment |
9.1 Lithuania Lignin Derivatives Market Opportunity Assessment, By Technology Type, 2022 & 2032F |
9.2 Lithuania Lignin Derivatives Market Opportunity Assessment, By Application, 2022 & 2032F |
9.3 Lithuania Lignin Derivatives Market Opportunity Assessment, By End User, 2022 & 2032F |
9.4 Lithuania Lignin Derivatives Market Opportunity Assessment, By Product Type, 2022 & 2032F |
10 Lithuania Lignin Derivatives Market - Competitive Landscape |
10.1 Lithuania Lignin Derivatives Market Revenue Share, By Companies, 2025 |
10.2 Lithuania Lignin Derivatives Market Competitive Benchmarking, By Operating and Technical Parameters |
11 Company Profiles |
12 Recommendations |
13 Disclaimer |
Export potential assessment - trade Analytics for 2030
Export potential enables firms to identify high-growth global markets with greater confidence by combining advanced trade intelligence with a structured quantitative methodology. The framework analyzes emerging demand trends and country-level import patterns while integrating macroeconomic and trade datasets such as GDP and population forecasts, bilateral import–export flows, tariff structures, elasticity differentials between developed and developing economies, geographic distance, and import demand projections. Using weighted trade values from 2020–2024 as the base period to project country-to-country export potential for 2030, these inputs are operationalized through calculated drivers such as gravity model parameters, tariff impact factors, and projected GDP per-capita growth. Through an analysis of hidden potentials, demand hotspots, and market conditions that are most favorable to success, this method enables firms to focus on target countries, maximize returns, and global expansion with data, backed by accuracy.
By factoring in the projected importer demand gap that is currently unmet and could be potential opportunity, it identifies the potential for the Exporter (Country) among 190 countries, against the general trade analysis, which identifies the biggest importer or exporter.
To discover high-growth global markets and optimize your business strategy:
Click Here
Pricing
- Single User License$ 1,995
- Department License$ 2,400
- Site License$ 3,120
- Global License$ 3,795

Search
Thought Leadership and Analyst Meet


Our Clients
Latest Reports
- France Thermally Conductive Filler Dispersants Market (2026-2032) | Challenges, Restraints, Value, Share, Size, segmentation, Analysis, Trends, Investment Opportunities, Outlook, Pricing, Demand, Forecast, Revenue, Companies, Growth, Drivers, Strategy, Insights, Competition
- Egypt Thermally Conductive Filler Dispersants Market (2026-2032) | Competition, Forecast, Strategy, Value, Insights, Outlook, Investment Opportunities, Pricing, Demand, Share, segmentation, Drivers, Size, Companies, Restraints, Growth, Trends, Revenue, Challenges, Analysis
- Czech Republic Thermally Conductive Filler Dispersants Market (2026-2032) | Forecast, Pricing, Analysis, Drivers, Insights, Size, Demand, Growth, Challenges, segmentation, Competition, Outlook, Trends, Investment Opportunities, Companies, Strategy, Revenue, Share, Value, Restraints
- Colombia Thermally Conductive Filler Dispersants Market (2026-2032) | segmentation, Trends, Share, Drivers, Strategy, Companies, Demand, Insights, Size, Challenges, Value, Competition, Analysis, Growth, Revenue, Restraints, Forecast, Pricing, Outlook, Investment Opportunities
- China Thermally Conductive Filler Dispersants Market (2026-2032) | Restraints, Investment Opportunities, Pricing, Companies, Share, Size, Challenges, Trends, Outlook, Value, Analysis, Competition, Revenue, Drivers, Forecast, Demand, Insights, Growth, Strategy, segmentation
- Chile Thermally Conductive Filler Dispersants Market (2026-2032) | Investment Opportunities, Trends, Value, Restraints, Share, Companies, Forecast, segmentation, Pricing, Challenges, Demand, Size, Analysis, Drivers, Outlook, Growth, Competition, Strategy, Revenue, Insights
- Cambodia Thermally Conductive Filler Dispersants Market (2026-2032) | Analysis, Share, Outlook, Strategy, Pricing, Demand, Size, Growth, segmentation, Insights, Revenue, Forecast, Challenges, Competition, Companies, Investment Opportunities, Trends, Restraints, Value, Drivers
- Brazil Thermally Conductive Filler Dispersants Market (2026-2032) | Restraints, Forecast, Competition, Size, Revenue, Value, Investment Opportunities, Trends, Insights, Outlook, Growth, Analysis, Drivers, segmentation, Pricing, Challenges, Strategy, Share, Companies, Demand
- Bangladesh Thermally Conductive Filler Dispersants Market (2026-2032) | Restraints, Trends, Analysis, Competition, Insights, Forecast, Value, Investment Opportunities, Pricing, Share, Demand, Outlook, Revenue, segmentation, Companies, Drivers, Growth, Size, Challenges, Strategy
- Bahrain Thermally Conductive Filler Dispersants Market (2026-2032) | Trends, Outlook, Pricing, Demand, Value, Competition, Forecast, Growth, segmentation, Revenue, Companies, Analysis, Insights, Size, Drivers, Challenges, Strategy, Investment Opportunities, Share, Restraints
Industry Events and Analyst Meet

HIMTEX 2026

India Refining Summit 2026

India EV Show 2026

EV tech India Expo 2026

Auto Tech Asia 2026
Whitepaper
- Middle East & Africa Commercial Security Market Click here to view more.
- Middle East & Africa Fire Safety Systems & Equipment Market Click here to view more.
- GCC Drone Market Click here to view more.
- Middle East Lighting Fixture Market Click here to view more.
- GCC Physical & Perimeter Security Market Click here to view more.
6WResearch In News
- Doha a strategic location for EV manufacturing hub: IPA Qatar
- Demand for luxury TVs surging in the GCC, says Samsung
- Empowering Growth: The Thriving Journey of Bangladesh’s Cable Industry
- Demand for luxury TVs surging in the GCC, says Samsung
- Video call with a traditional healer? Once unthinkable, it’s now common in South Africa
- Intelligent Buildings To Smooth GCC’s Path To Net Zero