Lithuania Meal Replacement Drinks Market (2026-2032) | Share, Segmentation, Investment Trends, Consumer Insights, Competition, Value, Supply, Size, Demand, Growth, Challenges, Analysis, Pricing Analysis, Segments, Trends, Opportunities, Industry, Competitive, Strategic Insights, Revenue, Forecast, Outlook, Strategy, Drivers, Restraints, Companies
Market Forecast By Product Type (Protein-based, Carbohydrate-based, Fat-based, Fiber-based), By Distribution Channel (Supermarkets, Online Retailers, Specialty Stores, Pharmacies), By Consumer Demographics (Athletes, Busy Professionals, Elderly, Weight Management Seekers), By Packaging Type (Bottles, Cans, Tetra Packs, Sachets) And Competitive Landscape
| Product Code: ETC12654330 | Publication Date: Apr 2025 | Updated Date: Apr 2026 | Product Type: Market Research Report | |
| Publisher: 6Wresearch | Author: Sachin Kumar Rai | No. of Pages: 65 | No. of Figures: 34 | No. of Tables: 19 |
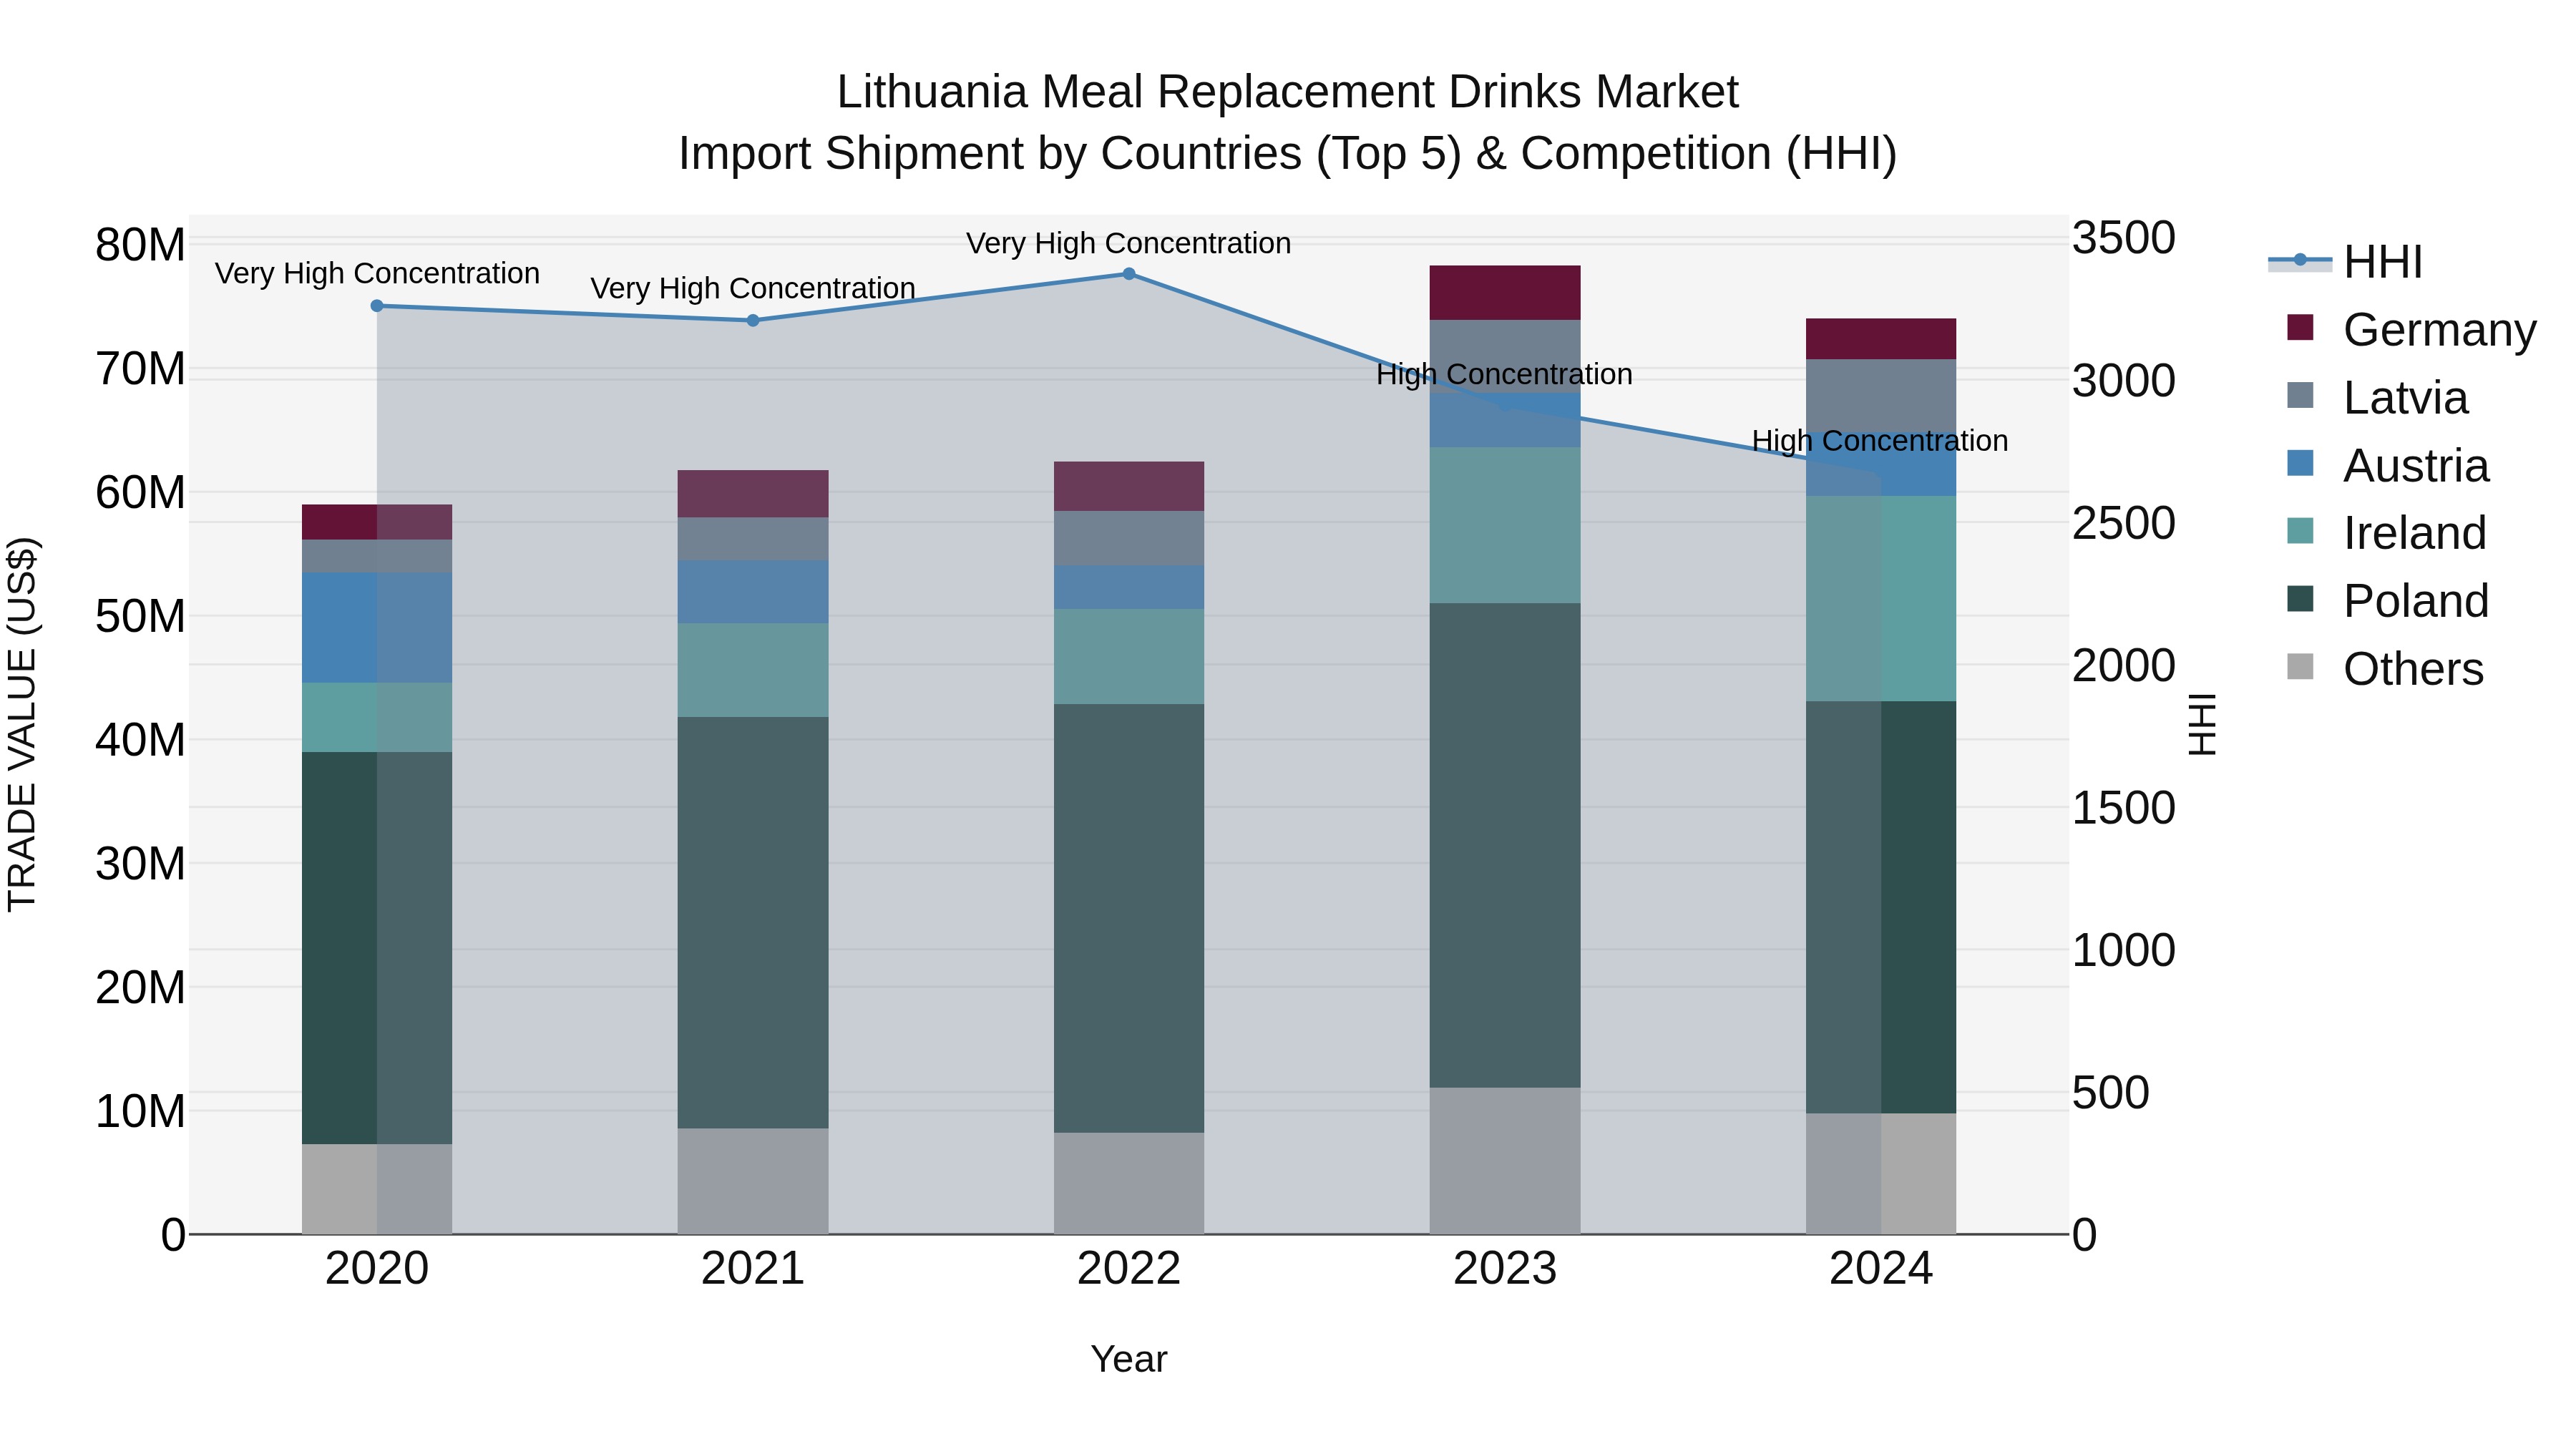
Lithuania Meal Replacement Drinks Market Top 5 Importing Countries and Market Competition (HHI) Analysis
Despite a slight dip in growth rate from 2023 to 2024, Lithuania continues to see a steady increase in the import of meal replacement drinks. The top exporting countries to Lithuania in 2024 include Poland, Ireland, Latvia, Austria, and Germany, showcasing a diverse range of suppliers. The high concentration of the Herfindahl-Hirschman Index (HHI) indicates a competitive market with dominant players. With a healthy compound annual growth rate (CAGR) of 5.83% from 2020 to 2024, the market for meal replacement drinks in Lithuania appears to be on a promising trajectory.
Key Highlights of the Report:
- Lithuania Meal Replacement Drinks Market Outlook
- Market Size of Lithuania Meal Replacement Drinks Market, 2025
- Forecast of Lithuania Meal Replacement Drinks Market, 2032
- Historical Data and Forecast of Lithuania Meal Replacement Drinks Revenues & Volume for the Period 2022 - 2032F
- Lithuania Meal Replacement Drinks Market Trend Evolution
- Lithuania Meal Replacement Drinks Market Drivers and Challenges
- Lithuania Meal Replacement Drinks Price Trends
- Lithuania Meal Replacement Drinks Porter's Five Forces
- Lithuania Meal Replacement Drinks Industry Life Cycle
- Historical Data and Forecast of Lithuania Meal Replacement Drinks Market Revenues & Volume By Product Type for the Period 2022 - 2032F
- Historical Data and Forecast of Lithuania Meal Replacement Drinks Market Revenues & Volume By Protein-based for the Period 2022 - 2032F
- Historical Data and Forecast of Lithuania Meal Replacement Drinks Market Revenues & Volume By Carbohydrate-based for the Period 2022 - 2032F
- Historical Data and Forecast of Lithuania Meal Replacement Drinks Market Revenues & Volume By Fat-based for the Period 2022 - 2032F
- Historical Data and Forecast of Lithuania Meal Replacement Drinks Market Revenues & Volume By Fiber-based for the Period 2022 - 2032F
- Historical Data and Forecast of Lithuania Meal Replacement Drinks Market Revenues & Volume By Distribution Channel for the Period 2022 - 2032F
- Historical Data and Forecast of Lithuania Meal Replacement Drinks Market Revenues & Volume By Supermarkets for the Period 2022 - 2032F
- Historical Data and Forecast of Lithuania Meal Replacement Drinks Market Revenues & Volume By Online Retailers for the Period 2022 - 2032F
- Historical Data and Forecast of Lithuania Meal Replacement Drinks Market Revenues & Volume By Specialty Stores for the Period 2022 - 2032F
- Historical Data and Forecast of Lithuania Meal Replacement Drinks Market Revenues & Volume By Pharmacies for the Period 2022 - 2032F
- Historical Data and Forecast of Lithuania Meal Replacement Drinks Market Revenues & Volume By Consumer Demographics for the Period 2022 - 2032F
- Historical Data and Forecast of Lithuania Meal Replacement Drinks Market Revenues & Volume By Athletes for the Period 2022 - 2032F
- Historical Data and Forecast of Lithuania Meal Replacement Drinks Market Revenues & Volume By Busy Professionals for the Period 2022 - 2032F
- Historical Data and Forecast of Lithuania Meal Replacement Drinks Market Revenues & Volume By Elderly for the Period 2022 - 2032F
- Historical Data and Forecast of Lithuania Meal Replacement Drinks Market Revenues & Volume By Weight Management Seekers for the Period 2022 - 2032F
- Historical Data and Forecast of Lithuania Meal Replacement Drinks Market Revenues & Volume By Packaging Type for the Period 2022 - 2032F
- Historical Data and Forecast of Lithuania Meal Replacement Drinks Market Revenues & Volume By Bottles for the Period 2022 - 2032F
- Historical Data and Forecast of Lithuania Meal Replacement Drinks Market Revenues & Volume By Cans for the Period 2022 - 2032F
- Historical Data and Forecast of Lithuania Meal Replacement Drinks Market Revenues & Volume By Tetra Packs for the Period 2022 - 2032F
- Historical Data and Forecast of Lithuania Meal Replacement Drinks Market Revenues & Volume By Sachets for the Period 2022 - 2032F
- Lithuania Meal Replacement Drinks Import Export Trade Statistics
- Market Opportunity Assessment By Product Type
- Market Opportunity Assessment By Distribution Channel
- Market Opportunity Assessment By Consumer Demographics
- Market Opportunity Assessment By Packaging Type
- Lithuania Meal Replacement Drinks Top Companies Market Share
- Lithuania Meal Replacement Drinks Competitive Benchmarking By Technical and Operational Parameters
- Lithuania Meal Replacement Drinks Company Profiles
- Lithuania Meal Replacement Drinks Key Strategic Recommendations
Frequently Asked Questions About the Market Study (FAQs):
6Wresearch actively monitors the Lithuania Meal Replacement Drinks Market and publishes its comprehensive annual report, highlighting emerging trends, growth drivers, revenue analysis, and forecast outlook. Our insights help businesses to make data-backed strategic decisions with ongoing market dynamics. Our analysts track relevent industries related to the Lithuania Meal Replacement Drinks Market, allowing our clients with actionable intelligence and reliable forecasts tailored to emerging regional needs.
Yes, we provide customisation as per your requirements. To learn more, feel free to contact us on sales@6wresearch.com
1 Executive Summary |
2 Introduction |
2.1 Key Highlights of the Report |
2.2 Report Description |
2.3 Market Scope & Segmentation |
2.4 Research Methodology |
2.5 Assumptions |
3 Lithuania Meal Replacement Drinks Market Overview |
3.1 Lithuania Country Macro Economic Indicators |
3.2 Lithuania Meal Replacement Drinks Market Revenues & Volume, 2022 & 2032F |
3.3 Lithuania Meal Replacement Drinks Market - Industry Life Cycle |
3.4 Lithuania Meal Replacement Drinks Market - Porter's Five Forces |
3.5 Lithuania Meal Replacement Drinks Market Revenues & Volume Share, By Product Type, 2022 & 2032F |
3.6 Lithuania Meal Replacement Drinks Market Revenues & Volume Share, By Distribution Channel, 2022 & 2032F |
3.7 Lithuania Meal Replacement Drinks Market Revenues & Volume Share, By Consumer Demographics, 2022 & 2032F |
3.8 Lithuania Meal Replacement Drinks Market Revenues & Volume Share, By Packaging Type, 2022 & 2032F |
4 Lithuania Meal Replacement Drinks Market Dynamics |
4.1 Impact Analysis |
4.2 Market Drivers |
4.2.1 Increasing health consciousness and focus on weight management among the Lithuanian population. |
4.2.2 Busy lifestyles leading to a demand for convenient and on-the-go meal options. |
4.2.3 Rising disposable income levels driving the willingness to spend on health and wellness products. |
4.3 Market Restraints |
4.3.1 Limited awareness and understanding of meal replacement drinks among consumers. |
4.3.2 Perception of meal replacement drinks as artificial or processed, deterring some consumers. |
4.3.3 Competition from traditional food and beverage options in the market. |
5 Lithuania Meal Replacement Drinks Market Trends |
6 Lithuania Meal Replacement Drinks Market, By Types |
6.1 Lithuania Meal Replacement Drinks Market, By Product Type |
6.1.1 Overview and Analysis |
6.1.2 Lithuania Meal Replacement Drinks Market Revenues & Volume, By Product Type, 2022 - 2032F |
6.1.3 Lithuania Meal Replacement Drinks Market Revenues & Volume, By Protein-based, 2022 - 2032F |
6.1.4 Lithuania Meal Replacement Drinks Market Revenues & Volume, By Carbohydrate-based, 2022 - 2032F |
6.1.5 Lithuania Meal Replacement Drinks Market Revenues & Volume, By Fat-based, 2022 - 2032F |
6.1.6 Lithuania Meal Replacement Drinks Market Revenues & Volume, By Fiber-based, 2022 - 2032F |
6.2 Lithuania Meal Replacement Drinks Market, By Distribution Channel |
6.2.1 Overview and Analysis |
6.2.2 Lithuania Meal Replacement Drinks Market Revenues & Volume, By Supermarkets, 2022 - 2032F |
6.2.3 Lithuania Meal Replacement Drinks Market Revenues & Volume, By Online Retailers, 2022 - 2032F |
6.2.4 Lithuania Meal Replacement Drinks Market Revenues & Volume, By Specialty Stores, 2022 - 2032F |
6.2.5 Lithuania Meal Replacement Drinks Market Revenues & Volume, By Pharmacies, 2022 - 2032F |
6.3 Lithuania Meal Replacement Drinks Market, By Consumer Demographics |
6.3.1 Overview and Analysis |
6.3.2 Lithuania Meal Replacement Drinks Market Revenues & Volume, By Athletes, 2022 - 2032F |
6.3.3 Lithuania Meal Replacement Drinks Market Revenues & Volume, By Busy Professionals, 2022 - 2032F |
6.3.4 Lithuania Meal Replacement Drinks Market Revenues & Volume, By Elderly, 2022 - 2032F |
6.3.5 Lithuania Meal Replacement Drinks Market Revenues & Volume, By Weight Management Seekers, 2022 - 2032F |
6.4 Lithuania Meal Replacement Drinks Market, By Packaging Type |
6.4.1 Overview and Analysis |
6.4.2 Lithuania Meal Replacement Drinks Market Revenues & Volume, By Bottles, 2022 - 2032F |
6.4.3 Lithuania Meal Replacement Drinks Market Revenues & Volume, By Cans, 2022 - 2032F |
6.4.4 Lithuania Meal Replacement Drinks Market Revenues & Volume, By Tetra Packs, 2022 - 2032F |
6.4.5 Lithuania Meal Replacement Drinks Market Revenues & Volume, By Sachets, 2022 - 2032F |
7 Lithuania Meal Replacement Drinks Market Import-Export Trade Statistics |
7.1 Lithuania Meal Replacement Drinks Market Export to Major Countries |
7.2 Lithuania Meal Replacement Drinks Market Imports from Major Countries |
8 Lithuania Meal Replacement Drinks Market Key Performance Indicators |
8.1 Number of new product launches and innovations in the meal replacement drinks market in Lithuania. |
8.2 Growth in the number of health and wellness stores and online platforms offering meal replacement drinks. |
8.3 Consumer surveys and feedback on taste, nutritional value, and convenience of meal replacement drinks. |
9 Lithuania Meal Replacement Drinks Market - Opportunity Assessment |
9.1 Lithuania Meal Replacement Drinks Market Opportunity Assessment, By Product Type, 2022 & 2032F |
9.2 Lithuania Meal Replacement Drinks Market Opportunity Assessment, By Distribution Channel, 2022 & 2032F |
9.3 Lithuania Meal Replacement Drinks Market Opportunity Assessment, By Consumer Demographics, 2022 & 2032F |
9.4 Lithuania Meal Replacement Drinks Market Opportunity Assessment, By Packaging Type, 2022 & 2032F |
10 Lithuania Meal Replacement Drinks Market - Competitive Landscape |
10.1 Lithuania Meal Replacement Drinks Market Revenue Share, By Companies, 2025 |
10.2 Lithuania Meal Replacement Drinks Market Competitive Benchmarking, By Operating and Technical Parameters |
11 Company Profiles |
12 Recommendations |
13 Disclaimer |
Global Go To Market Strategy - 2030
Export potential enables firms to identify high-growth global markets with greater confidence by combining advanced trade intelligence with a structured quantitative methodology. The framework analyzes emerging demand trends and country-level import patterns while integrating macroeconomic and trade datasets such as GDP and population forecasts, bilateral import–export flows, tariff structures, elasticity differentials between developed and developing economies, geographic distance, and import demand projections. Using weighted trade values from 2020–2024 as the base period to project country-to-country export potential for 2030, these inputs are operationalized through calculated drivers such as gravity model parameters, tariff impact factors, and projected GDP per-capita growth. Through an analysis of hidden potentials, demand hotspots, and market conditions that are most favorable to success, this method enables firms to focus on target countries, maximize returns, and global expansion with data, backed by accuracy.
By factoring in the projected importer demand gap that is currently unmet and could be potential opportunity, it identifies the potential for the Exporter (Country) among 190 countries, against the general trade analysis, which identifies the biggest importer or exporter.
To discover high-growth global markets and optimize your business strategy:
Click Here
Pricing
- Single User License$ 1,995
- Department License$ 2,400
- Site License$ 3,120
- Global License$ 3,795

Leadership Perspectives from Industry Events
Search
Thought Leadership and Analyst Meet


Our Clients
6WResearch In News
- Doha a strategic location for EV manufacturing hub: IPA Qatar
- Demand for luxury TVs surging in the GCC, says Samsung
- Empowering Growth: The Thriving Journey of Bangladesh’s Cable Industry
- Demand for luxury TVs surging in the GCC, says Samsung
- Video call with a traditional healer? Once unthinkable, it’s now common in South Africa
- Intelligent Buildings To Smooth GCC’s Path To Net Zero
Latest Reports
- Argentina Pediatric Antibiotics Market (2026-2032)
- Algeria Pediatric Antibiotics Market (2026-2032)
- Ivory Coast Passenger Oxygen Mask System Market (2026-2032)
- Ivory Coast Pain Relief Drugs Market (2026-2032)
- Ivory Coast Outdoor Grill Market (2026-2032)
- Ivory Coast Organic Vegetable Market (2026-2032)
- Ivory Coast Optometry Automation Tools Market (2026-2032)
- Ivory Coast Oncology Treatment Market (2026-2032)
- Ivory Coast Animal Surgical Aftercare Market (2026-2032)
- Ivory Coast ANA Panel Market (2026-2032)
Industry Events and Analyst Meet

HIMTEX 2026

India Refining Summit 2026

India EV Show 2026

EV tech India Expo 2026

Auto Tech Asia 2026
Whitepaper
- Middle East & Africa Commercial Security Market Click here to view more.
- Middle East & Africa Fire Safety Systems & Equipment Market Click here to view more.
- GCC Drone Market Click here to view more.
- Middle East Lighting Fixture Market Click here to view more.
- GCC Physical & Perimeter Security Market Click here to view more.