Lithuania Mini Powder Puff Market (2026-2032) | Growth, Forecast, Companies, Outlook, Value, Industry, Size, Share, Analysis, Revenue, Trends & Segmentation
Market Forecast By Product Type (Wet Puff, Dry Puff), By Applications (Daliy Use, Performing Use) And Competitive Landscape
| Product Code: ETC5100742 | Publication Date: Nov 2023 | Updated Date: Apr 2026 | Product Type: Market Research Report | |
| Publisher: 6Wresearch | Author: Shubham Padhi | No. of Pages: 60 | No. of Figures: 30 | No. of Tables: 5 |
Lithuania Mini Powder Puff Market Size (2020-2030)
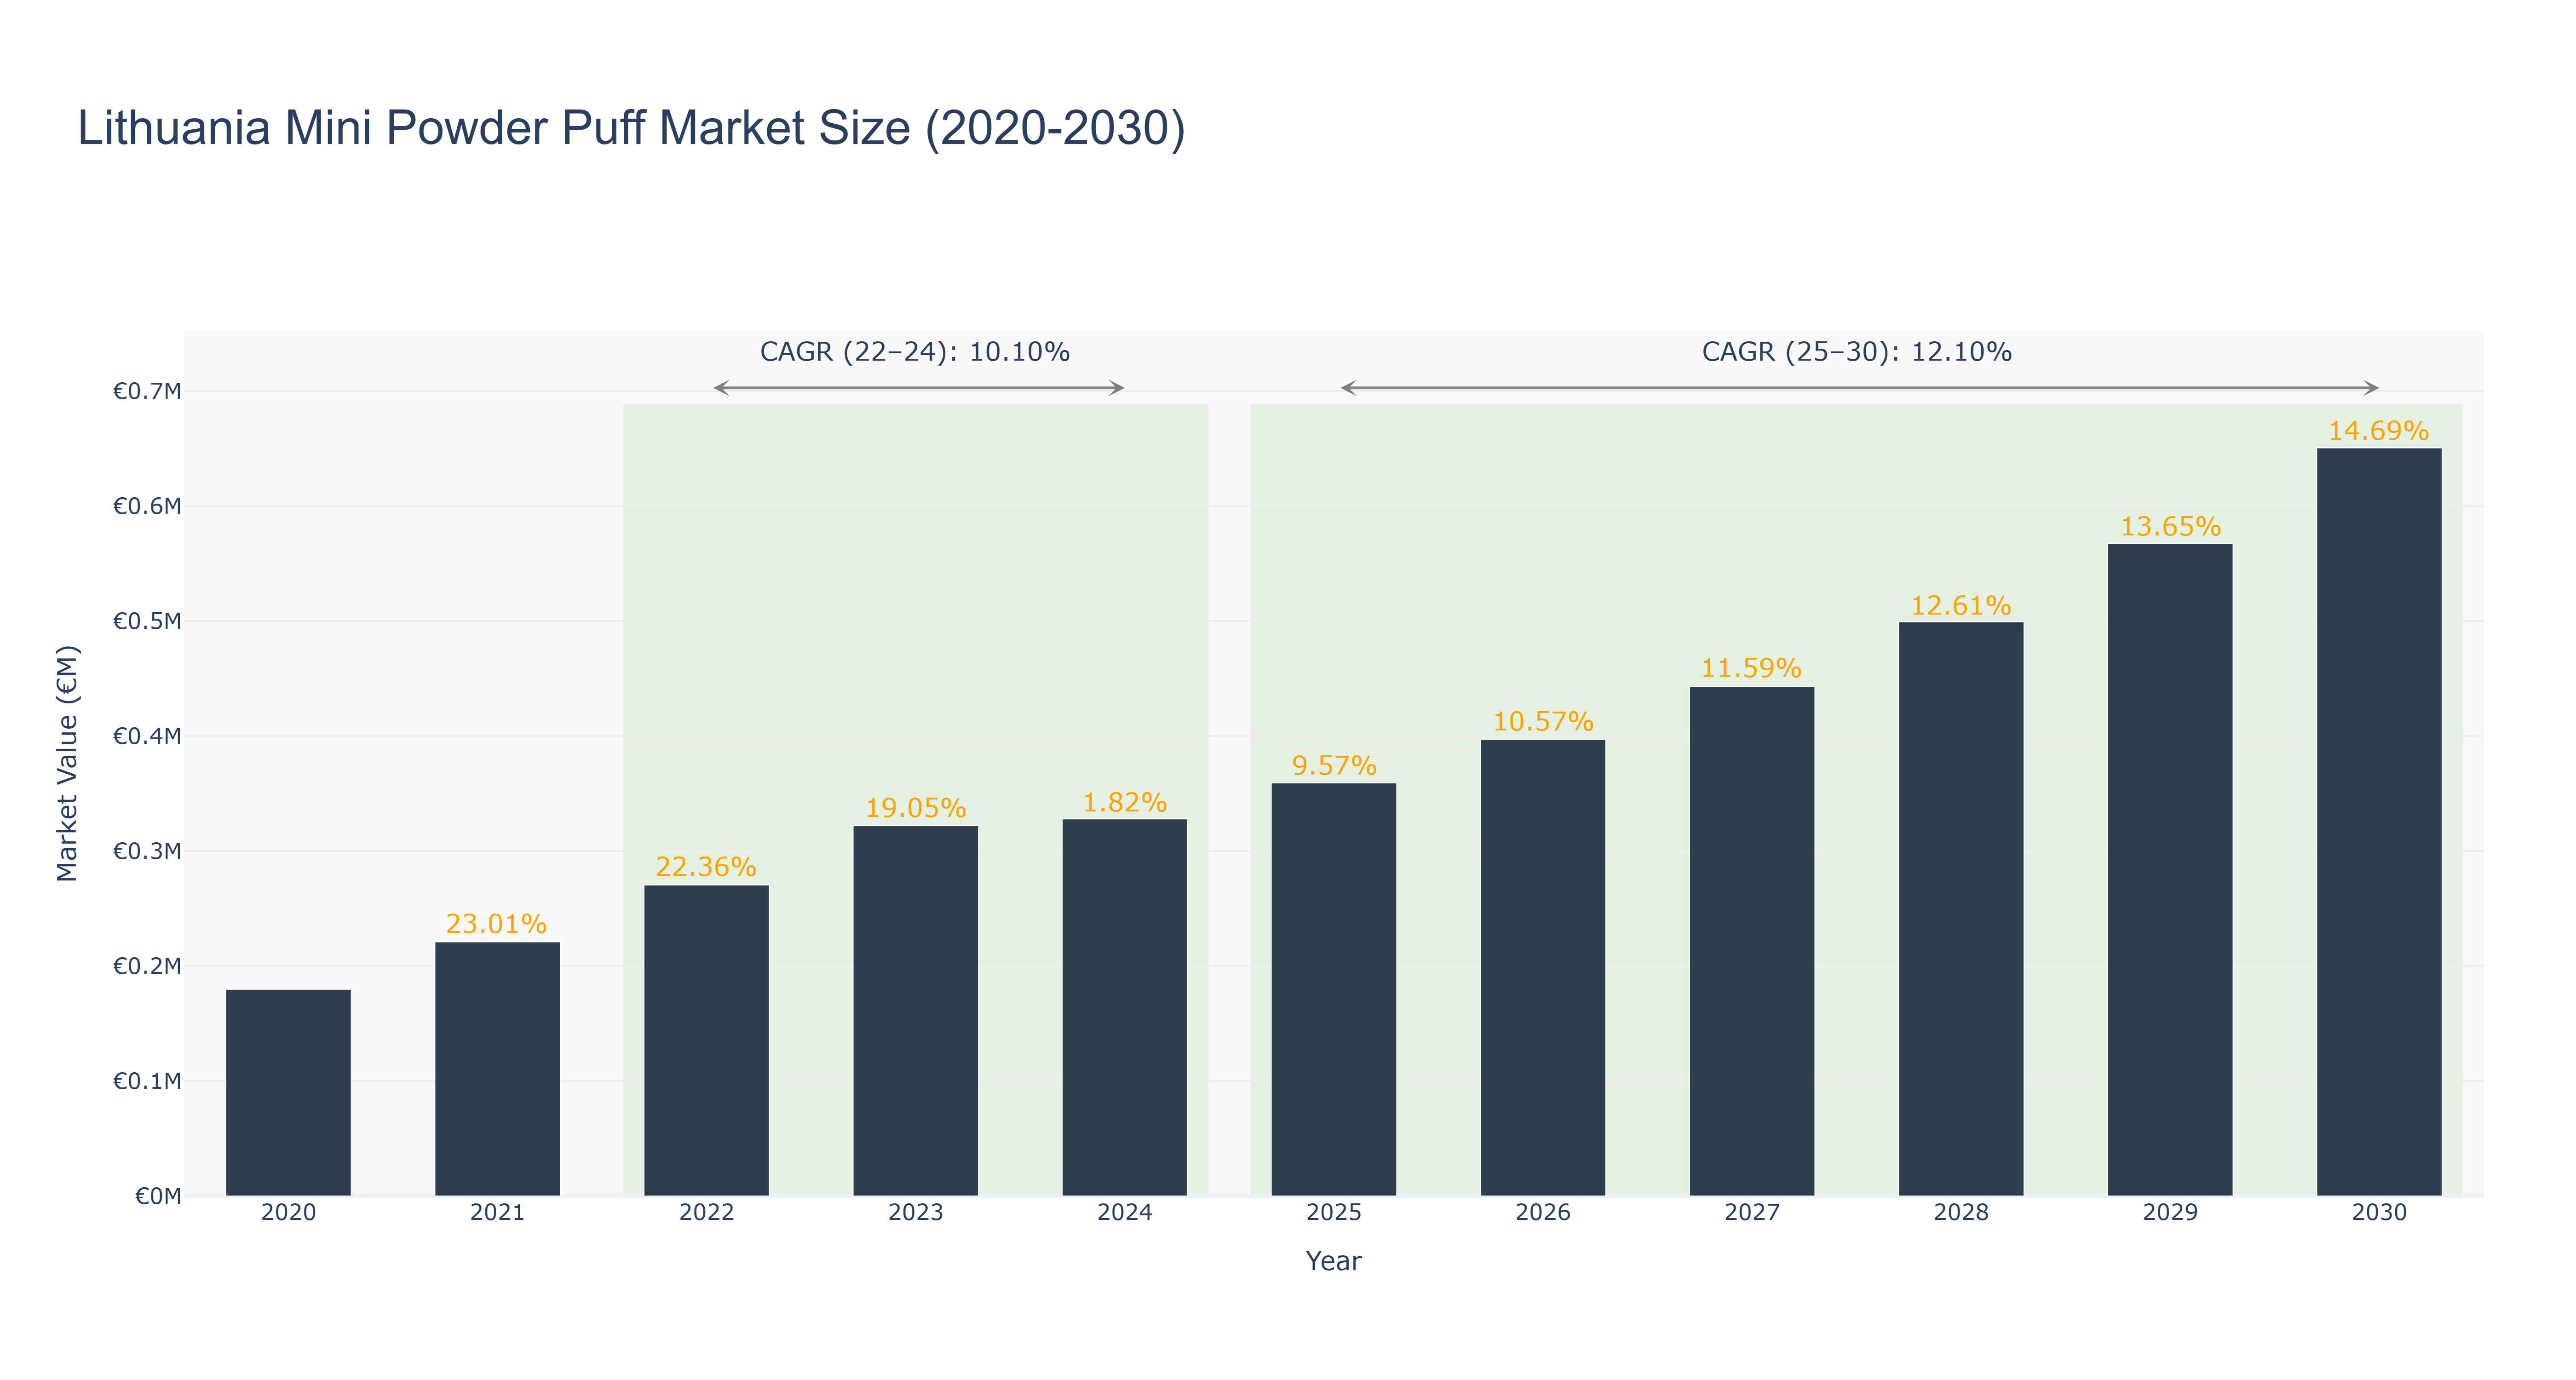
The Lithuania Mini Powder Puff Market experienced steady growth from 2020 to 2024, reaching a peak size of €0.33 million in 2024. The market is forecasted to continue expanding, with a projected size of €0.65 million in 2030. The CAGR for the period 2022-24 was 10.10%, while the CAGR for 2025-30 is expected to be 12.10%. The market's growth can be attributed to increasing consumer demand for beauty products in Lithuania, coupled with innovative marketing strategies by key players. Looking ahead, the market is set to witness further growth driven by upcoming collaborations between local beauty brands and international influencers, aiming to capitalize on the growing trend of sustainable and eco-friendly beauty products in the region.
Lithuania Mini Powder Puff Market: Production & Trade Performance (2019-2025)
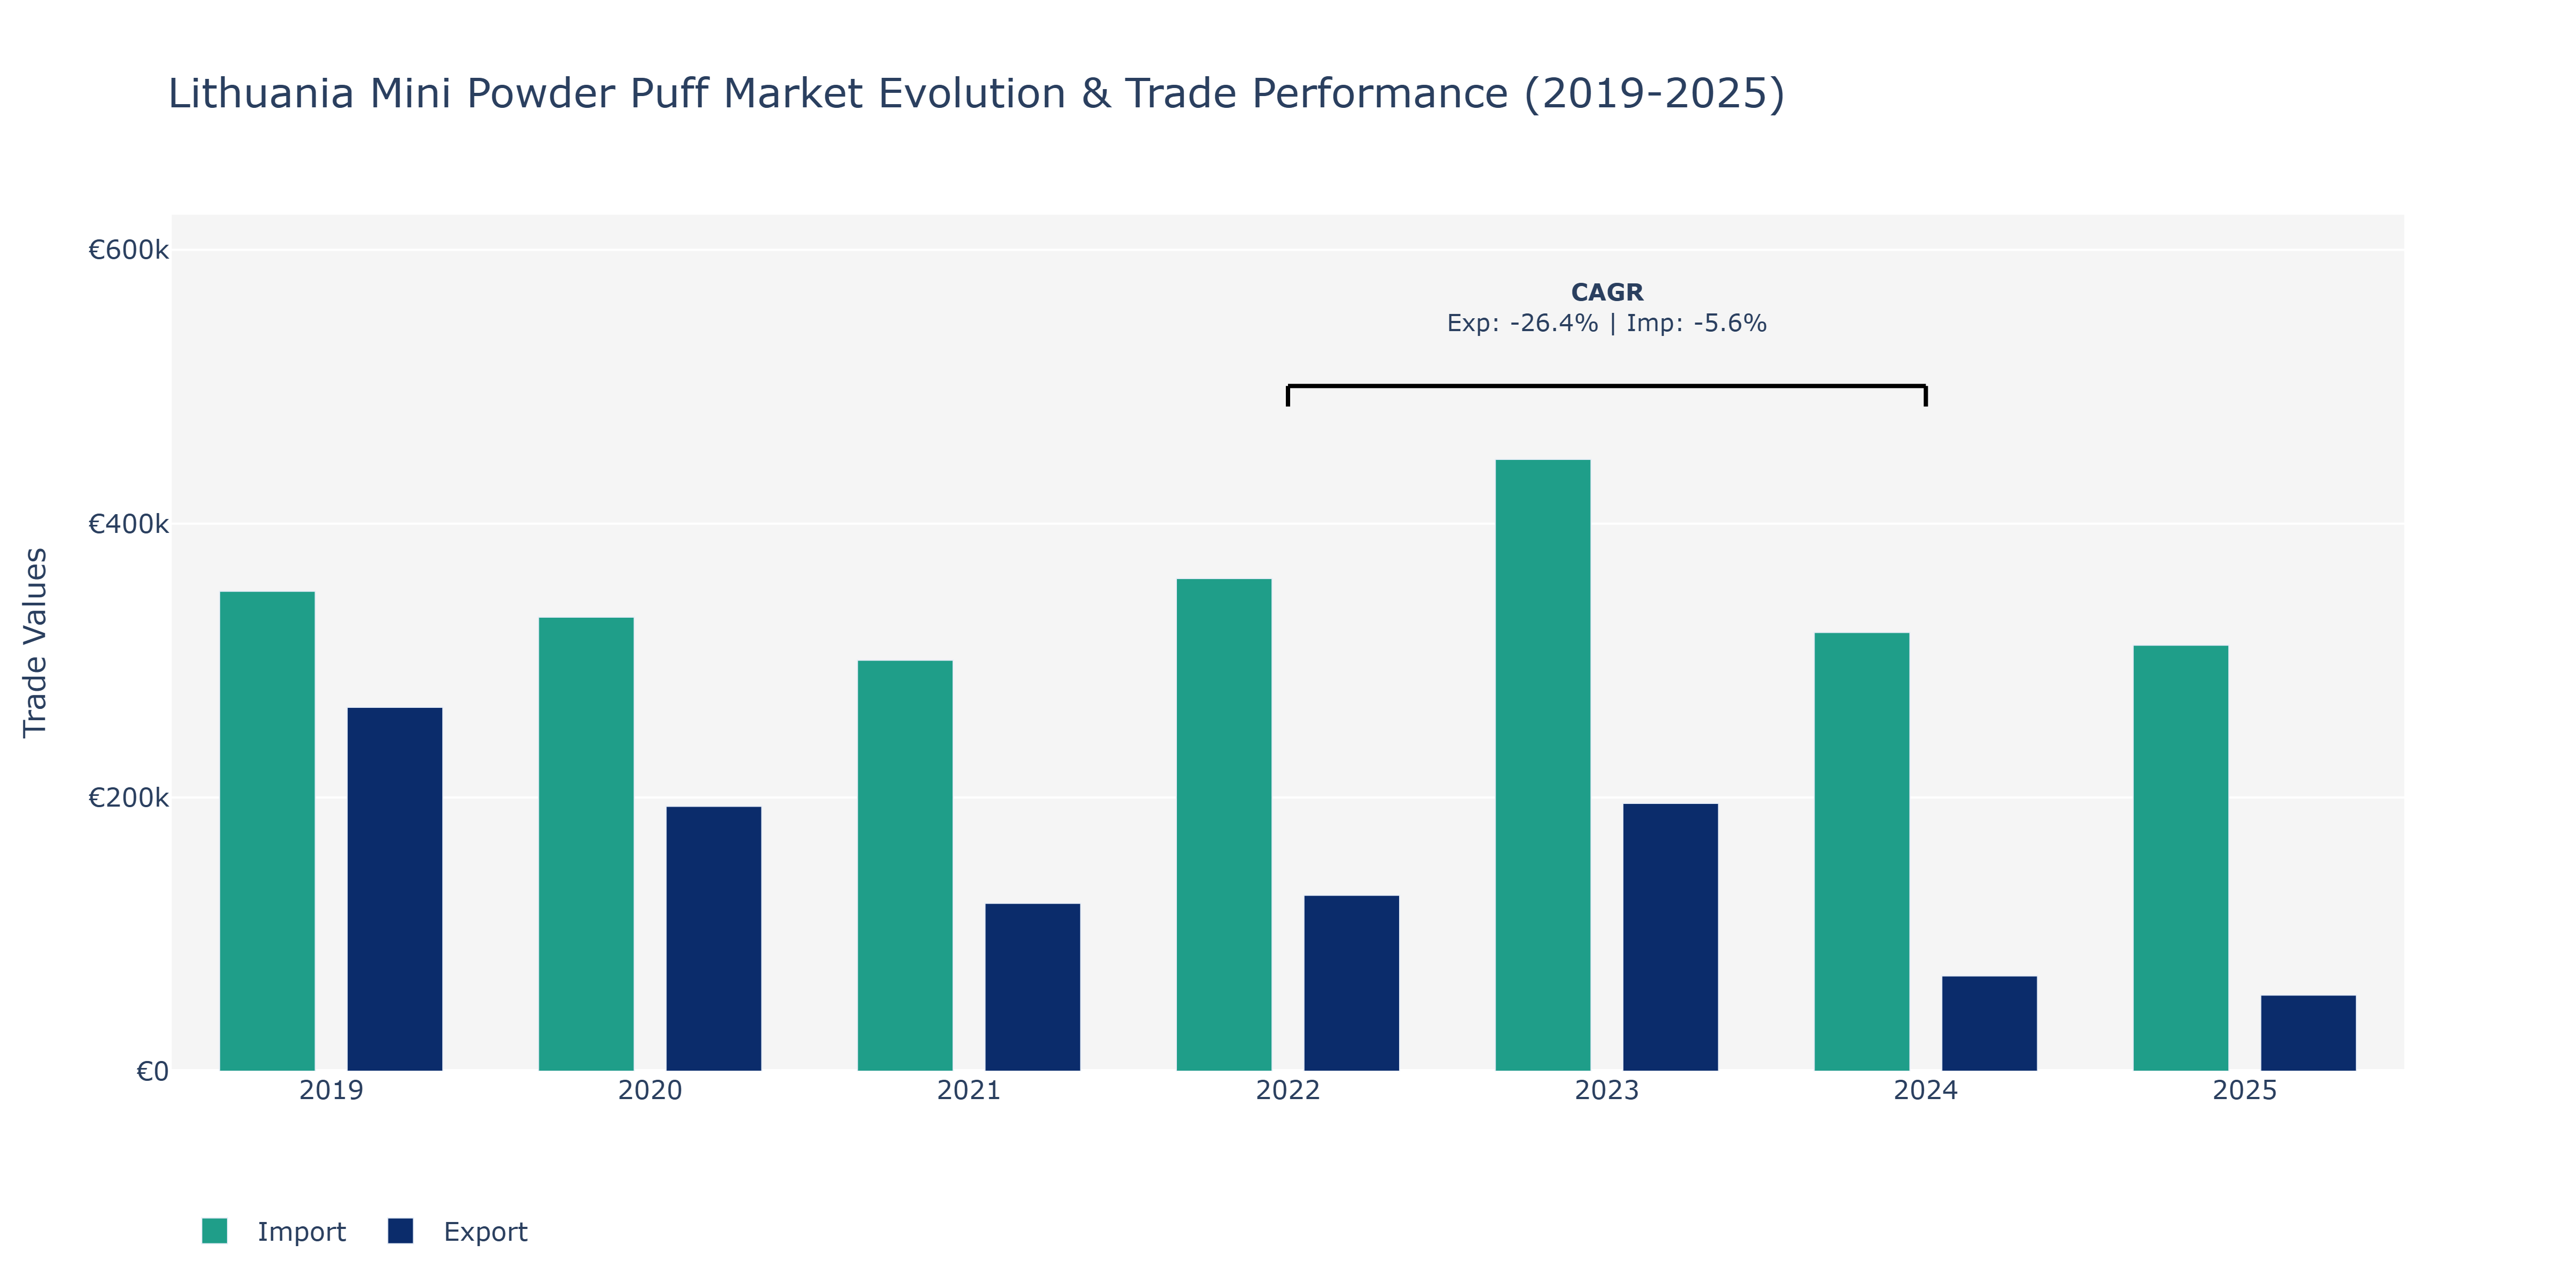
In the Lithuania Mini Powder Puff Market, exports experienced a notable fluctuation over the years. Starting at €265.85 thousand in 2019, exports decreased sharply to €69.57 thousand in 2024 before slightly rebounding to €55.6 thousand in 2025. This decline can be attributed to shifts in consumer preferences, possibly influenced by changes in fashion trends or the emergence of new cosmetic products. On the other hand, imports showed a more stable trend, with a peak of €446.94 thousand in 2023 and a low of €300.19 thousand in 2021. This fluctuation could be linked to global economic conditions impacting the demand for beauty products in Lithuania and supply chain disruptions affecting import volumes. The rebound in exports in 2025 may indicate a renewed interest in Lithuania's mini powder puff products, potentially driven by effective marketing strategies or product innovation aimed at regaining market share.
Key Highlights of the Report:
- Lithuania Mini Powder Puff Market Outlook
- Market Size of Lithuania Mini Powder Puff Market, 2025
- Forecast of Lithuania Mini Powder Puff Market, 2032
- Historical Data and Forecast of Lithuania Mini Powder Puff Revenues & Volume for the Period 2022 - 2032F
- Lithuania Mini Powder Puff Market Trend Evolution
- Lithuania Mini Powder Puff Market Drivers and Challenges
- Lithuania Mini Powder Puff Price Trends
- Lithuania Mini Powder Puff Porter`s Five Forces
- Lithuania Mini Powder Puff Industry Life Cycle
- Historical Data and Forecast of Lithuania Mini Powder Puff Market Revenues & Volume By Product Type for the Period 2022 - 2032F
- Historical Data and Forecast of Lithuania Mini Powder Puff Market Revenues & Volume By Wet Puff for the Period 2022 - 2032F
- Historical Data and Forecast of Lithuania Mini Powder Puff Market Revenues & Volume By Dry Puff for the Period 2022 - 2032F
- Historical Data and Forecast of Lithuania Mini Powder Puff Market Revenues & Volume By Applications for the Period 2022 - 2032F
- Historical Data and Forecast of Lithuania Mini Powder Puff Market Revenues & Volume By Daliy Use for the Period 2022 - 2032F
- Historical Data and Forecast of Lithuania Mini Powder Puff Market Revenues & Volume By Performing Use for the Period 2022 - 2032F
- Lithuania Mini Powder Puff Import Export Trade Statistics
- Market Opportunity Assessment By Product Type
- Market Opportunity Assessment By Applications
- Lithuania Mini Powder Puff Top Companies Market Share
- Lithuania Mini Powder Puff Competitive Benchmarking By Technical and Operational Parameters
- Lithuania Mini Powder Puff Company Profiles
- Lithuania Mini Powder Puff Key Strategic Recommendations
Frequently Asked Questions About the Market Study (FAQs):
6Wresearch actively monitors the Lithuania Mini Powder Puff Market and publishes its comprehensive annual report, highlighting emerging trends, growth drivers, revenue analysis, and forecast outlook. Our insights help businesses to make data-backed strategic decisions with ongoing market dynamics. Our analysts track relevent industries related to the Lithuania Mini Powder Puff Market, allowing our clients with actionable intelligence and reliable forecasts tailored to emerging regional needs.
Yes, we provide customisation as per your requirements. To learn more, feel free to contact us on sales@6wresearch.com
1 Executive Summary |
2 Introduction |
2.1 Key Highlights of the Report |
2.2 Report Description |
2.3 Market Scope & Segmentation |
2.4 Research Methodology |
2.5 Assumptions |
3 Lithuania Mini Powder Puff Market Overview |
3.1 Lithuania Country Macro Economic Indicators |
3.2 Lithuania Mini Powder Puff Market Revenues & Volume, 2022 & 2032F |
3.3 Lithuania Mini Powder Puff Market - Industry Life Cycle |
3.4 Lithuania Mini Powder Puff Market - Porter's Five Forces |
3.5 Lithuania Mini Powder Puff Market Revenues & Volume Share, By Product Type, 2022 & 2032F |
3.6 Lithuania Mini Powder Puff Market Revenues & Volume Share, By Applications, 2022 & 2032F |
4 Lithuania Mini Powder Puff Market Dynamics |
4.1 Impact Analysis |
4.2 Market Drivers |
4.2.1 Increasing beauty and cosmetics industry in Lithuania |
4.2.2 Growing trend of makeup application and beauty routines |
4.2.3 Rising demand for convenient and portable beauty products |
4.3 Market Restraints |
4.3.1 Intense competition from established beauty brands |
4.3.2 Price sensitivity of consumers towards beauty products |
4.3.3 Limited awareness and marketing of mini powder puffs in the market |
5 Lithuania Mini Powder Puff Market Trends |
6 Lithuania Mini Powder Puff Market Segmentations |
6.1 Lithuania Mini Powder Puff Market, By Product Type |
6.1.1 Overview and Analysis |
6.1.2 Lithuania Mini Powder Puff Market Revenues & Volume, By Wet Puff, 2022 - 2032F |
6.1.3 Lithuania Mini Powder Puff Market Revenues & Volume, By Dry Puff, 2022 - 2032F |
6.2 Lithuania Mini Powder Puff Market, By Applications |
6.2.1 Overview and Analysis |
6.2.2 Lithuania Mini Powder Puff Market Revenues & Volume, By Daliy Use, 2022 - 2032F |
6.2.3 Lithuania Mini Powder Puff Market Revenues & Volume, By Performing Use, 2022 - 2032F |
7 Lithuania Mini Powder Puff Market Import-Export Trade Statistics |
7.1 Lithuania Mini Powder Puff Market Export to Major Countries |
7.2 Lithuania Mini Powder Puff Market Imports from Major Countries |
8 Lithuania Mini Powder Puff Market Key Performance Indicators |
8.1 Social media engagement and reach for mini powder puff promotions |
8.2 Number of beauty influencers endorsing mini powder puffs |
8.3 Customer satisfaction and feedback on the quality and usability of mini powder puffs. |
9 Lithuania Mini Powder Puff Market - Opportunity Assessment |
9.1 Lithuania Mini Powder Puff Market Opportunity Assessment, By Product Type, 2022 & 2032F |
9.2 Lithuania Mini Powder Puff Market Opportunity Assessment, By Applications, 2022 & 2032F |
10 Lithuania Mini Powder Puff Market - Competitive Landscape |
10.1 Lithuania Mini Powder Puff Market Revenue Share, By Companies, 2025 |
10.2 Lithuania Mini Powder Puff Market Competitive Benchmarking, By Operating and Technical Parameters |
11 Company Profiles |
12 Recommendations | 13 Disclaimer |
Export potential assessment - trade Analytics for 2030
Export potential enables firms to identify high-growth global markets with greater confidence by combining advanced trade intelligence with a structured quantitative methodology. The framework analyzes emerging demand trends and country-level import patterns while integrating macroeconomic and trade datasets such as GDP and population forecasts, bilateral import–export flows, tariff structures, elasticity differentials between developed and developing economies, geographic distance, and import demand projections. Using weighted trade values from 2020–2024 as the base period to project country-to-country export potential for 2030, these inputs are operationalized through calculated drivers such as gravity model parameters, tariff impact factors, and projected GDP per-capita growth. Through an analysis of hidden potentials, demand hotspots, and market conditions that are most favorable to success, this method enables firms to focus on target countries, maximize returns, and global expansion with data, backed by accuracy.
By factoring in the projected importer demand gap that is currently unmet and could be potential opportunity, it identifies the potential for the Exporter (Country) among 190 countries, against the general trade analysis, which identifies the biggest importer or exporter.
To discover high-growth global markets and optimize your business strategy:
Click Here
Pricing
- Single User License$ 1,995
- Department License$ 2,400
- Site License$ 3,120
- Global License$ 3,795

Search
Thought Leadership and Analyst Meet


Our Clients
Latest Reports
- India Ultrasonic Smart Water Meter Market (2026-2032) | Outlook, Competition, Drivers, Trends, Demand, Competitive, Strategic Insights, Companies, Challenges, Strategy, Consumer Insights, Analysis, Opportunities, Growth, Size, Share, Industry, Revenue, Segments, Value, Segmentation, Supply, Forecast, Restraints,
- India Electromagnetic Bulk Flow Meter Market (2026-2032) | Analysis, Challenges, Strategic Insights, Supply, Forecast, Growth, Share, Consumer Insights, Competitive, Value, Outlook, Size & Demand,
- India Battery Powered Bulk Flow Meter Market (2026-2032) | Outlook, Analysis, Competitive Landscape, Growth, Size, Trends, Value, Revenue, Companies, Segmentation, Share & Forecast
- Bosnia and Herzegovina Fuel-Efficient Winglets Market (2026-2032) | Growth, Competition, Strategy, Restraints, Trends, Challenges, segmentation, Value, Outlook, Investment Opportunities, Analysis, Revenue, Companies, Insights, Pricing, Size, Drivers, Demand, Share, Forecast
- Canada Cloud CFD Market (2026-2032) | Size & Revenue, Industry, Growth, Competitive Landscape, Forecast, Segmentation, Value, Outlook, Trends, Share, Analysis, Companies
- Taiwan Food Delivery Platform Market (2026-2032) | Companies, Outlook, Analysis, Trends, Value, Revenue, Segmentation, Share, Forecast, Competitive Landscape, Growth, Size & Forecast
- United Kingdom (UK) Long-term Care Insurance Market (2026-2032) | Growth, Share, Consumer Insights, Drivers, Opportunities, Competition, Pricing Analysis, Segments, Restraints, Companies, Competitive, Value, Outlook, Size, Demand, Analysis, Challenges, Strategic Insights, Investment Trends, Revenue, Trends, Supply, Forecast
- United Kingdom (UK) Long Term Care Market (2026-2032) | Companies, Outlook, Analysis, Trends, Value, Revenue, Segmentation, Share, Forecast, Competitive Landscape, Growth, Size & Forecast
- Iraq Insulation and Waterproofing Market (2026-2032) | Outlook, Drivers, Growth, Size, Share, Industry, Revenue, Trends, Demand, Competitive, Strategic Insights, Opportunities, Segments, Companies, Challenges, Strategy, Consumer Insights, Analysis, Investment Trends, Value, Segmentation, Forecast, Restraints
- India Switchgear Market Outlook (2026-2032) | Size, Share, Trends, Growth, Revenue, Forecast, Analysis, Value, Outlook
Industry Events and Analyst Meet

HIMTEX 2026

India Refining Summit 2026

India EV Show 2026

EV tech India Expo 2026

Auto Tech Asia 2026
Whitepaper
- Middle East & Africa Commercial Security Market Click here to view more.
- Middle East & Africa Fire Safety Systems & Equipment Market Click here to view more.
- GCC Drone Market Click here to view more.
- Middle East Lighting Fixture Market Click here to view more.
- GCC Physical & Perimeter Security Market Click here to view more.
6WResearch In News
- Doha a strategic location for EV manufacturing hub: IPA Qatar
- Demand for luxury TVs surging in the GCC, says Samsung
- Empowering Growth: The Thriving Journey of Bangladesh’s Cable Industry
- Demand for luxury TVs surging in the GCC, says Samsung
- Video call with a traditional healer? Once unthinkable, it’s now common in South Africa
- Intelligent Buildings To Smooth GCC’s Path To Net Zero