Lithuania Mixed Flow Pump Market (2026-2032) | Forecast, Analysis, Companies, Outlook, Share, Growth, Value, Industry, Trends, Competitive Landscape, Segmentation, Size & Revenue
Market Forecast By Configuration (Single-stage, Multi-stage), By End-use (Agriculture, Construction & Building Services, Water & Wastewater, Power Generation, Oil & Gas, Chemical) And Competitive Landscape
| Product Code: ETC8045551 | Publication Date: Sep 2024 | Updated Date: Apr 2026 | Product Type: Market Research Report | |
| Publisher: 6Wresearch | Author: Dhaval Chaurasia | No. of Pages: 75 | No. of Figures: 35 | No. of Tables: 20 |
Lithuania Mixed Flow Pump Market Size (2020-2030)
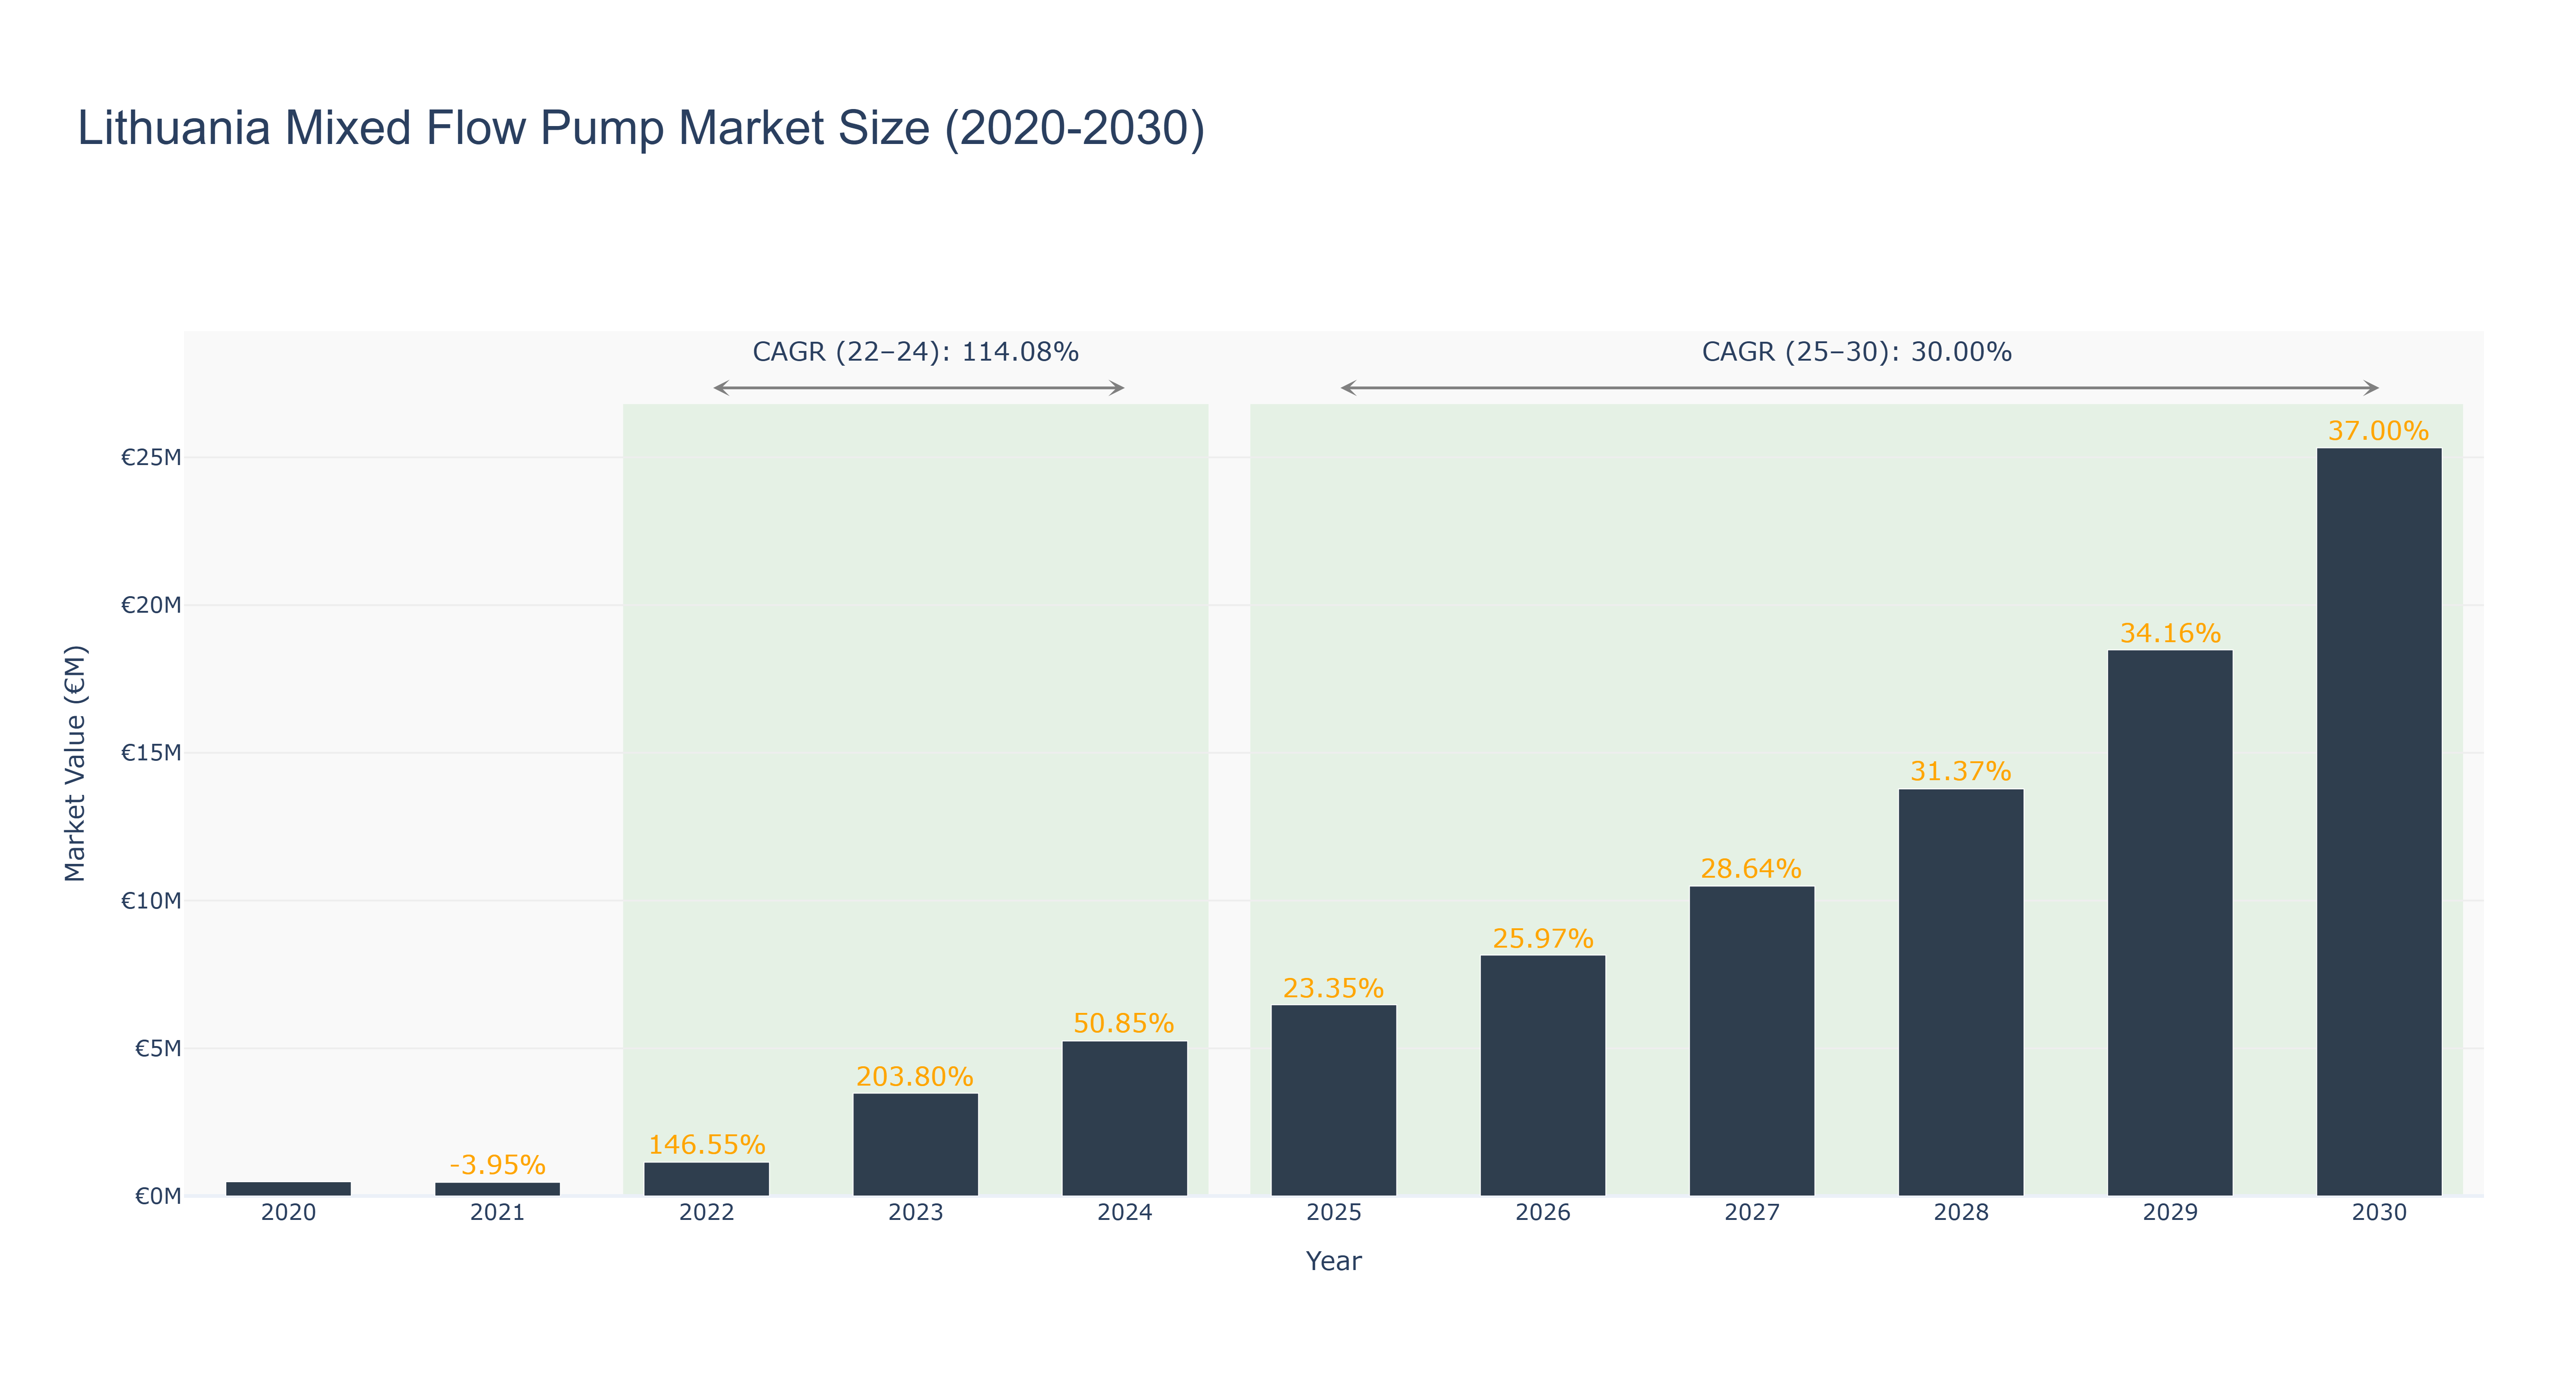
The Lithuania Mixed Flow Pump Market has exhibited significant fluctuations in recent years, with a peak market size of €5.25 million recorded in 2024, following substantial growth from €1.14 million in 2022. The actual CAGR for the period 2022-2024 is an impressive 114.08%, driven by increased industrial activity and infrastructure investments. However, the market saw a decline to €464.36 thousand in 2021, reflecting challenges in demand amidst economic uncertainties. Looking ahead, the forecasted period from 2025 to 2030 projects a robust market growth with a CAGR of 30.00%, reaching €25.32 million by 2030. This growth trajectory is underpinned by ongoing urbanization, advancements in pump technology, and the anticipated rise in renewable energy projects. As Lithuania continues to modernize its infrastructure, the mixed flow pump market is poised for sustained expansion, presenting opportunities for manufacturers and investors alike.
Lithuania Mixed Flow Pump Market: Production & Trade Performance (2019-2025)
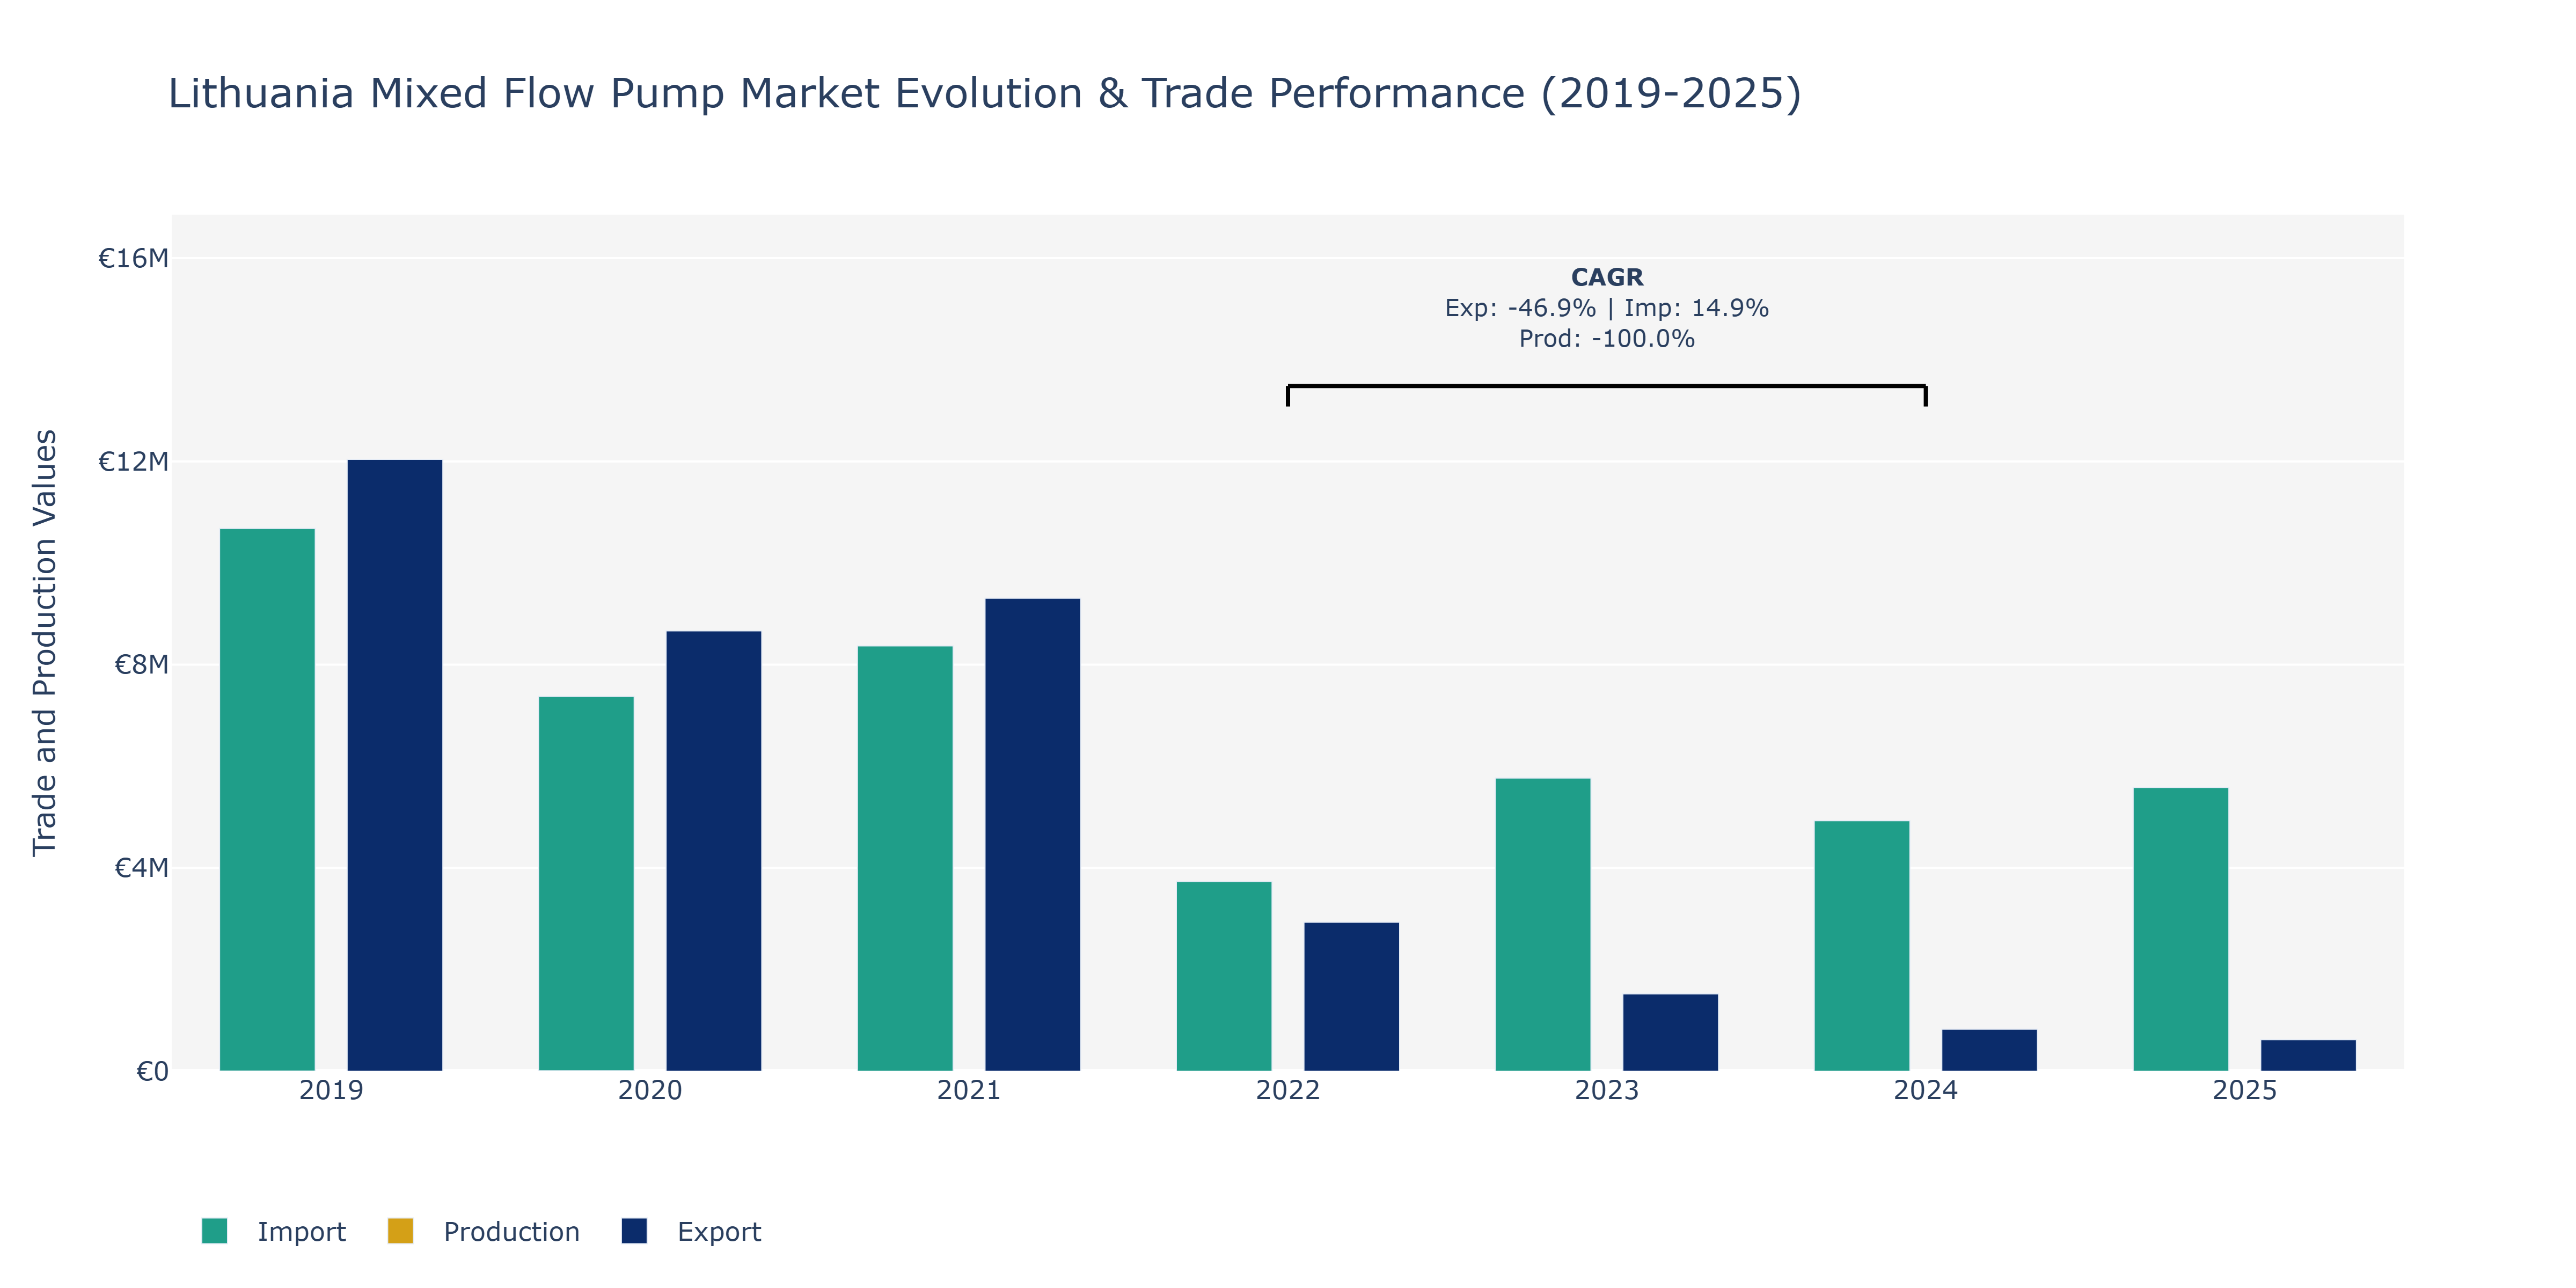
In the Lithuania Mixed Flow Pump Market, exports experienced a notable decline from €12.04 million in 2019 to €620.71 thousand in 2025. This substantial decrease can be attributed to various factors such as shifts in global demand, changes in trade policies, or increased competition from other markets. Imports, on the other hand, fluctuated over the years, reaching €5.58 million in 2025 after peaking at €10.68 million in 2019. This erratic pattern suggests possible volatility in supply chains, economic conditions, or fluctuations in raw material prices affecting import levels. Production remained relatively stable at €1.63 million in 2019 and saw a decline to €1 billion in 2021, which may reflect shifts in domestic manufacturing capacities or technological advancements impacting production efficiencies. The market dynamics underline the importance of adapting strategies to navigate changing market conditions, exploring new export markets, optimizing import processes, and enhancing production capabilities to stay competitive in the evolving landscape of the mixed flow pump industry.
Key Highlights of the Report:
- Lithuania Mixed Flow Pump Market Outlook
- Market Size of Lithuania Mixed Flow Pump Market, 2025
- Forecast of Lithuania Mixed Flow Pump Market, 2032
- Historical Data and Forecast of Lithuania Mixed Flow Pump Revenues & Volume for the Period 2022 - 2032
- Lithuania Mixed Flow Pump Market Trend Evolution
- Lithuania Mixed Flow Pump Market Drivers and Challenges
- Lithuania Mixed Flow Pump Price Trends
- Lithuania Mixed Flow Pump Porter's Five Forces
- Lithuania Mixed Flow Pump Industry Life Cycle
- Historical Data and Forecast of Lithuania Mixed Flow Pump Market Revenues & Volume By Configuration for the Period 2022 - 2032
- Historical Data and Forecast of Lithuania Mixed Flow Pump Market Revenues & Volume By Single-stage for the Period 2022 - 2032
- Historical Data and Forecast of Lithuania Mixed Flow Pump Market Revenues & Volume By Multi-stage for the Period 2022 - 2032
- Historical Data and Forecast of Lithuania Mixed Flow Pump Market Revenues & Volume By End-use for the Period 2022 - 2032
- Historical Data and Forecast of Lithuania Mixed Flow Pump Market Revenues & Volume By Agriculture for the Period 2022 - 2032
- Historical Data and Forecast of Lithuania Mixed Flow Pump Market Revenues & Volume By Construction & Building Services for the Period 2022 - 2032
- Historical Data and Forecast of Lithuania Mixed Flow Pump Market Revenues & Volume By Water & Wastewater for the Period 2022 - 2032
- Historical Data and Forecast of Lithuania Mixed Flow Pump Market Revenues & Volume By Power Generation for the Period 2022 - 2032
- Historical Data and Forecast of Lithuania Mixed Flow Pump Market Revenues & Volume By Oil & Gas for the Period 2022 - 2032
- Historical Data and Forecast of Lithuania Mixed Flow Pump Market Revenues & Volume By Chemical for the Period 2022 - 2032
- Lithuania Mixed Flow Pump Import Export Trade Statistics
- Market Opportunity Assessment By Configuration
- Market Opportunity Assessment By End-use
- Lithuania Mixed Flow Pump Top Companies Market Share
- Lithuania Mixed Flow Pump Competitive Benchmarking By Technical and Operational Parameters
- Lithuania Mixed Flow Pump Company Profiles
- Lithuania Mixed Flow Pump Key Strategic Recommendations
Frequently Asked Questions About the Market Study (FAQs):
6Wresearch actively monitors the Lithuania Mixed Flow Pump Market and publishes its comprehensive annual report, highlighting emerging trends, growth drivers, revenue analysis, and forecast outlook. Our insights help businesses to make data-backed strategic decisions with ongoing market dynamics. Our analysts track relevent industries related to the Lithuania Mixed Flow Pump Market, allowing our clients with actionable intelligence and reliable forecasts tailored to emerging regional needs.
Yes, we provide customisation as per your requirements. To learn more, feel free to contact us on sales@6wresearch.com
1 Executive Summary |
2 Introduction |
2.1 Key Highlights of the Report |
2.2 Report Description |
2.3 Market Scope & Segmentation |
2.4 Research Methodology |
2.5 Assumptions |
3 Lithuania Mixed Flow Pump Market Overview |
3.1 Lithuania Country Macro Economic Indicators |
3.2 Lithuania Mixed Flow Pump Market Revenues & Volume, 2022 & 2032F |
3.3 Lithuania Mixed Flow Pump Market - Industry Life Cycle |
3.4 Lithuania Mixed Flow Pump Market - Porter's Five Forces |
3.5 Lithuania Mixed Flow Pump Market Revenues & Volume Share, By Configuration, 2022 & 2032F |
3.6 Lithuania Mixed Flow Pump Market Revenues & Volume Share, By End-use, 2022 & 2032F |
4 Lithuania Mixed Flow Pump Market Dynamics |
4.1 Impact Analysis |
4.2 Market Drivers |
4.2.1 Increasing demand for efficient water management systems |
4.2.2 Growing emphasis on renewable energy sources |
4.2.3 Infrastructure development projects in Lithuania |
4.3 Market Restraints |
4.3.1 High initial investment costs for mixed flow pumps |
4.3.2 Limited awareness and adoption of advanced pumping technologies |
5 Lithuania Mixed Flow Pump Market Trends |
6 Lithuania Mixed Flow Pump Market, By Types |
6.1 Lithuania Mixed Flow Pump Market, By Configuration |
6.1.1 Overview and Analysis |
6.1.2 Lithuania Mixed Flow Pump Market Revenues & Volume, By Configuration, 2022 - 2032F |
6.1.3 Lithuania Mixed Flow Pump Market Revenues & Volume, By Single-stage, 2022 - 2032F |
6.1.4 Lithuania Mixed Flow Pump Market Revenues & Volume, By Multi-stage, 2022 - 2032F |
6.2 Lithuania Mixed Flow Pump Market, By End-use |
6.2.1 Overview and Analysis |
6.2.2 Lithuania Mixed Flow Pump Market Revenues & Volume, By Agriculture, 2022 - 2032F |
6.2.3 Lithuania Mixed Flow Pump Market Revenues & Volume, By Construction & Building Services, 2022 - 2032F |
6.2.4 Lithuania Mixed Flow Pump Market Revenues & Volume, By Water & Wastewater, 2022 - 2032F |
6.2.5 Lithuania Mixed Flow Pump Market Revenues & Volume, By Power Generation, 2022 - 2032F |
6.2.6 Lithuania Mixed Flow Pump Market Revenues & Volume, By Oil & Gas, 2022 - 2032F |
6.2.7 Lithuania Mixed Flow Pump Market Revenues & Volume, By Chemical, 2022 - 2032F |
7 Lithuania Mixed Flow Pump Market Import-Export Trade Statistics |
7.1 Lithuania Mixed Flow Pump Market Export to Major Countries |
7.2 Lithuania Mixed Flow Pump Market Imports from Major Countries |
8 Lithuania Mixed Flow Pump Market Key Performance Indicators |
8.1 Energy efficiency rating of mixed flow pumps in the market |
8.2 Number of infrastructure projects utilizing mixed flow pumps |
8.3 Government incentives or subsidies for promoting energy-efficient pumping solutions |
9 Lithuania Mixed Flow Pump Market - Opportunity Assessment |
9.1 Lithuania Mixed Flow Pump Market Opportunity Assessment, By Configuration, 2022 & 2032F |
9.2 Lithuania Mixed Flow Pump Market Opportunity Assessment, By End-use, 2022 & 2032F |
10 Lithuania Mixed Flow Pump Market - Competitive Landscape |
10.1 Lithuania Mixed Flow Pump Market Revenue Share, By Companies, 2025 |
10.2 Lithuania Mixed Flow Pump Market Competitive Benchmarking, By Operating and Technical Parameters |
11 Company Profiles |
12 Recommendations |
13 Disclaimer |
Export potential assessment - trade Analytics for 2030
Export potential enables firms to identify high-growth global markets with greater confidence by combining advanced trade intelligence with a structured quantitative methodology. The framework analyzes emerging demand trends and country-level import patterns while integrating macroeconomic and trade datasets such as GDP and population forecasts, bilateral import–export flows, tariff structures, elasticity differentials between developed and developing economies, geographic distance, and import demand projections. Using weighted trade values from 2020–2024 as the base period to project country-to-country export potential for 2030, these inputs are operationalized through calculated drivers such as gravity model parameters, tariff impact factors, and projected GDP per-capita growth. Through an analysis of hidden potentials, demand hotspots, and market conditions that are most favorable to success, this method enables firms to focus on target countries, maximize returns, and global expansion with data, backed by accuracy.
By factoring in the projected importer demand gap that is currently unmet and could be potential opportunity, it identifies the potential for the Exporter (Country) among 190 countries, against the general trade analysis, which identifies the biggest importer or exporter.
To discover high-growth global markets and optimize your business strategy:
Click Here
Pricing
- Single User License$ 1,995
- Department License$ 2,400
- Site License$ 3,120
- Global License$ 3,795

Search
Thought Leadership and Analyst Meet


Our Clients
Latest Reports
- France Thermally Conductive Filler Dispersants Market (2026-2032) | Challenges, Restraints, Value, Share, Size, segmentation, Analysis, Trends, Investment Opportunities, Outlook, Pricing, Demand, Forecast, Revenue, Companies, Growth, Drivers, Strategy, Insights, Competition
- Egypt Thermally Conductive Filler Dispersants Market (2026-2032) | Competition, Forecast, Strategy, Value, Insights, Outlook, Investment Opportunities, Pricing, Demand, Share, segmentation, Drivers, Size, Companies, Restraints, Growth, Trends, Revenue, Challenges, Analysis
- Czech Republic Thermally Conductive Filler Dispersants Market (2026-2032) | Forecast, Pricing, Analysis, Drivers, Insights, Size, Demand, Growth, Challenges, segmentation, Competition, Outlook, Trends, Investment Opportunities, Companies, Strategy, Revenue, Share, Value, Restraints
- Colombia Thermally Conductive Filler Dispersants Market (2026-2032) | segmentation, Trends, Share, Drivers, Strategy, Companies, Demand, Insights, Size, Challenges, Value, Competition, Analysis, Growth, Revenue, Restraints, Forecast, Pricing, Outlook, Investment Opportunities
- China Thermally Conductive Filler Dispersants Market (2026-2032) | Restraints, Investment Opportunities, Pricing, Companies, Share, Size, Challenges, Trends, Outlook, Value, Analysis, Competition, Revenue, Drivers, Forecast, Demand, Insights, Growth, Strategy, segmentation
- Chile Thermally Conductive Filler Dispersants Market (2026-2032) | Investment Opportunities, Trends, Value, Restraints, Share, Companies, Forecast, segmentation, Pricing, Challenges, Demand, Size, Analysis, Drivers, Outlook, Growth, Competition, Strategy, Revenue, Insights
- Cambodia Thermally Conductive Filler Dispersants Market (2026-2032) | Analysis, Share, Outlook, Strategy, Pricing, Demand, Size, Growth, segmentation, Insights, Revenue, Forecast, Challenges, Competition, Companies, Investment Opportunities, Trends, Restraints, Value, Drivers
- Brazil Thermally Conductive Filler Dispersants Market (2026-2032) | Restraints, Forecast, Competition, Size, Revenue, Value, Investment Opportunities, Trends, Insights, Outlook, Growth, Analysis, Drivers, segmentation, Pricing, Challenges, Strategy, Share, Companies, Demand
- Bangladesh Thermally Conductive Filler Dispersants Market (2026-2032) | Restraints, Trends, Analysis, Competition, Insights, Forecast, Value, Investment Opportunities, Pricing, Share, Demand, Outlook, Revenue, segmentation, Companies, Drivers, Growth, Size, Challenges, Strategy
- Bahrain Thermally Conductive Filler Dispersants Market (2026-2032) | Trends, Outlook, Pricing, Demand, Value, Competition, Forecast, Growth, segmentation, Revenue, Companies, Analysis, Insights, Size, Drivers, Challenges, Strategy, Investment Opportunities, Share, Restraints
Industry Events and Analyst Meet

HIMTEX 2026

India Refining Summit 2026

India EV Show 2026

EV tech India Expo 2026

Auto Tech Asia 2026
Whitepaper
- Middle East & Africa Commercial Security Market Click here to view more.
- Middle East & Africa Fire Safety Systems & Equipment Market Click here to view more.
- GCC Drone Market Click here to view more.
- Middle East Lighting Fixture Market Click here to view more.
- GCC Physical & Perimeter Security Market Click here to view more.
6WResearch In News
- Doha a strategic location for EV manufacturing hub: IPA Qatar
- Demand for luxury TVs surging in the GCC, says Samsung
- Empowering Growth: The Thriving Journey of Bangladesh’s Cable Industry
- Demand for luxury TVs surging in the GCC, says Samsung
- Video call with a traditional healer? Once unthinkable, it’s now common in South Africa
- Intelligent Buildings To Smooth GCC’s Path To Net Zero