Lithuania Nitrobenzene Market (2026-2032) | Growth, Trends, Competitive Landscape, Value, Companies, Size & Revenue, Industry, Forecast, Outlook, Share, Segmentation, Analysis
Market Forecast By Form (Liquid, Powder), By Grade (Agricultural, Industrial, Pharmaceutical), By Application (Aniline Production, Lubricating Oils, Dyes & Pigments, Synthetic Rubber, Pesticides, Others (fertilizers, drugs, etc.)), By End-use (Pharmaceuticals, Automotive, Leather, Agriculture, Others) And Competitive Landscape
| Product Code: ETC8046436 | Publication Date: Sep 2024 | Updated Date: Apr 2026 | Product Type: Market Research Report | |
| Publisher: 6Wresearch | Author: Shubham Padhi | No. of Pages: 75 | No. of Figures: 35 | No. of Tables: 20 |
Lithuania Nitrobenzene Market Size (2020-2030)
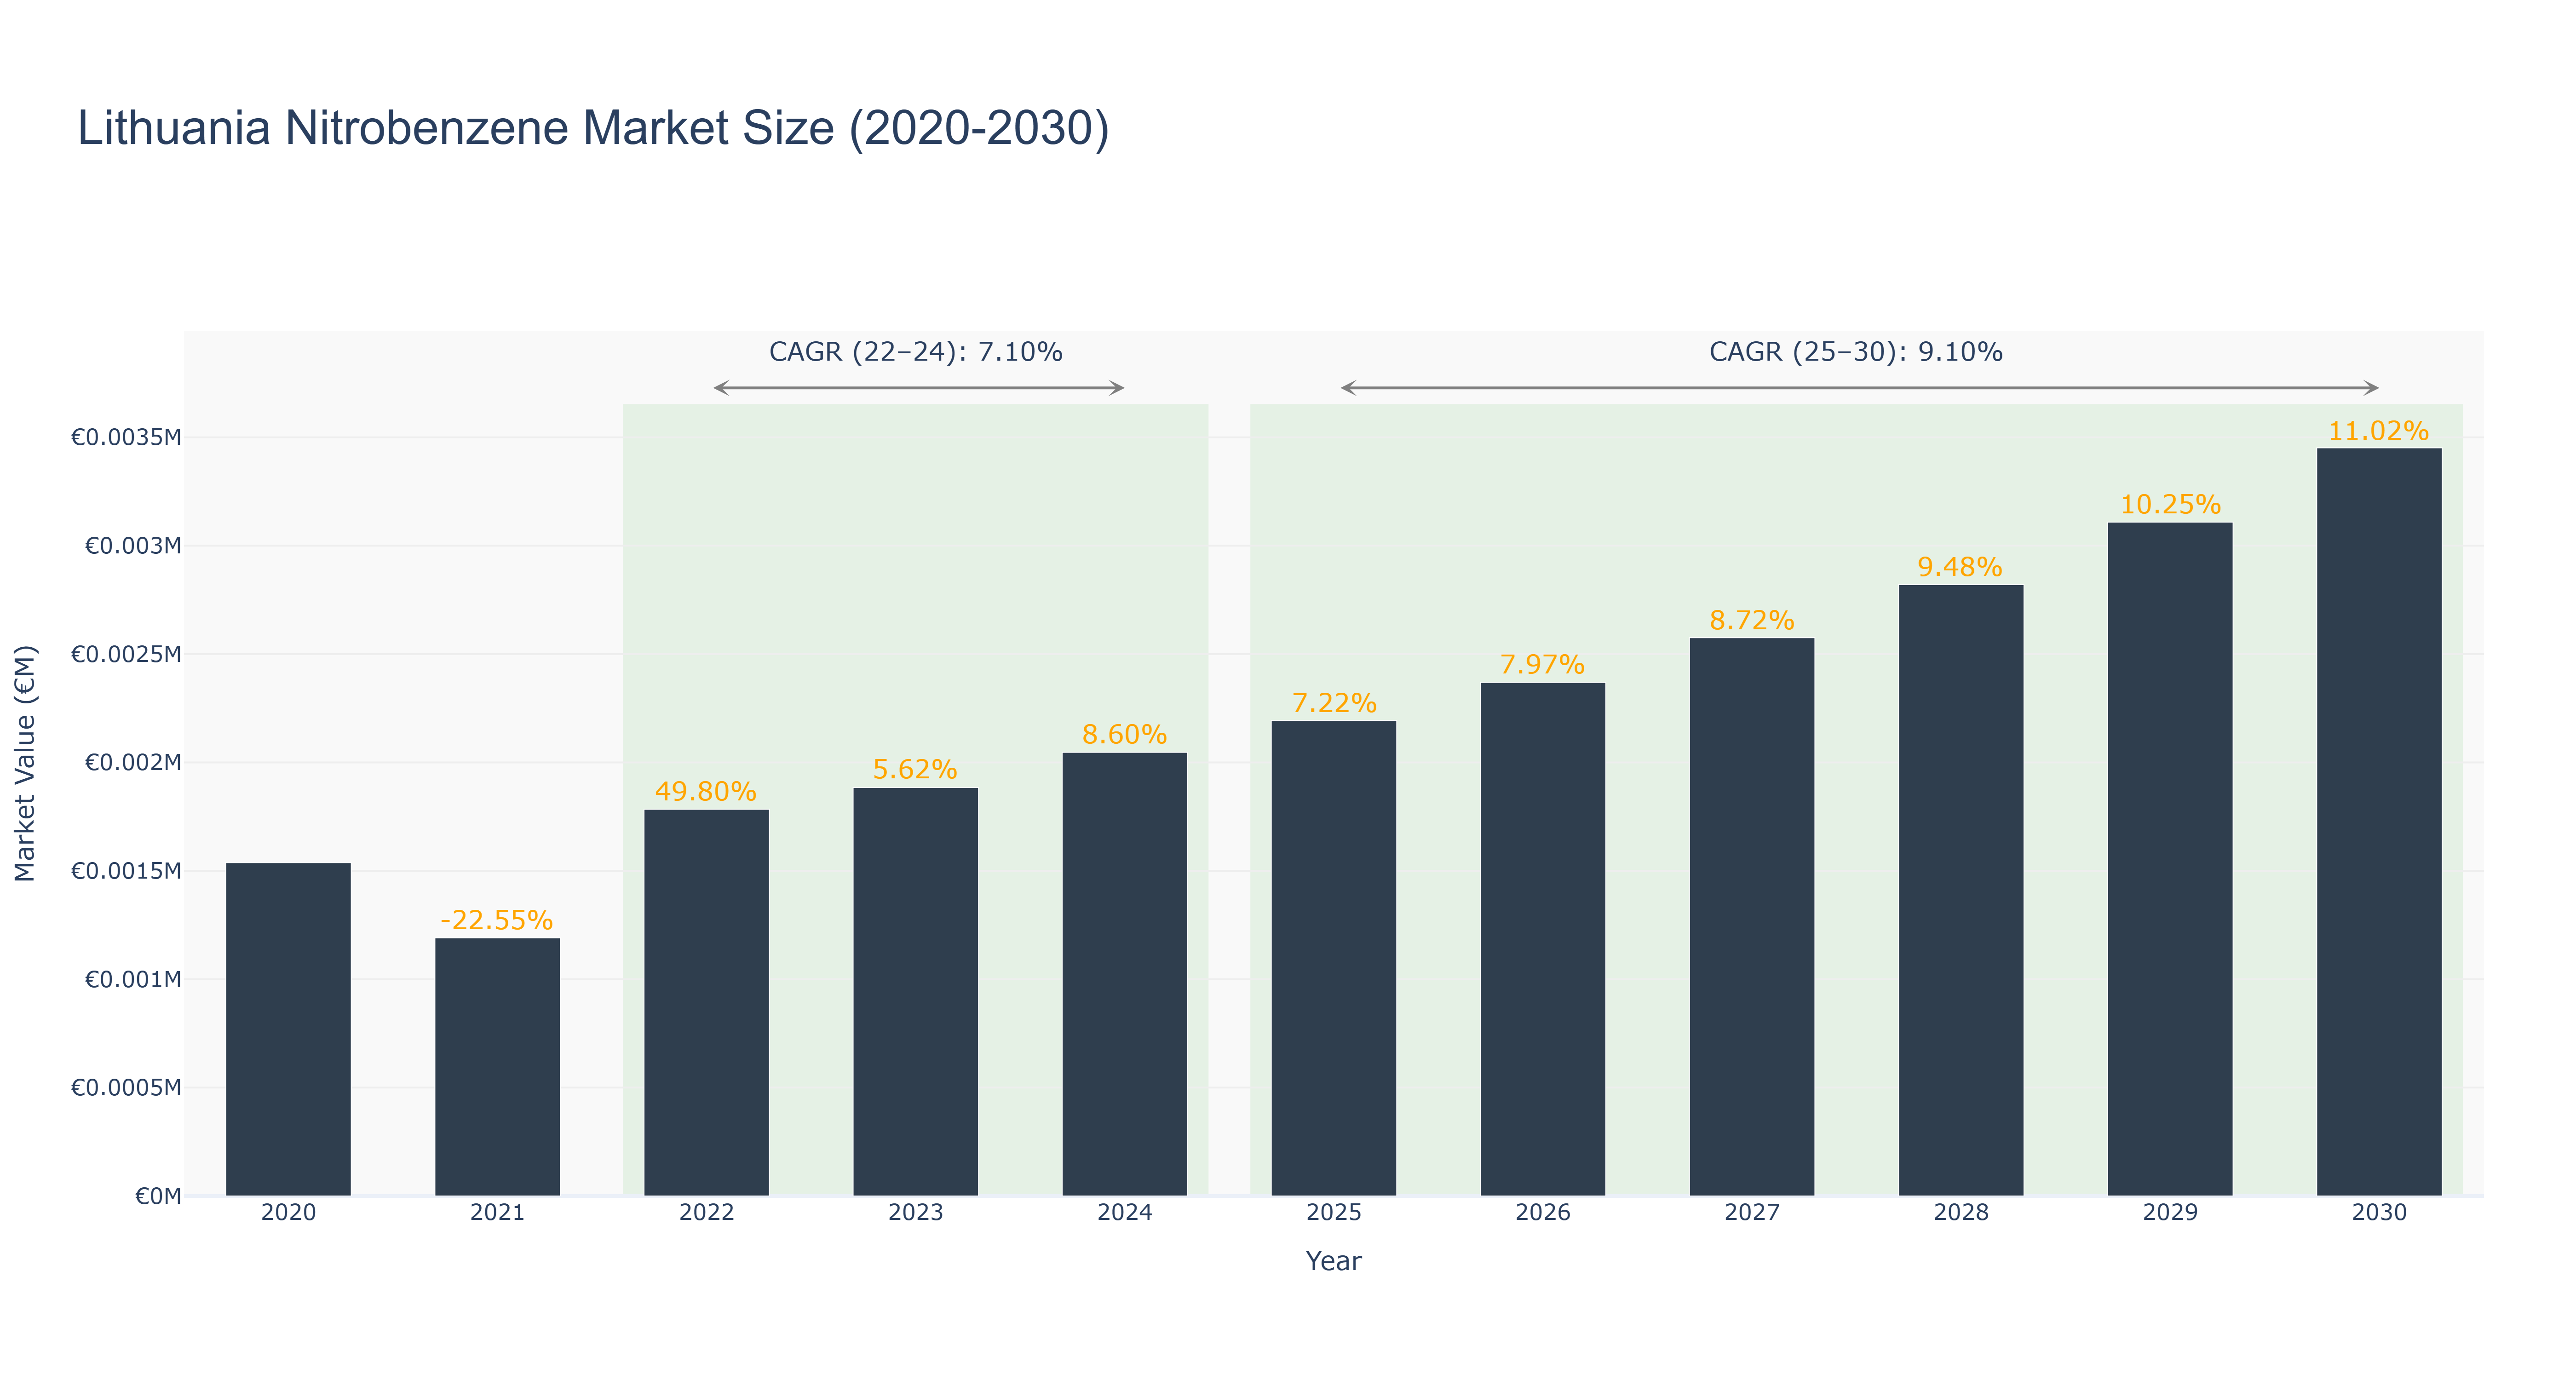
The Lithuania Nitrobenzene Market has exhibited a volatile trajectory over recent years, with actual market sizes ranging from €1.54 thousand in 2020 to €1.88 thousand in 2023, reflecting a significant decline of 22.55% in 2021 followed by a robust recovery of 49.80% in 2022. The market is projected to continue its upward momentum, reaching €2.19 thousand in 2025 and expanding to €3.45 thousand by 2030, supported by a forecasted CAGR of 9.10% during this period. The growth in the upcoming years can be attributed to increasing demand in various chemical applications and advancements in production technologies, which enhance efficiency and reduce costs. As Lithuania continues to strengthen its industrial base, investments in infrastructure and sustainability initiatives are expected to further bolster the market, positioning it favorably within the broader European context.
Lithuania Nitrobenzene Market: Production & Trade Performance (2019-2025)
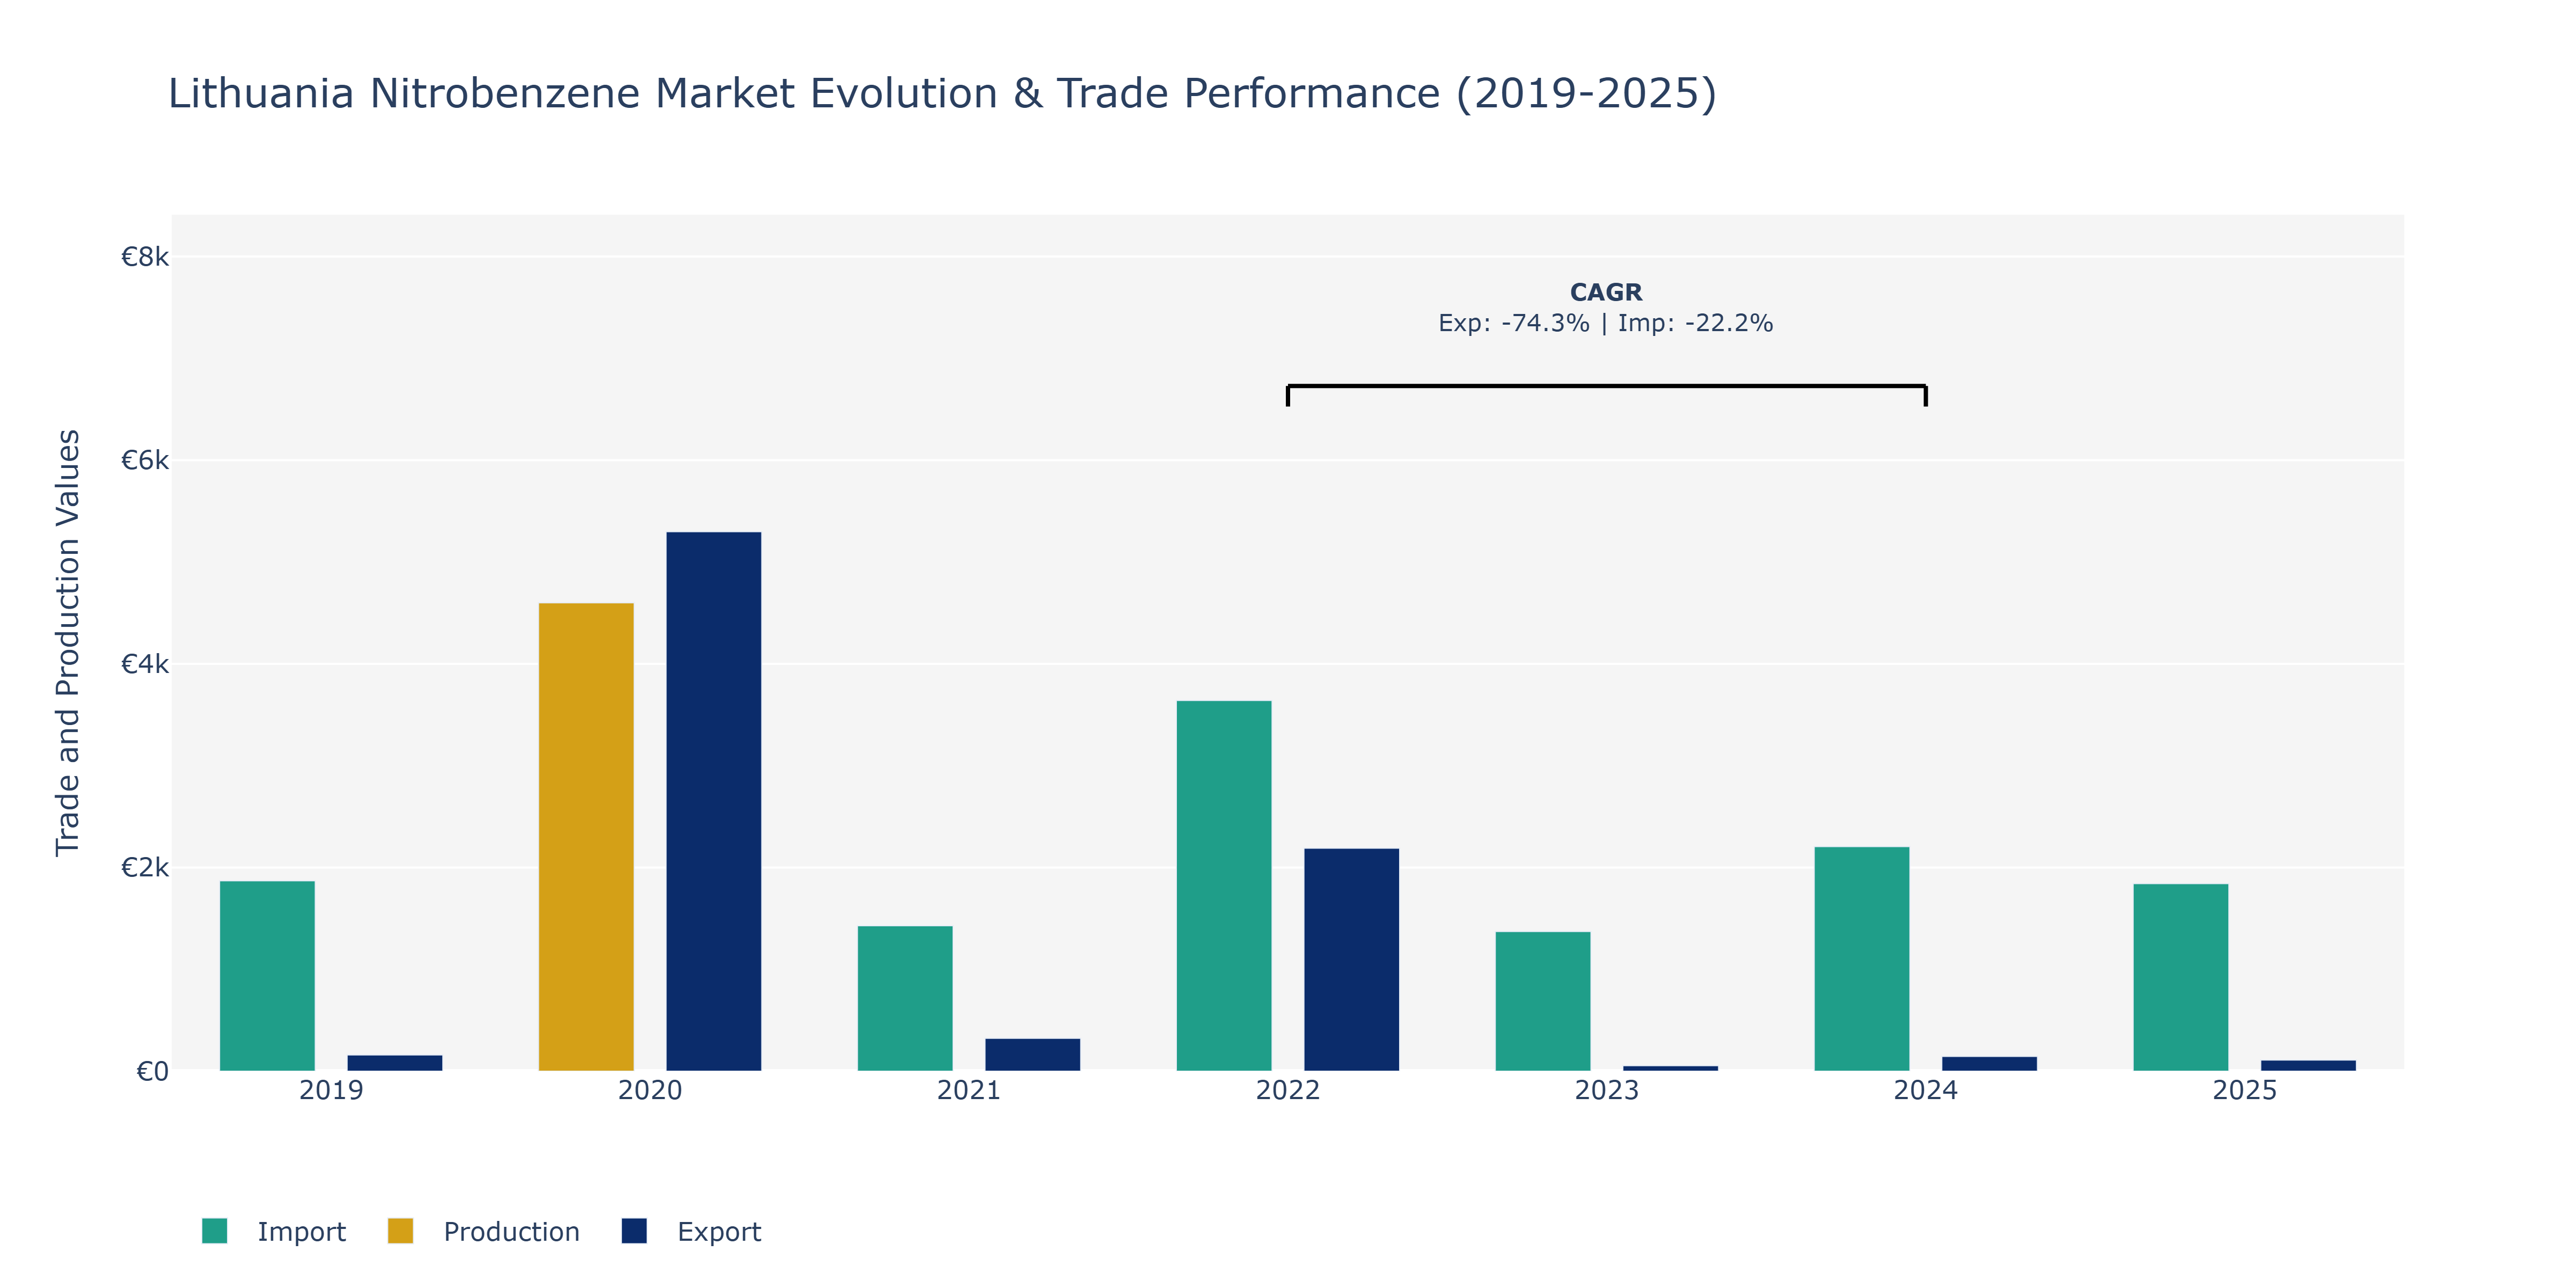
Between 2019 and 2025, Lithuania's Nitrobenzene market witnessed dynamic shifts in exports, imports, and production. In 2020, exports soared to €5.3 thousand, a sharp contrast to the modest €160 million in 2019. This peak was followed by fluctuations, with noticeable declines in 2023 and 2024 before a slight recovery in 2025. Imports peaked at €1.87 thousand in 2019, gradually decreasing over the years, reaching €1.84 thousand by 2025. The surge in exports in 2020 can be attributed to increased global demand or strategic market positioning efforts by local producers. Conversely, fluctuations in subsequent years could be influenced by global market conditions, trade agreements, or domestic production capacity adjustments in response to changing demand patterns. To sustain market competitiveness, stakeholders may need to closely monitor global market trends and adapt strategies accordingly.
Key Highlights of the Report:
- Lithuania Nitrobenzene Market Outlook
- Market Size of Lithuania Nitrobenzene Market, 2025
- Forecast of Lithuania Nitrobenzene Market, 2032
- Historical Data and Forecast of Lithuania Nitrobenzene Revenues & Volume for the Period 2022 - 2032
- Lithuania Nitrobenzene Market Trend Evolution
- Lithuania Nitrobenzene Market Drivers and Challenges
- Lithuania Nitrobenzene Price Trends
- Lithuania Nitrobenzene Porter's Five Forces
- Lithuania Nitrobenzene Industry Life Cycle
- Historical Data and Forecast of Lithuania Nitrobenzene Market Revenues & Volume By Form for the Period 2022 - 2032
- Historical Data and Forecast of Lithuania Nitrobenzene Market Revenues & Volume By Liquid for the Period 2022 - 2032
- Historical Data and Forecast of Lithuania Nitrobenzene Market Revenues & Volume By Powder for the Period 2022 - 2032
- Historical Data and Forecast of Lithuania Nitrobenzene Market Revenues & Volume By Grade for the Period 2022 - 2032
- Historical Data and Forecast of Lithuania Nitrobenzene Market Revenues & Volume By Agricultural for the Period 2022 - 2032
- Historical Data and Forecast of Lithuania Nitrobenzene Market Revenues & Volume By Industrial for the Period 2022 - 2032
- Historical Data and Forecast of Lithuania Nitrobenzene Market Revenues & Volume By Pharmaceutical for the Period 2022 - 2032
- Historical Data and Forecast of Lithuania Nitrobenzene Market Revenues & Volume By Application for the Period 2022 - 2032
- Historical Data and Forecast of Lithuania Nitrobenzene Market Revenues & Volume By Aniline Production for the Period 2022 - 2032
- Historical Data and Forecast of Lithuania Nitrobenzene Market Revenues & Volume By Lubricating Oils for the Period 2022 - 2032
- Historical Data and Forecast of Lithuania Nitrobenzene Market Revenues & Volume By Dyes & Pigments for the Period 2022 - 2032
- Historical Data and Forecast of Lithuania Nitrobenzene Market Revenues & Volume By Synthetic Rubber for the Period 2022 - 2032
- Historical Data and Forecast of Lithuania Nitrobenzene Market Revenues & Volume By Pesticides for the Period 2022 - 2032
- Historical Data and Forecast of Lithuania Nitrobenzene Market Revenues & Volume By Others (fertilizers, drugs, etc.) for the Period 2022 - 2032
- Historical Data and Forecast of Lithuania Nitrobenzene Market Revenues & Volume By End-use for the Period 2022 - 2032
- Historical Data and Forecast of Lithuania Nitrobenzene Market Revenues & Volume By Pharmaceuticals for the Period 2022 - 2032
- Historical Data and Forecast of Lithuania Nitrobenzene Market Revenues & Volume By Automotive for the Period 2022 - 2032
- Historical Data and Forecast of Lithuania Nitrobenzene Market Revenues & Volume By Leather for the Period 2022 - 2032
- Historical Data and Forecast of Lithuania Nitrobenzene Market Revenues & Volume By Agriculture for the Period 2022 - 2032
- Historical Data and Forecast of Lithuania Nitrobenzene Market Revenues & Volume By Others for the Period 2022 - 2032
- Lithuania Nitrobenzene Import Export Trade Statistics
- Market Opportunity Assessment By Form
- Market Opportunity Assessment By Grade
- Market Opportunity Assessment By Application
- Market Opportunity Assessment By End-use
- Lithuania Nitrobenzene Top Companies Market Share
- Lithuania Nitrobenzene Competitive Benchmarking By Technical and Operational Parameters
- Lithuania Nitrobenzene Company Profiles
- Lithuania Nitrobenzene Key Strategic Recommendations
Frequently Asked Questions About the Market Study (FAQs):
6Wresearch actively monitors the Lithuania Nitrobenzene Market and publishes its comprehensive annual report, highlighting emerging trends, growth drivers, revenue analysis, and forecast outlook. Our insights help businesses to make data-backed strategic decisions with ongoing market dynamics. Our analysts track relevent industries related to the Lithuania Nitrobenzene Market, allowing our clients with actionable intelligence and reliable forecasts tailored to emerging regional needs.
Yes, we provide customisation as per your requirements. To learn more, feel free to contact us on sales@6wresearch.com
1 Executive Summary |
2 Introduction |
2.1 Key Highlights of the Report |
2.2 Report Description |
2.3 Market Scope & Segmentation |
2.4 Research Methodology |
2.5 Assumptions |
3 Lithuania Nitrobenzene Market Overview |
3.1 Lithuania Country Macro Economic Indicators |
3.2 Lithuania Nitrobenzene Market Revenues & Volume, 2022 & 2032F |
3.3 Lithuania Nitrobenzene Market - Industry Life Cycle |
3.4 Lithuania Nitrobenzene Market - Porter's Five Forces |
3.5 Lithuania Nitrobenzene Market Revenues & Volume Share, By Form, 2022 & 2032F |
3.6 Lithuania Nitrobenzene Market Revenues & Volume Share, By Grade, 2022 & 2032F |
3.7 Lithuania Nitrobenzene Market Revenues & Volume Share, By Application, 2022 & 2032F |
3.8 Lithuania Nitrobenzene Market Revenues & Volume Share, By End-use, 2022 & 2032F |
4 Lithuania Nitrobenzene Market Dynamics |
4.1 Impact Analysis |
4.2 Market Drivers |
4.2.1 Growing demand for nitrobenzene in the pharmaceutical industry |
4.2.2 Increasing use of nitrobenzene in the production of agrochemicals |
4.2.3 Rising adoption of nitrobenzene in the manufacturing of dyes and pigments |
4.3 Market Restraints |
4.3.1 Fluctuating prices of raw materials used in nitrobenzene production |
4.3.2 Stringent environmental regulations impacting production processes |
5 Lithuania Nitrobenzene Market Trends |
6 Lithuania Nitrobenzene Market, By Types |
6.1 Lithuania Nitrobenzene Market, By Form |
6.1.1 Overview and Analysis |
6.1.2 Lithuania Nitrobenzene Market Revenues & Volume, By Form, 2022 - 2032F |
6.1.3 Lithuania Nitrobenzene Market Revenues & Volume, By Liquid, 2022 - 2032F |
6.1.4 Lithuania Nitrobenzene Market Revenues & Volume, By Powder, 2022 - 2032F |
6.2 Lithuania Nitrobenzene Market, By Grade |
6.2.1 Overview and Analysis |
6.2.2 Lithuania Nitrobenzene Market Revenues & Volume, By Agricultural, 2022 - 2032F |
6.2.3 Lithuania Nitrobenzene Market Revenues & Volume, By Industrial, 2022 - 2032F |
6.2.4 Lithuania Nitrobenzene Market Revenues & Volume, By Pharmaceutical, 2022 - 2032F |
6.3 Lithuania Nitrobenzene Market, By Application |
6.3.1 Overview and Analysis |
6.3.2 Lithuania Nitrobenzene Market Revenues & Volume, By Aniline Production, 2022 - 2032F |
6.3.3 Lithuania Nitrobenzene Market Revenues & Volume, By Lubricating Oils, 2022 - 2032F |
6.3.4 Lithuania Nitrobenzene Market Revenues & Volume, By Dyes & Pigments, 2022 - 2032F |
6.3.5 Lithuania Nitrobenzene Market Revenues & Volume, By Synthetic Rubber, 2022 - 2032F |
6.3.6 Lithuania Nitrobenzene Market Revenues & Volume, By Pesticides, 2022 - 2032F |
6.3.7 Lithuania Nitrobenzene Market Revenues & Volume, By Others (fertilizers, drugs, etc.), 2022 - 2032F |
6.4 Lithuania Nitrobenzene Market, By End-use |
6.4.1 Overview and Analysis |
6.4.2 Lithuania Nitrobenzene Market Revenues & Volume, By Pharmaceuticals, 2022 - 2032F |
6.4.3 Lithuania Nitrobenzene Market Revenues & Volume, By Automotive, 2022 - 2032F |
6.4.4 Lithuania Nitrobenzene Market Revenues & Volume, By Leather, 2022 - 2032F |
6.4.5 Lithuania Nitrobenzene Market Revenues & Volume, By Agriculture, 2022 - 2032F |
6.4.6 Lithuania Nitrobenzene Market Revenues & Volume, By Others, 2022 - 2032F |
7 Lithuania Nitrobenzene Market Import-Export Trade Statistics |
7.1 Lithuania Nitrobenzene Market Export to Major Countries |
7.2 Lithuania Nitrobenzene Market Imports from Major Countries |
8 Lithuania Nitrobenzene Market Key Performance Indicators |
8.1 Average selling price of nitrobenzene in Lithuania |
8.2 Capacity utilization rate of nitrobenzene production facilities |
8.3 Number of new product developments using nitrobenzene technology |
8.4 Export/import trends of nitrobenzene in Lithuania |
8.5 Research and development investments in nitrobenzene-related innovations |
9 Lithuania Nitrobenzene Market - Opportunity Assessment |
9.1 Lithuania Nitrobenzene Market Opportunity Assessment, By Form, 2022 & 2032F |
9.2 Lithuania Nitrobenzene Market Opportunity Assessment, By Grade, 2022 & 2032F |
9.3 Lithuania Nitrobenzene Market Opportunity Assessment, By Application, 2022 & 2032F |
9.4 Lithuania Nitrobenzene Market Opportunity Assessment, By End-use, 2022 & 2032F |
10 Lithuania Nitrobenzene Market - Competitive Landscape |
10.1 Lithuania Nitrobenzene Market Revenue Share, By Companies, 2025 |
10.2 Lithuania Nitrobenzene Market Competitive Benchmarking, By Operating and Technical Parameters |
11 Company Profiles |
12 Recommendations |
13 Disclaimer |
Export potential assessment - trade Analytics for 2030
Export potential enables firms to identify high-growth global markets with greater confidence by combining advanced trade intelligence with a structured quantitative methodology. The framework analyzes emerging demand trends and country-level import patterns while integrating macroeconomic and trade datasets such as GDP and population forecasts, bilateral import–export flows, tariff structures, elasticity differentials between developed and developing economies, geographic distance, and import demand projections. Using weighted trade values from 2020–2024 as the base period to project country-to-country export potential for 2030, these inputs are operationalized through calculated drivers such as gravity model parameters, tariff impact factors, and projected GDP per-capita growth. Through an analysis of hidden potentials, demand hotspots, and market conditions that are most favorable to success, this method enables firms to focus on target countries, maximize returns, and global expansion with data, backed by accuracy.
By factoring in the projected importer demand gap that is currently unmet and could be potential opportunity, it identifies the potential for the Exporter (Country) among 190 countries, against the general trade analysis, which identifies the biggest importer or exporter.
To discover high-growth global markets and optimize your business strategy:
Click Here
Pricing
- Single User License$ 1,995
- Department License$ 2,400
- Site License$ 3,120
- Global License$ 3,795

Search
Thought Leadership and Analyst Meet


Our Clients
Latest Reports
- France Thermally Conductive Filler Dispersants Market (2026-2032) | Challenges, Restraints, Value, Share, Size, segmentation, Analysis, Trends, Investment Opportunities, Outlook, Pricing, Demand, Forecast, Revenue, Companies, Growth, Drivers, Strategy, Insights, Competition
- Egypt Thermally Conductive Filler Dispersants Market (2026-2032) | Competition, Forecast, Strategy, Value, Insights, Outlook, Investment Opportunities, Pricing, Demand, Share, segmentation, Drivers, Size, Companies, Restraints, Growth, Trends, Revenue, Challenges, Analysis
- Czech Republic Thermally Conductive Filler Dispersants Market (2026-2032) | Forecast, Pricing, Analysis, Drivers, Insights, Size, Demand, Growth, Challenges, segmentation, Competition, Outlook, Trends, Investment Opportunities, Companies, Strategy, Revenue, Share, Value, Restraints
- Colombia Thermally Conductive Filler Dispersants Market (2026-2032) | segmentation, Trends, Share, Drivers, Strategy, Companies, Demand, Insights, Size, Challenges, Value, Competition, Analysis, Growth, Revenue, Restraints, Forecast, Pricing, Outlook, Investment Opportunities
- China Thermally Conductive Filler Dispersants Market (2026-2032) | Restraints, Investment Opportunities, Pricing, Companies, Share, Size, Challenges, Trends, Outlook, Value, Analysis, Competition, Revenue, Drivers, Forecast, Demand, Insights, Growth, Strategy, segmentation
- Chile Thermally Conductive Filler Dispersants Market (2026-2032) | Investment Opportunities, Trends, Value, Restraints, Share, Companies, Forecast, segmentation, Pricing, Challenges, Demand, Size, Analysis, Drivers, Outlook, Growth, Competition, Strategy, Revenue, Insights
- Cambodia Thermally Conductive Filler Dispersants Market (2026-2032) | Analysis, Share, Outlook, Strategy, Pricing, Demand, Size, Growth, segmentation, Insights, Revenue, Forecast, Challenges, Competition, Companies, Investment Opportunities, Trends, Restraints, Value, Drivers
- Brazil Thermally Conductive Filler Dispersants Market (2026-2032) | Restraints, Forecast, Competition, Size, Revenue, Value, Investment Opportunities, Trends, Insights, Outlook, Growth, Analysis, Drivers, segmentation, Pricing, Challenges, Strategy, Share, Companies, Demand
- Bangladesh Thermally Conductive Filler Dispersants Market (2026-2032) | Restraints, Trends, Analysis, Competition, Insights, Forecast, Value, Investment Opportunities, Pricing, Share, Demand, Outlook, Revenue, segmentation, Companies, Drivers, Growth, Size, Challenges, Strategy
- Bahrain Thermally Conductive Filler Dispersants Market (2026-2032) | Trends, Outlook, Pricing, Demand, Value, Competition, Forecast, Growth, segmentation, Revenue, Companies, Analysis, Insights, Size, Drivers, Challenges, Strategy, Investment Opportunities, Share, Restraints
Industry Events and Analyst Meet

HIMTEX 2026

India Refining Summit 2026

India EV Show 2026

EV tech India Expo 2026

Auto Tech Asia 2026
Whitepaper
- Middle East & Africa Commercial Security Market Click here to view more.
- Middle East & Africa Fire Safety Systems & Equipment Market Click here to view more.
- GCC Drone Market Click here to view more.
- Middle East Lighting Fixture Market Click here to view more.
- GCC Physical & Perimeter Security Market Click here to view more.
6WResearch In News
- Doha a strategic location for EV manufacturing hub: IPA Qatar
- Demand for luxury TVs surging in the GCC, says Samsung
- Empowering Growth: The Thriving Journey of Bangladesh’s Cable Industry
- Demand for luxury TVs surging in the GCC, says Samsung
- Video call with a traditional healer? Once unthinkable, it’s now common in South Africa
- Intelligent Buildings To Smooth GCC’s Path To Net Zero