Lithuania Non Alcoholic Beverages Market (2026-2032) | Value, Revenue, Forecast, Size, Outlook, Share, Analysis, Companies, Growth, Trends, Segmentation & Industry
Market Forecast By Type (Alcoholic Beverages, Non-Alcoholic Beverages, Bottled Water, Carbonated Soft Drinks, Fruit Juice, Milk), By Packaging Type (Cartons, Cans, Bottles, Others), By Distribution Channel (Online, Offline, Supermarkets, Departmental Stores, Specialty Stores) And Competitive Landscape
| Product Code: ETC4852564 | Publication Date: Nov 2023 | Updated Date: Apr 2026 | Product Type: Market Research Report | |
| Publisher: 6Wresearch | Author: Shubham Padhi | No. of Pages: 60 | No. of Figures: 30 | No. of Tables: 5 |
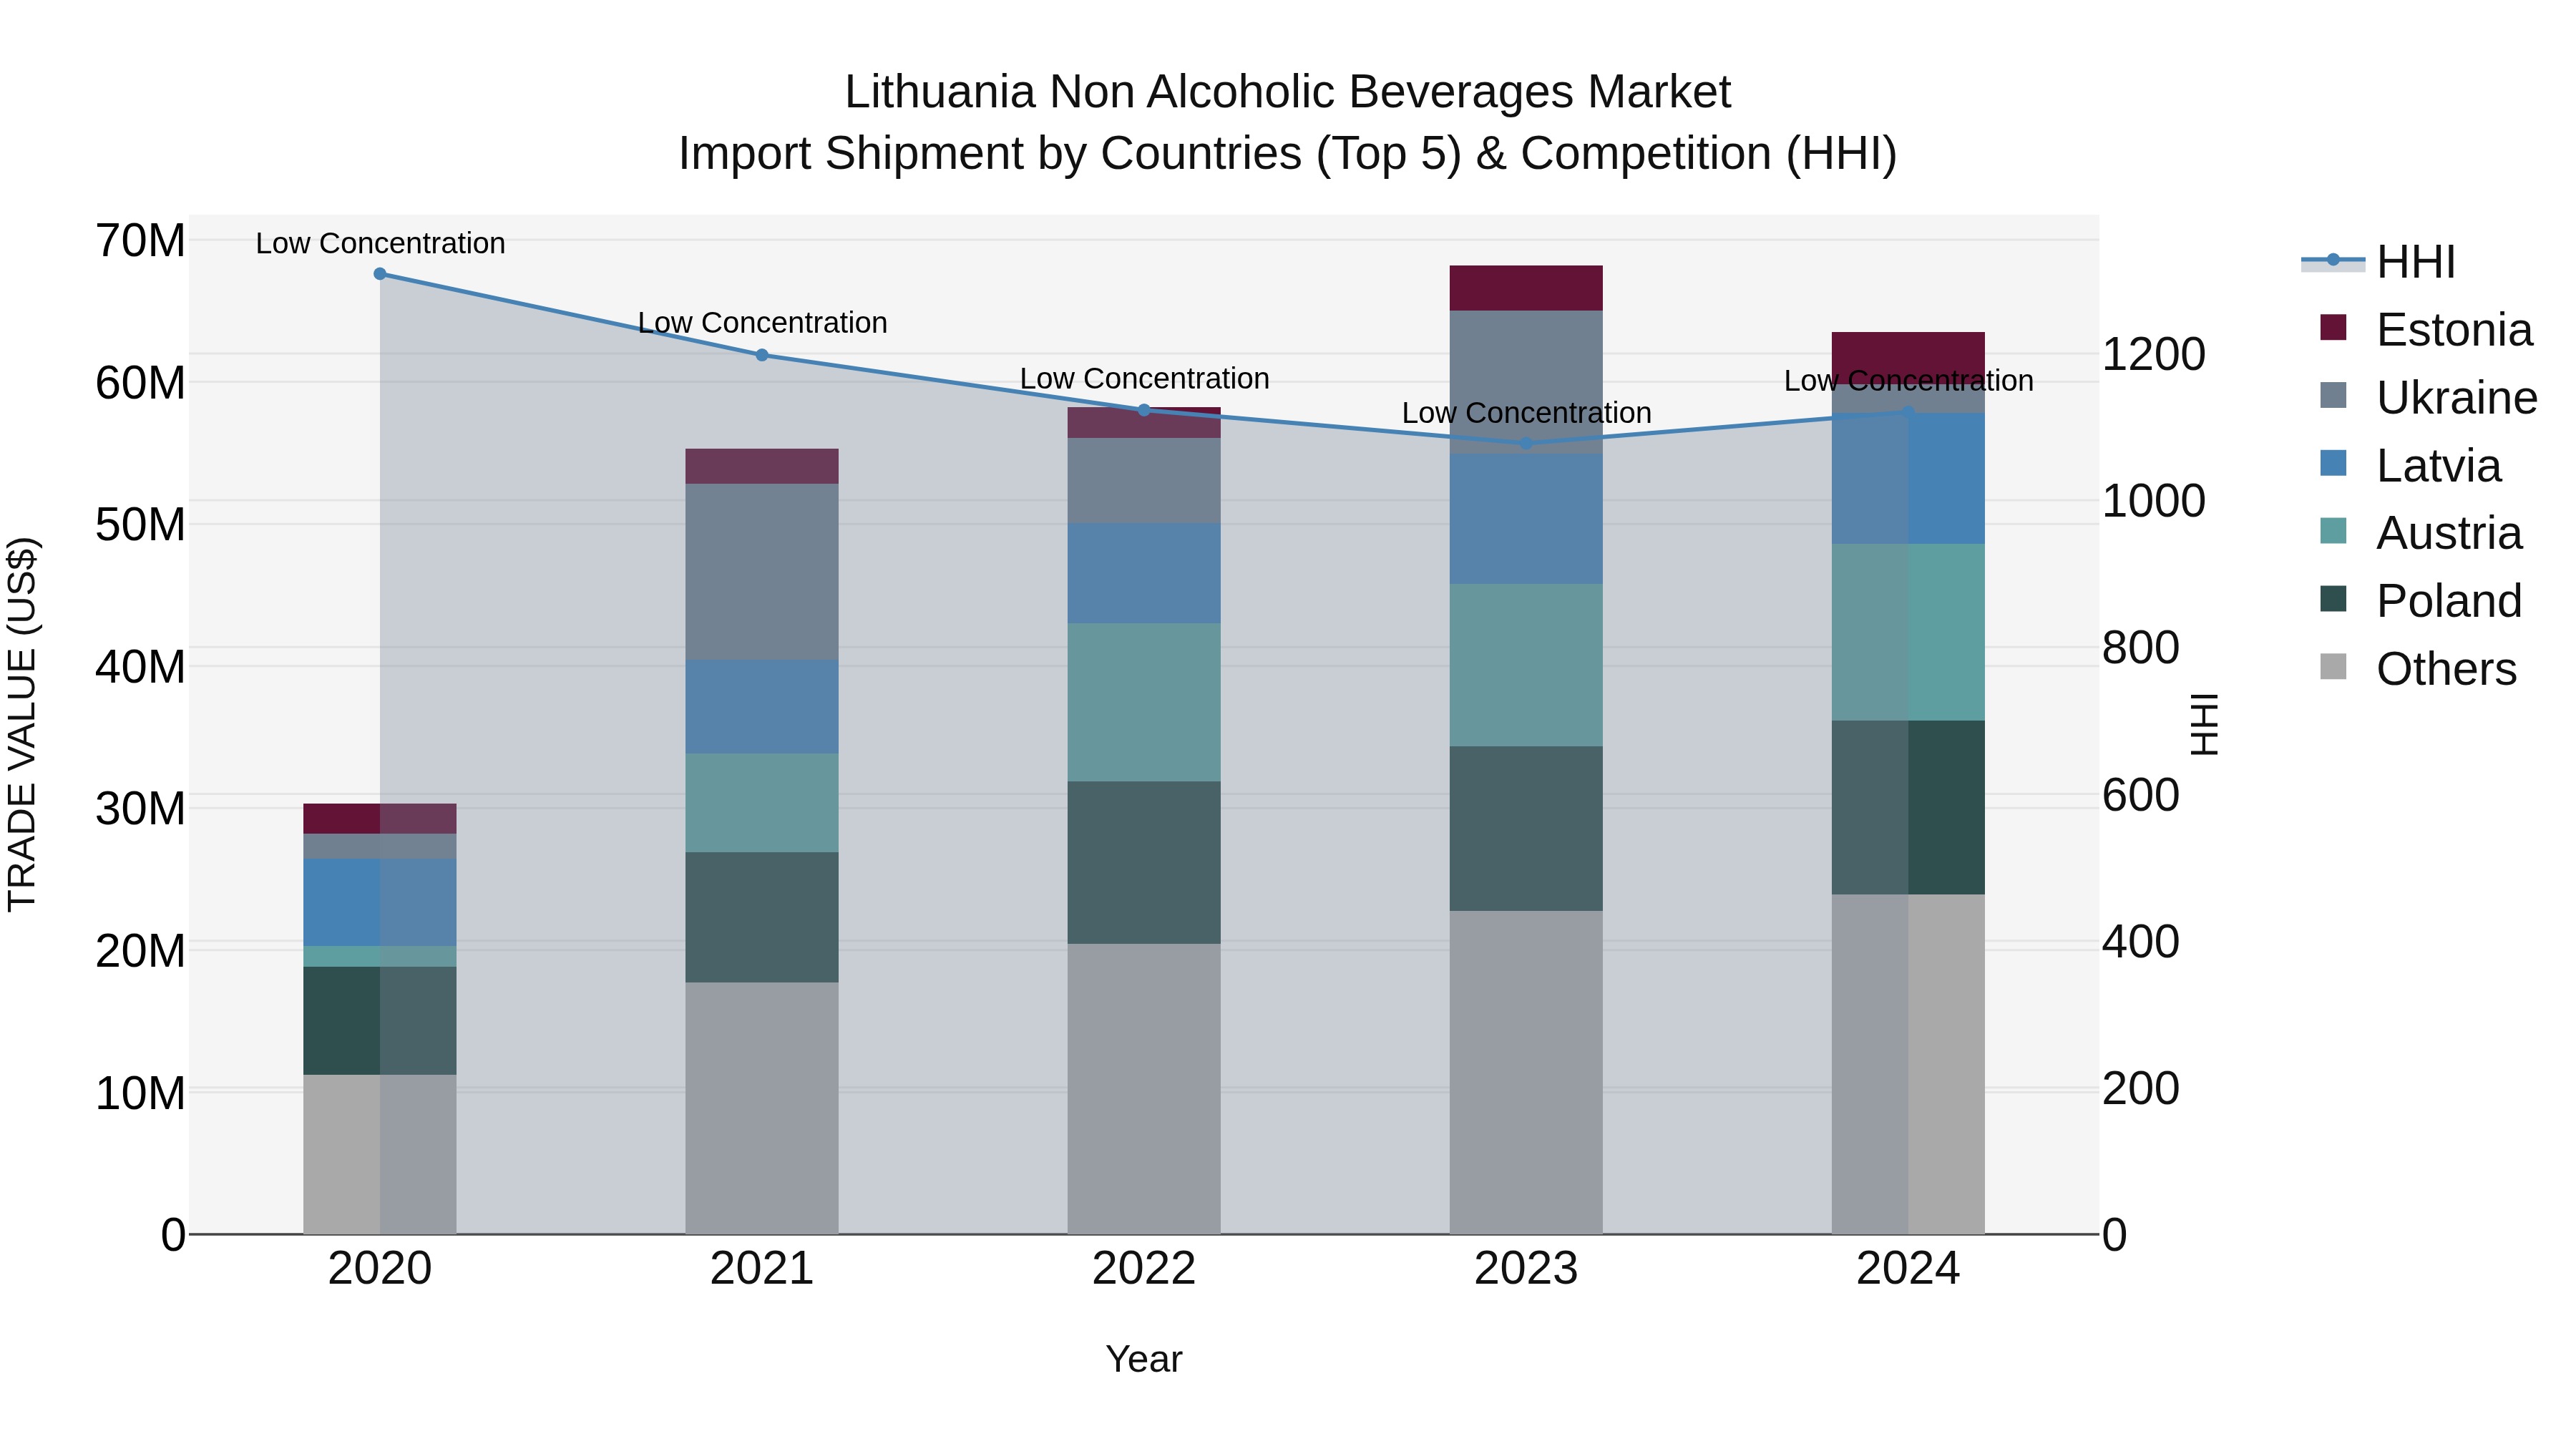
Lithuania Non Alcoholic Beverages Market Top 5 Importing Countries and Market Competition (HHI) Analysis
In 2024, Lithuania`s non-alcoholic beverage import market saw steady growth with a 20.33% CAGR from 2020 to 2024, driven by imports from Austria, Poland, Latvia, Estonia, and Serbia. Despite a slight decline in growth rate from 2023 to 2024 (-6.82%), the market remained competitive with low concentration indicated by the Herfindahl-Hirschman Index (HHI). This suggests a diverse range of non-alcoholic beverage offerings entering the Lithuanian market, providing consumers with a variety of options to choose from.
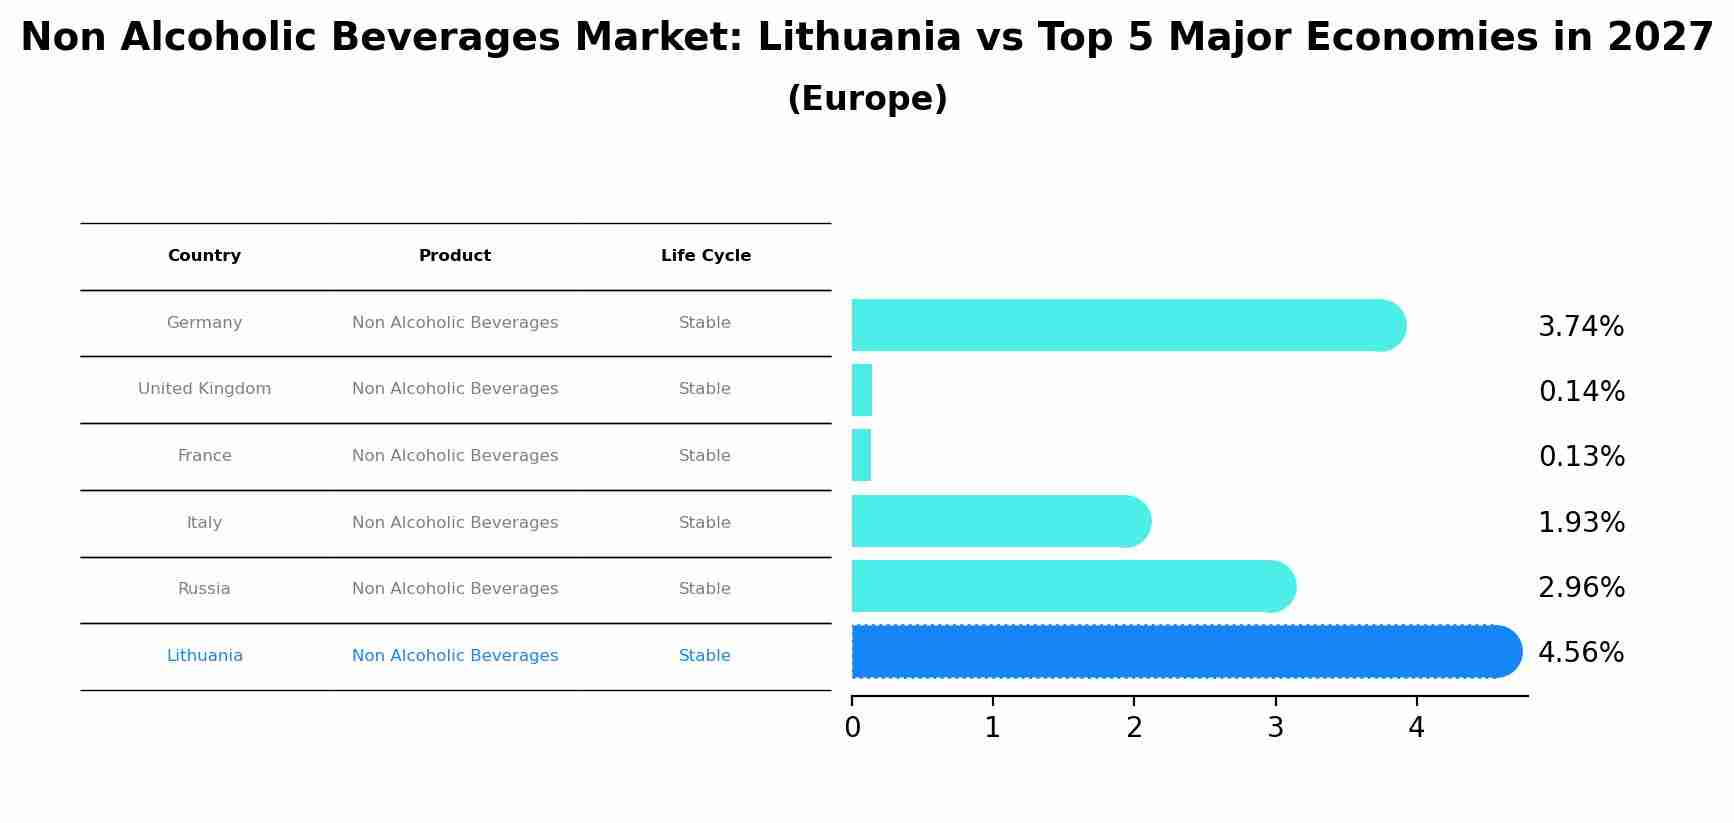
Non Alcoholic Beverages Market: Lithuania vs Top 5 Major Economies in 2027 (Europe)
By 2027, Lithuania's Non Alcoholic Beverages market is forecasted to achieve a stable growth rate of 4.56%, with Germany leading the Europe region, followed by United Kingdom, France, Italy and Russia.
Key Highlights of the Report:
- Lithuania Non Alcoholic Beverages Market Outlook
- Market Size of Lithuania Non Alcoholic Beverages Market, 2025
- Forecast of Lithuania Non Alcoholic Beverages Market, 2032
- Historical Data and Forecast of Lithuania Non Alcoholic Beverages Revenues & Volume for the Period 2022 - 2032F
- Lithuania Non Alcoholic Beverages Market Trend Evolution
- Lithuania Non Alcoholic Beverages Market Drivers and Challenges
- Lithuania Non Alcoholic Beverages Price Trends
- Lithuania Non Alcoholic Beverages Porter`s Five Forces
- Lithuania Non Alcoholic Beverages Industry Life Cycle
- Historical Data and Forecast of Lithuania Non Alcoholic Beverages Market Revenues & Volume By Type for the Period 2022 - 2032F
- Historical Data and Forecast of Lithuania Non Alcoholic Beverages Market Revenues & Volume By Alcoholic Beverages for the Period 2022 - 2032F
- Historical Data and Forecast of Lithuania Non Alcoholic Beverages Market Revenues & Volume By Non-Alcoholic Beverages for the Period 2022 - 2032F
- Historical Data and Forecast of Lithuania Non Alcoholic Beverages Market Revenues & Volume By Bottled Water for the Period 2022 - 2032F
- Historical Data and Forecast of Lithuania Non Alcoholic Beverages Market Revenues & Volume By Carbonated Soft Drinks for the Period 2022 - 2032F
- Historical Data and Forecast of Lithuania Non Alcoholic Beverages Market Revenues & Volume By Fruit Juice for the Period 2022 - 2032F
- Historical Data and Forecast of Lithuania Non Alcoholic Beverages Market Revenues & Volume By Milk for the Period 2022 - 2032F
- Historical Data and Forecast of Lithuania Non Alcoholic Beverages Market Revenues & Volume By Packaging Type for the Period 2022 - 2032F
- Historical Data and Forecast of Lithuania Non Alcoholic Beverages Market Revenues & Volume By Cartons for the Period 2022 - 2032F
- Historical Data and Forecast of Lithuania Non Alcoholic Beverages Market Revenues & Volume By Cans for the Period 2022 - 2032F
- Historical Data and Forecast of Lithuania Non Alcoholic Beverages Market Revenues & Volume By Bottles for the Period 2022 - 2032F
- Historical Data and Forecast of Lithuania Non Alcoholic Beverages Market Revenues & Volume By Others for the Period 2022 - 2032F
- Historical Data and Forecast of Lithuania Non Alcoholic Beverages Market Revenues & Volume By Distribution Channel for the Period 2022 - 2032F
- Historical Data and Forecast of Lithuania Non Alcoholic Beverages Market Revenues & Volume By Online for the Period 2022 - 2032F
- Historical Data and Forecast of Lithuania Non Alcoholic Beverages Market Revenues & Volume By Offline for the Period 2022 - 2032F
- Historical Data and Forecast of Lithuania Non Alcoholic Beverages Market Revenues & Volume By Supermarkets for the Period 2022 - 2032F
- Historical Data and Forecast of Lithuania Non Alcoholic Beverages Market Revenues & Volume By Departmental Stores for the Period 2022 - 2032F
- Historical Data and Forecast of Lithuania Non Alcoholic Beverages Market Revenues & Volume By Specialty Stores for the Period 2022 - 2032F
- Lithuania Non Alcoholic Beverages Import Export Trade Statistics
- Market Opportunity Assessment By Type
- Market Opportunity Assessment By Packaging Type
- Market Opportunity Assessment By Distribution Channel
- Lithuania Non Alcoholic Beverages Top Companies Market Share
- Lithuania Non Alcoholic Beverages Competitive Benchmarking By Technical and Operational Parameters
- Lithuania Non Alcoholic Beverages Company Profiles
- Lithuania Non Alcoholic Beverages Key Strategic Recommendations
Frequently Asked Questions About the Market Study (FAQs):
6Wresearch actively monitors the Lithuania Non Alcoholic Beverages Market and publishes its comprehensive annual report, highlighting emerging trends, growth drivers, revenue analysis, and forecast outlook. Our insights help businesses to make data-backed strategic decisions with ongoing market dynamics. Our analysts track relevent industries related to the Lithuania Non Alcoholic Beverages Market, allowing our clients with actionable intelligence and reliable forecasts tailored to emerging regional needs.
Yes, we provide customisation as per your requirements. To learn more, feel free to contact us on sales@6wresearch.com
1 Executive Summary |
2 Introduction |
2.1 Key Highlights of the Report |
2.2 Report Description |
2.3 Market Scope & Segmentation |
2.4 Research Methodology |
2.5 Assumptions |
3 Lithuania Non Alcoholic Beverages Market Overview |
3.1 Lithuania Country Macro Economic Indicators |
3.2 Lithuania Non Alcoholic Beverages Market Revenues & Volume, 2022 & 2032F |
3.3 Lithuania Non Alcoholic Beverages Market - Industry Life Cycle |
3.4 Lithuania Non Alcoholic Beverages Market - Porter's Five Forces |
3.5 Lithuania Non Alcoholic Beverages Market Revenues & Volume Share, By Type, 2022 & 2032F |
3.6 Lithuania Non Alcoholic Beverages Market Revenues & Volume Share, By Packaging Type, 2022 & 2032F |
3.7 Lithuania Non Alcoholic Beverages Market Revenues & Volume Share, By Distribution Channel, 2022 & 2032F |
4 Lithuania Non Alcoholic Beverages Market Dynamics |
4.1 Impact Analysis |
4.2 Market Drivers |
4.2.1 Increasing health consciousness among consumers leading to a shift towards healthier beverage options |
4.2.2 Growing demand for functional beverages such as energy drinks and vitamin-enhanced drinks |
4.2.3 Rising disposable income and changing lifestyles driving the consumption of premium and innovative non-alcoholic beverages |
4.3 Market Restraints |
4.3.1 Intense competition among beverage companies leading to price wars and margin pressures |
4.3.2 Fluctuating raw material prices affecting production costs and pricing strategies |
5 Lithuania Non Alcoholic Beverages Market Trends |
6 Lithuania Non Alcoholic Beverages Market Segmentations |
6.1 Lithuania Non Alcoholic Beverages Market, By Type |
6.1.1 Overview and Analysis |
6.1.2 Lithuania Non Alcoholic Beverages Market Revenues & Volume, By Alcoholic Beverages, 2022 - 2032F |
6.1.3 Lithuania Non Alcoholic Beverages Market Revenues & Volume, By Non-Alcoholic Beverages, 2022 - 2032F |
6.1.4 Lithuania Non Alcoholic Beverages Market Revenues & Volume, By Bottled Water, 2022 - 2032F |
6.1.5 Lithuania Non Alcoholic Beverages Market Revenues & Volume, By Carbonated Soft Drinks, 2022 - 2032F |
6.1.6 Lithuania Non Alcoholic Beverages Market Revenues & Volume, By Fruit Juice, 2022 - 2032F |
6.1.7 Lithuania Non Alcoholic Beverages Market Revenues & Volume, By Milk, 2022 - 2032F |
6.2 Lithuania Non Alcoholic Beverages Market, By Packaging Type |
6.2.1 Overview and Analysis |
6.2.2 Lithuania Non Alcoholic Beverages Market Revenues & Volume, By Cartons, 2022 - 2032F |
6.2.3 Lithuania Non Alcoholic Beverages Market Revenues & Volume, By Cans, 2022 - 2032F |
6.2.4 Lithuania Non Alcoholic Beverages Market Revenues & Volume, By Bottles, 2022 - 2032F |
6.2.5 Lithuania Non Alcoholic Beverages Market Revenues & Volume, By Others, 2022 - 2032F |
6.3 Lithuania Non Alcoholic Beverages Market, By Distribution Channel |
6.3.1 Overview and Analysis |
6.3.2 Lithuania Non Alcoholic Beverages Market Revenues & Volume, By Online, 2022 - 2032F |
6.3.3 Lithuania Non Alcoholic Beverages Market Revenues & Volume, By Offline, 2022 - 2032F |
6.3.4 Lithuania Non Alcoholic Beverages Market Revenues & Volume, By Supermarkets, 2022 - 2032F |
6.3.5 Lithuania Non Alcoholic Beverages Market Revenues & Volume, By Departmental Stores, 2022 - 2032F |
6.3.6 Lithuania Non Alcoholic Beverages Market Revenues & Volume, By Specialty Stores, 2022 - 2032F |
7 Lithuania Non Alcoholic Beverages Market Import-Export Trade Statistics |
7.1 Lithuania Non Alcoholic Beverages Market Export to Major Countries |
7.2 Lithuania Non Alcoholic Beverages Market Imports from Major Countries |
8 Lithuania Non Alcoholic Beverages Market Key Performance Indicators |
8.1 Consumer engagement metrics such as social media interactions, website traffic, and customer reviews indicating brand popularity and market presence |
8.2 Innovation rate, measured by the number of new product launches and improvements, reflecting the market's responsiveness to changing consumer preferences |
8.3 Sustainability metrics like packaging recyclability, carbon footprint reduction initiatives, and water usage efficiency, demonstrating a commitment to environmental responsibility and meeting consumer expectations for sustainable practices. |
9 Lithuania Non Alcoholic Beverages Market - Opportunity Assessment |
9.1 Lithuania Non Alcoholic Beverages Market Opportunity Assessment, By Type, 2022 & 2032F |
9.2 Lithuania Non Alcoholic Beverages Market Opportunity Assessment, By Packaging Type, 2022 & 2032F |
9.3 Lithuania Non Alcoholic Beverages Market Opportunity Assessment, By Distribution Channel, 2022 & 2032F |
10 Lithuania Non Alcoholic Beverages Market - Competitive Landscape |
10.1 Lithuania Non Alcoholic Beverages Market Revenue Share, By Companies, 2025 |
10.2 Lithuania Non Alcoholic Beverages Market Competitive Benchmarking, By Operating and Technical Parameters |
11 Company Profiles |
12 Recommendations | 13 Disclaimer |
Global Go To Market Strategy - 2030
Export potential enables firms to identify high-growth global markets with greater confidence by combining advanced trade intelligence with a structured quantitative methodology. The framework analyzes emerging demand trends and country-level import patterns while integrating macroeconomic and trade datasets such as GDP and population forecasts, bilateral import–export flows, tariff structures, elasticity differentials between developed and developing economies, geographic distance, and import demand projections. Using weighted trade values from 2020–2024 as the base period to project country-to-country export potential for 2030, these inputs are operationalized through calculated drivers such as gravity model parameters, tariff impact factors, and projected GDP per-capita growth. Through an analysis of hidden potentials, demand hotspots, and market conditions that are most favorable to success, this method enables firms to focus on target countries, maximize returns, and global expansion with data, backed by accuracy.
By factoring in the projected importer demand gap that is currently unmet and could be potential opportunity, it identifies the potential for the Exporter (Country) among 190 countries, against the general trade analysis, which identifies the biggest importer or exporter.
To discover high-growth global markets and optimize your business strategy:
Click Here
Pricing
- Single User License$ 1,995
- Department License$ 2,400
- Site License$ 3,120
- Global License$ 3,795

Leadership Perspectives from Industry Events
Search
Thought Leadership and Analyst Meet


Our Clients
6WResearch In News
- Doha a strategic location for EV manufacturing hub: IPA Qatar
- Demand for luxury TVs surging in the GCC, says Samsung
- Empowering Growth: The Thriving Journey of Bangladesh’s Cable Industry
- Demand for luxury TVs surging in the GCC, says Samsung
- Video call with a traditional healer? Once unthinkable, it’s now common in South Africa
- Intelligent Buildings To Smooth GCC’s Path To Net Zero
Latest Reports
- New Zealand Aseptic Manufacturing Market (2026-2032)
- Netherlands Aseptic Manufacturing Market (2026-2032)
- Nauru Aseptic Manufacturing Market (2026-2032)
- Namibia Aseptic Manufacturing Market (2026-2032)
- Mozambique Aseptic Manufacturing Market (2026-2032)
- Montenegro Aseptic Manufacturing Market (2026-2032)
- Mongolia Aseptic Manufacturing Market (2026-2032)
- Monaco Aseptic Manufacturing Market (2026-2032)
- Micronesia Aseptic Manufacturing Market (2026-2032)
- Mauritius Aseptic Manufacturing Market (2026-2032)
Industry Events and Analyst Meet

HIMTEX 2026

India Refining Summit 2026

India EV Show 2026

EV tech India Expo 2026

Auto Tech Asia 2026
Whitepaper
- Middle East & Africa Commercial Security Market Click here to view more.
- Middle East & Africa Fire Safety Systems & Equipment Market Click here to view more.
- GCC Drone Market Click here to view more.
- Middle East Lighting Fixture Market Click here to view more.
- GCC Physical & Perimeter Security Market Click here to view more.