Lithuania PC Polycarbonate Market (2026-2032) | Strategy, Segmentation, Drivers, Value, Opportunities, Pricing Analysis, Restraints, Consumer Insights, Forecast, Companies, Trends, Challenges, Industry, Analysis, Segments, Competition, Demand, Strategic Insights, Revenue, Investment Trends, Growth, Outlook, Size, Competitive, Supply, Share
Market Forecast By Type (General-Purpose PC, Flame-Retardant PC, Optical-Grade PC, Weather-Resistant PC, Anti-Static PC), By Application (Automotive Components, Electronic Housings, Optical Lenses, Roofing Sheets, Industrial Equipment), By End User (Automotive, Electronics, Healthcare, Construction, Industrial), By Properties (High Durability, Heat Resistance, UV Resistance, Impact Resistance, Chemical Resistance), By Manufacturing Process (Extrusion Molding, Injection Molding, Blow Molding, Thermoforming, Compression Molding) And Competitive Landscape
| Product Code: ETC10754298 | Publication Date: Apr 2025 | Updated Date: Apr 2026 | Product Type: Market Research Report | |
| Publisher: 6Wresearch | No. of Pages: 65 | No. of Figures: 34 | No. of Tables: 19 | |
Lithuania Pc Polycarbonate Market Size (2020-2030)
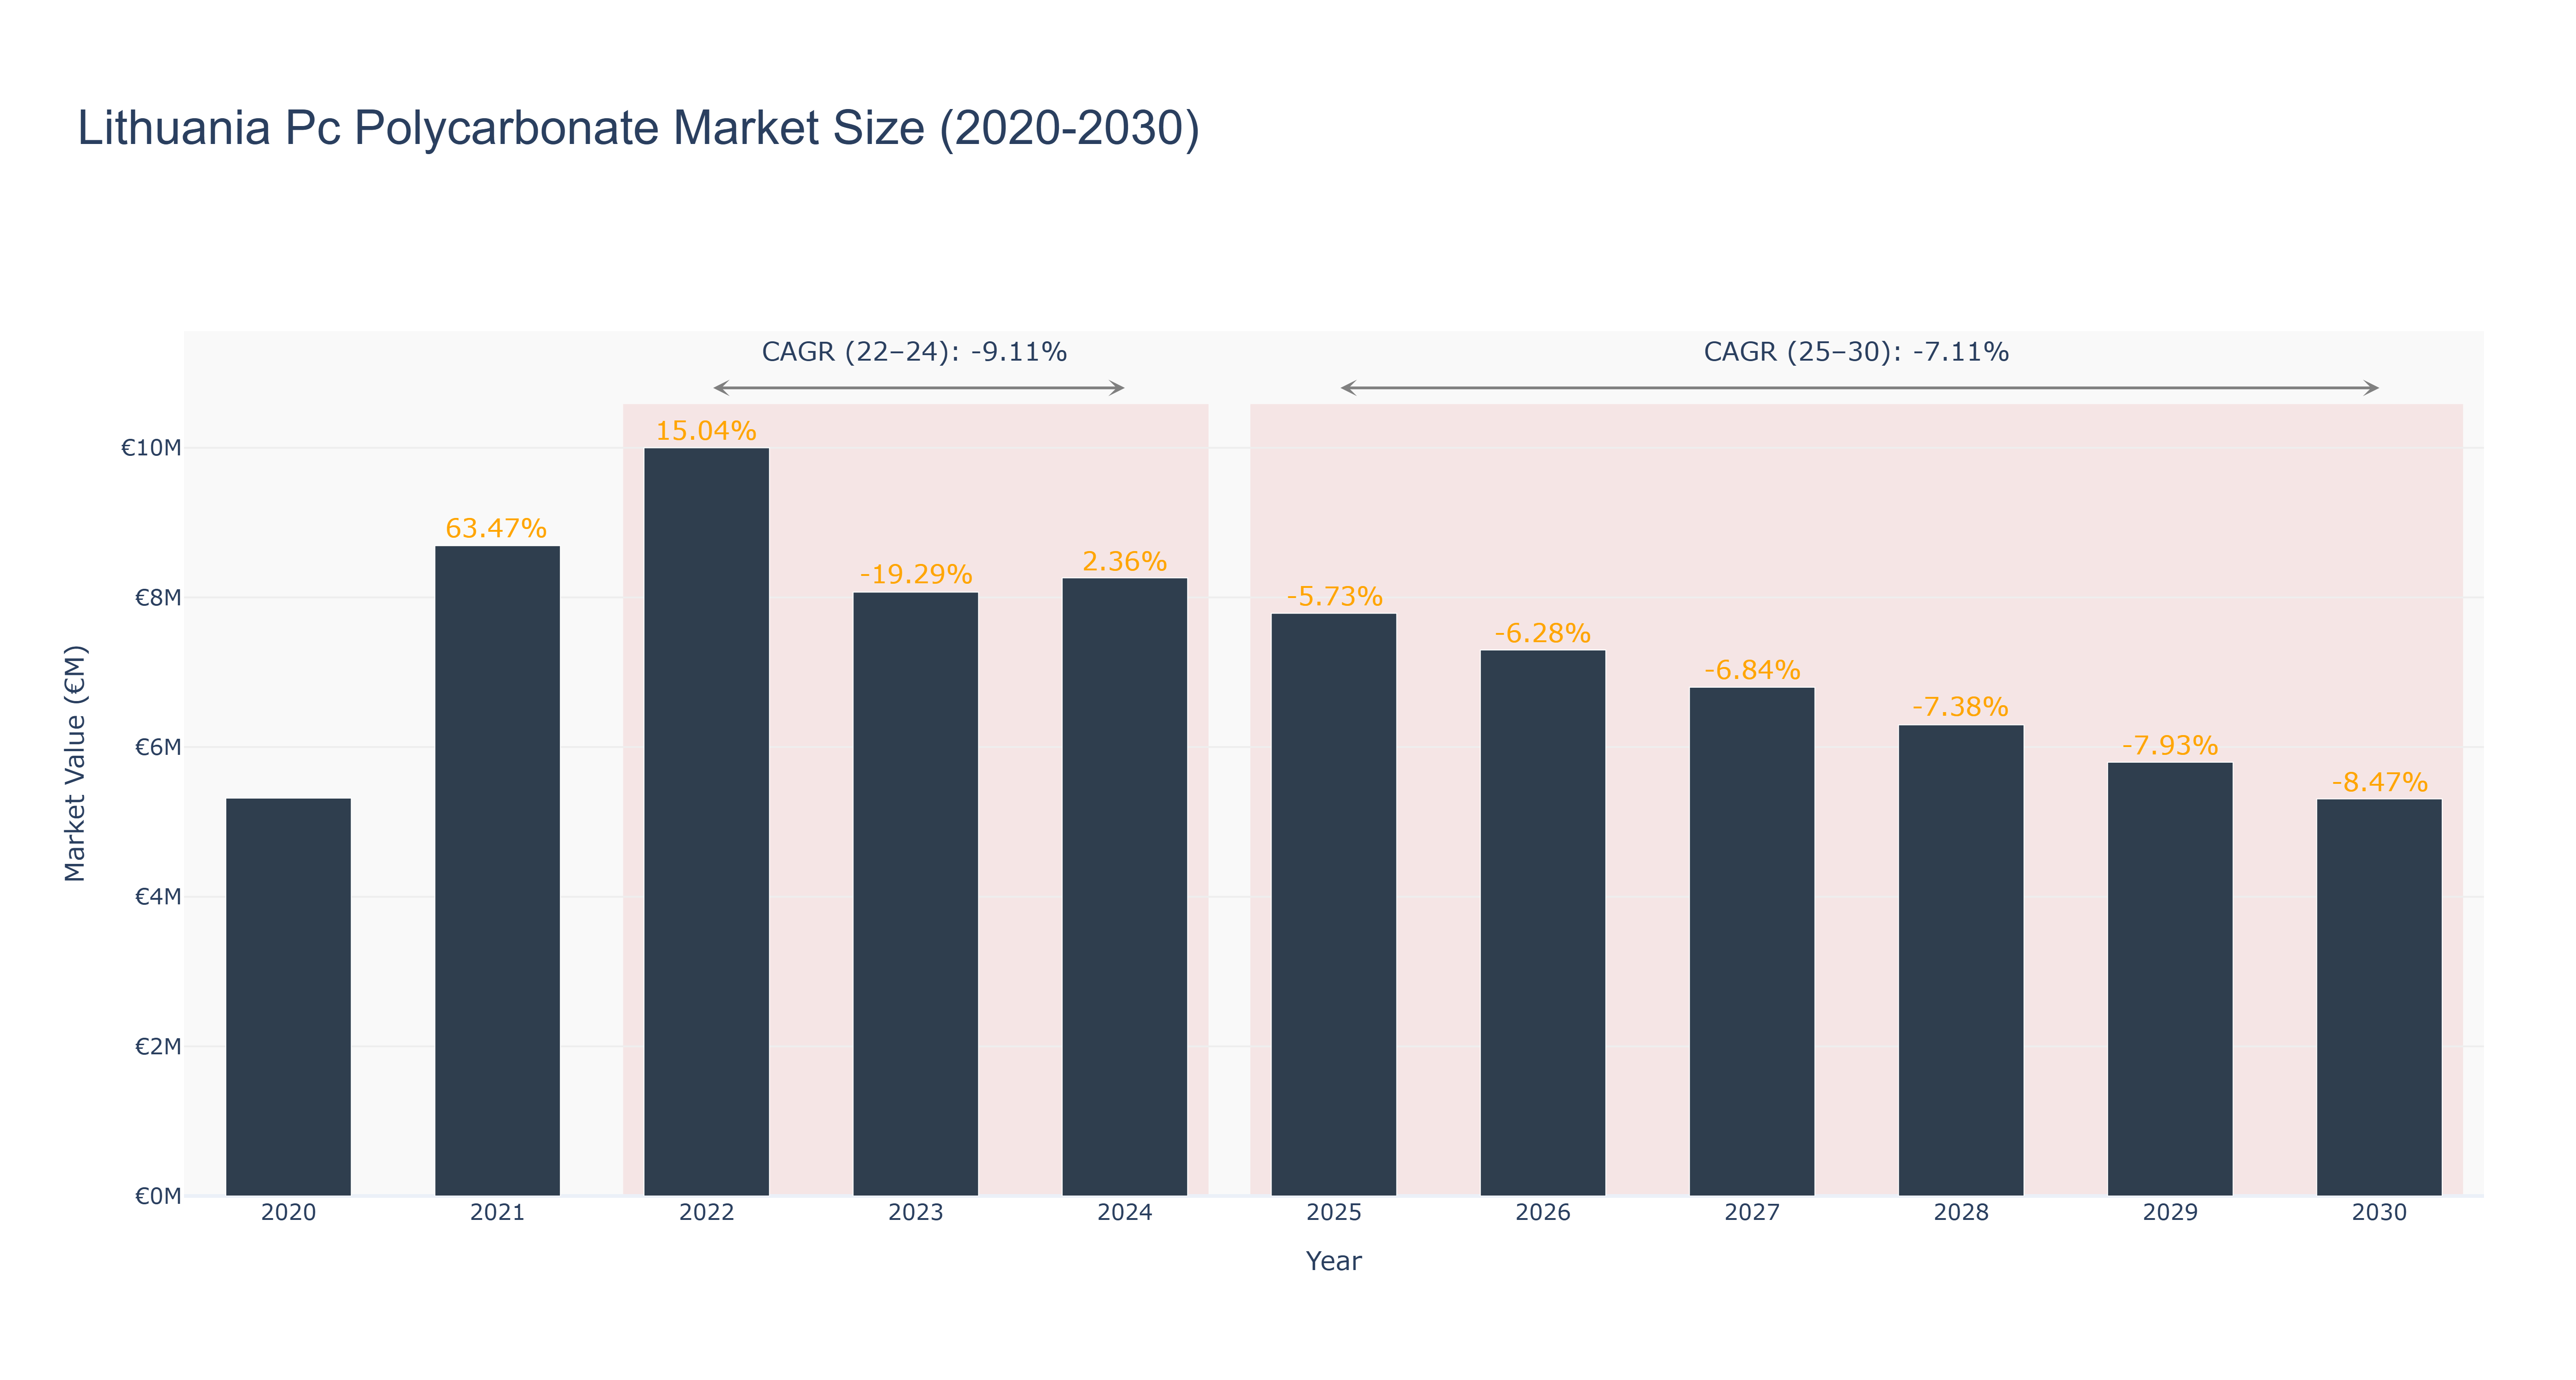
The Lithuania PC Polycarbonate Market experienced significant growth in 2021, reaching a peak market size of €10.00 million in 2022, following a remarkable 63.47% increase from the previous year. However, this period of expansion was short-lived, as the market size declined to €8.26 million in 2024, reflecting a negative CAGR of -9.11% from 2022 to 2024. The forecasted outlook from 2025 to 2030 indicates a continued downward trend, with projected market sizes decreasing to €5.31 million by 2030 and a CAGR of -7.11%. This decline can be attributed to various factors, including increased competition, shifts in consumer preferences, and potential economic downturns affecting demand. While there are no specific upcoming projects highlighted for this market segment, broader industry trends toward sustainability and alternative materials may influence future dynamics in the PC polycarbonate sector in Lithuania.
Lithuania Pc Polycarbonate Market: Production & Trade Performance (2019-2025)
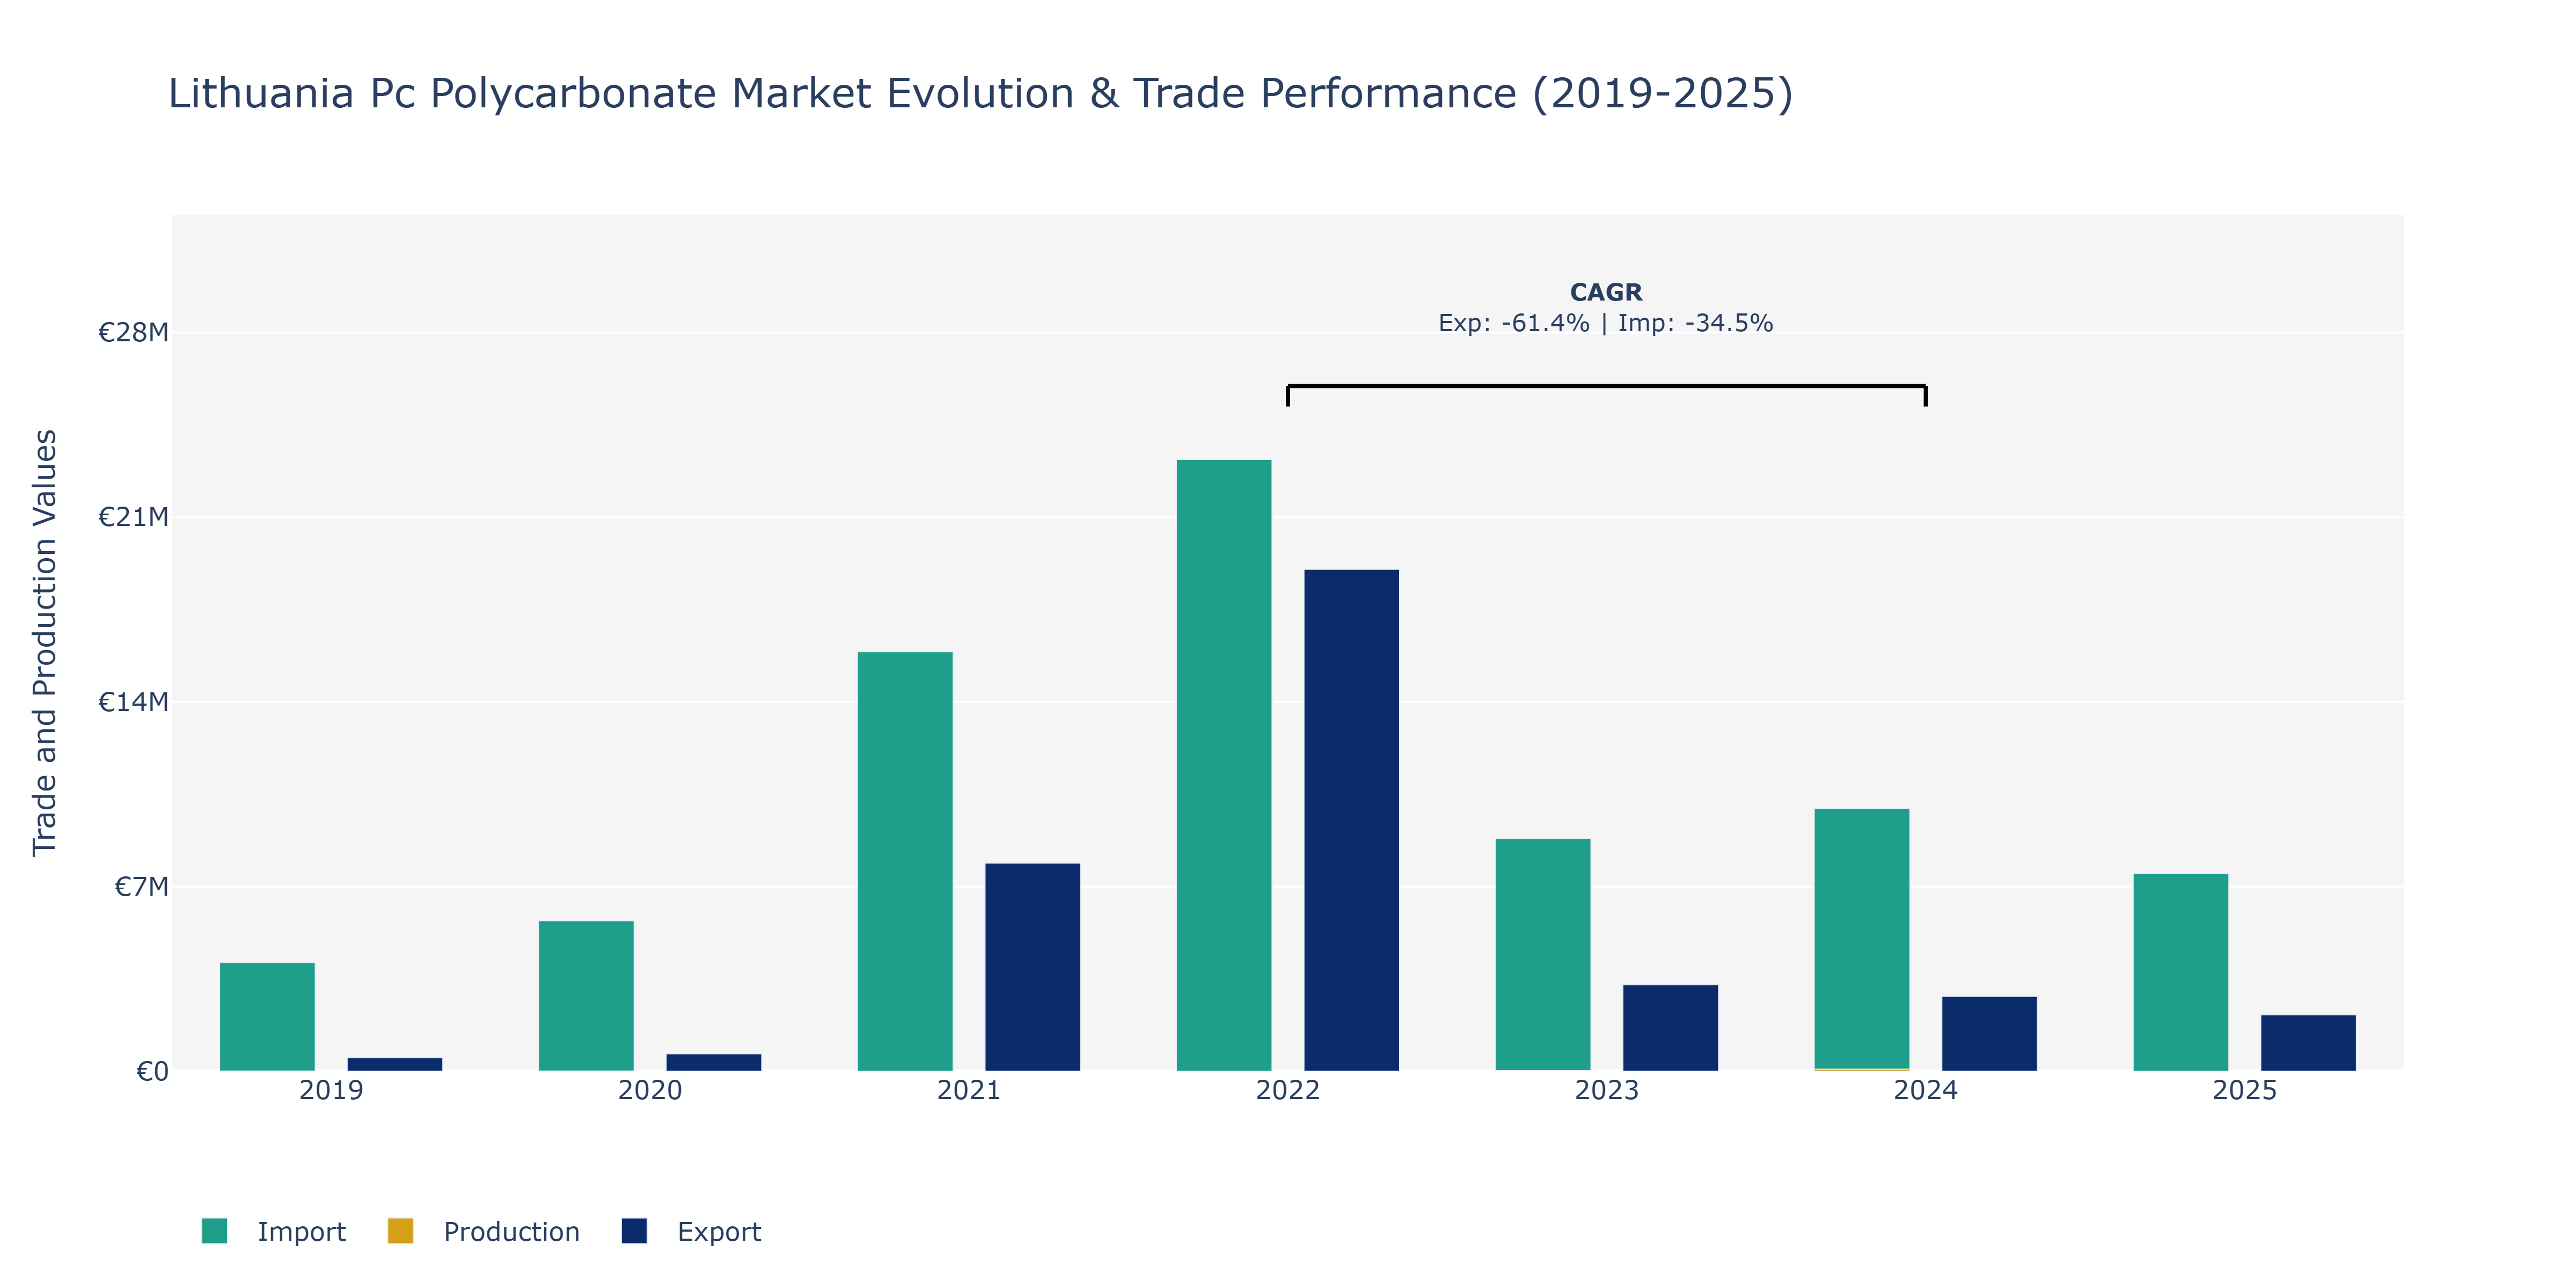
In the Lithuania Pc Polycarbonate Market, exports showed a notable fluctuation over the years, starting at €509.34 thousand in 2019, then surging to €19.02 million in 2022 before declining sharply to €3.27 million in 2023 and further dropping to €2.84 million in 2024. Imports followed a similar pattern, increasing from €4.13 million in 2019 to €23.19 million in 2022, then decreasing to €8.82 million in 2023 and €9.96 million in 2024. Production, on the other hand, displayed a contrasting trend, starting at €5.14 million in 2019, dropping to €1 million in 2021, before experiencing a substantial rise to €23 million in 2023 and peaking at €77 million in 2024. The fluctuations in exports and imports can be attributed to changing global demand, supply chain disruptions, and economic conditions influencing trade patterns within the industry. The peak in production could be influenced by technological advancements, increased capacity, and growing domestic demand for polycarbonate products, reflecting strategic growth initiatives within the market.
Key Highlights of the Report:
- Lithuania PC Polycarbonate Market Outlook
- Market Size of Lithuania PC Polycarbonate Market, 2025
- Forecast of Lithuania PC Polycarbonate Market, 2032
- Historical Data and Forecast of Lithuania PC Polycarbonate Revenues & Volume for the Period 2022 - 2032F
- Lithuania PC Polycarbonate Market Trend Evolution
- Lithuania PC Polycarbonate Market Drivers and Challenges
- Lithuania PC Polycarbonate Price Trends
- Lithuania PC Polycarbonate Porter's Five Forces
- Lithuania PC Polycarbonate Industry Life Cycle
- Historical Data and Forecast of Lithuania PC Polycarbonate Market Revenues & Volume By Type for the Period 2022 - 2032F
- Historical Data and Forecast of Lithuania PC Polycarbonate Market Revenues & Volume By General-Purpose PC for the Period 2022 - 2032F
- Historical Data and Forecast of Lithuania PC Polycarbonate Market Revenues & Volume By Flame-Retardant PC for the Period 2022 - 2032F
- Historical Data and Forecast of Lithuania PC Polycarbonate Market Revenues & Volume By Optical-Grade PC for the Period 2022 - 2032F
- Historical Data and Forecast of Lithuania PC Polycarbonate Market Revenues & Volume By Weather-Resistant PC for the Period 2022 - 2032F
- Historical Data and Forecast of Lithuania PC Polycarbonate Market Revenues & Volume By Anti-Static PC for the Period 2022 - 2032F
- Historical Data and Forecast of Lithuania PC Polycarbonate Market Revenues & Volume By Application for the Period 2022 - 2032F
- Historical Data and Forecast of Lithuania PC Polycarbonate Market Revenues & Volume By Automotive Components for the Period 2022 - 2032F
- Historical Data and Forecast of Lithuania PC Polycarbonate Market Revenues & Volume By Electronic Housings for the Period 2022 - 2032F
- Historical Data and Forecast of Lithuania PC Polycarbonate Market Revenues & Volume By Optical Lenses for the Period 2022 - 2032F
- Historical Data and Forecast of Lithuania PC Polycarbonate Market Revenues & Volume By Roofing Sheets for the Period 2022 - 2032F
- Historical Data and Forecast of Lithuania PC Polycarbonate Market Revenues & Volume By Industrial Equipment for the Period 2022 - 2032F
- Historical Data and Forecast of Lithuania PC Polycarbonate Market Revenues & Volume By End User for the Period 2022 - 2032F
- Historical Data and Forecast of Lithuania PC Polycarbonate Market Revenues & Volume By Automotive for the Period 2022 - 2032F
- Historical Data and Forecast of Lithuania PC Polycarbonate Market Revenues & Volume By Electronics for the Period 2022 - 2032F
- Historical Data and Forecast of Lithuania PC Polycarbonate Market Revenues & Volume By Healthcare for the Period 2022 - 2032F
- Historical Data and Forecast of Lithuania PC Polycarbonate Market Revenues & Volume By Construction for the Period 2022 - 2032F
- Historical Data and Forecast of Lithuania PC Polycarbonate Market Revenues & Volume By Industrial for the Period 2022 - 2032F
- Historical Data and Forecast of Lithuania PC Polycarbonate Market Revenues & Volume By Properties for the Period 2022 - 2032F
- Historical Data and Forecast of Lithuania PC Polycarbonate Market Revenues & Volume By High Durability for the Period 2022 - 2032F
- Historical Data and Forecast of Lithuania PC Polycarbonate Market Revenues & Volume By Heat Resistance for the Period 2022 - 2032F
- Historical Data and Forecast of Lithuania PC Polycarbonate Market Revenues & Volume By UV Resistance for the Period 2022 - 2032F
- Historical Data and Forecast of Lithuania PC Polycarbonate Market Revenues & Volume By Impact Resistance for the Period 2022 - 2032F
- Historical Data and Forecast of Lithuania PC Polycarbonate Market Revenues & Volume By Chemical Resistance for the Period 2022 - 2032F
- Historical Data and Forecast of Lithuania PC Polycarbonate Market Revenues & Volume By Manufacturing Process for the Period 2022 - 2032F
- Historical Data and Forecast of Lithuania PC Polycarbonate Market Revenues & Volume By Extrusion Molding for the Period 2022 - 2032F
- Historical Data and Forecast of Lithuania PC Polycarbonate Market Revenues & Volume By Injection Molding for the Period 2022 - 2032F
- Historical Data and Forecast of Lithuania PC Polycarbonate Market Revenues & Volume By Blow Molding for the Period 2022 - 2032F
- Historical Data and Forecast of Lithuania PC Polycarbonate Market Revenues & Volume By Thermoforming for the Period 2022 - 2032F
- Historical Data and Forecast of Lithuania PC Polycarbonate Market Revenues & Volume By Compression Molding for the Period 2022 - 2032F
- Lithuania PC Polycarbonate Import Export Trade Statistics
- Market Opportunity Assessment By Type
- Market Opportunity Assessment By Application
- Market Opportunity Assessment By End User
- Market Opportunity Assessment By Properties
- Market Opportunity Assessment By Manufacturing Process
- Lithuania PC Polycarbonate Top Companies Market Share
- Lithuania PC Polycarbonate Competitive Benchmarking By Technical and Operational Parameters
- Lithuania PC Polycarbonate Company Profiles
- Lithuania PC Polycarbonate Key Strategic Recommendations
Frequently Asked Questions About the Market Study (FAQs):
6Wresearch actively monitors the Lithuania PC Polycarbonate Market and publishes its comprehensive annual report, highlighting emerging trends, growth drivers, revenue analysis, and forecast outlook. Our insights help businesses to make data-backed strategic decisions with ongoing market dynamics. Our analysts track relevent industries related to the Lithuania PC Polycarbonate Market, allowing our clients with actionable intelligence and reliable forecasts tailored to emerging regional needs.
Yes, we provide customisation as per your requirements. To learn more, feel free to contact us on sales@6wresearch.com
1 Executive Summary |
2 Introduction |
2.1 Key Highlights of the Report |
2.2 Report Description |
2.3 Market Scope & Segmentation |
2.4 Research Methodology |
2.5 Assumptions |
3 Lithuania PC Polycarbonate Market Overview |
3.1 Lithuania Country Macro Economic Indicators |
3.2 Lithuania PC Polycarbonate Market Revenues & Volume, 2022 & 2032F |
3.3 Lithuania PC Polycarbonate Market - Industry Life Cycle |
3.4 Lithuania PC Polycarbonate Market - Porter's Five Forces |
3.5 Lithuania PC Polycarbonate Market Revenues & Volume Share, By Type, 2022 & 2032F |
3.6 Lithuania PC Polycarbonate Market Revenues & Volume Share, By Application, 2022 & 2032F |
3.7 Lithuania PC Polycarbonate Market Revenues & Volume Share, By End User, 2022 & 2032F |
3.8 Lithuania PC Polycarbonate Market Revenues & Volume Share, By Properties, 2022 & 2032F |
3.9 Lithuania PC Polycarbonate Market Revenues & Volume Share, By Manufacturing Process, 2022 & 2032F |
4 Lithuania PC Polycarbonate Market Dynamics |
4.1 Impact Analysis |
4.2 Market Drivers |
4.3 Market Restraints |
5 Lithuania PC Polycarbonate Market Trends |
6 Lithuania PC Polycarbonate Market, By Types |
6.1 Lithuania PC Polycarbonate Market, By Type |
6.1.1 Overview and Analysis |
6.1.2 Lithuania PC Polycarbonate Market Revenues & Volume, By Type, 2022 - 2032F |
6.1.3 Lithuania PC Polycarbonate Market Revenues & Volume, By General-Purpose PC, 2022 - 2032F |
6.1.4 Lithuania PC Polycarbonate Market Revenues & Volume, By Flame-Retardant PC, 2022 - 2032F |
6.1.5 Lithuania PC Polycarbonate Market Revenues & Volume, By Optical-Grade PC, 2022 - 2032F |
6.1.6 Lithuania PC Polycarbonate Market Revenues & Volume, By Weather-Resistant PC, 2022 - 2032F |
6.1.7 Lithuania PC Polycarbonate Market Revenues & Volume, By Anti-Static PC, 2022 - 2032F |
6.2 Lithuania PC Polycarbonate Market, By Application |
6.2.1 Overview and Analysis |
6.2.2 Lithuania PC Polycarbonate Market Revenues & Volume, By Automotive Components, 2022 - 2032F |
6.2.3 Lithuania PC Polycarbonate Market Revenues & Volume, By Electronic Housings, 2022 - 2032F |
6.2.4 Lithuania PC Polycarbonate Market Revenues & Volume, By Optical Lenses, 2022 - 2032F |
6.2.5 Lithuania PC Polycarbonate Market Revenues & Volume, By Roofing Sheets, 2022 - 2032F |
6.2.6 Lithuania PC Polycarbonate Market Revenues & Volume, By Industrial Equipment, 2022 - 2032F |
6.3 Lithuania PC Polycarbonate Market, By End User |
6.3.1 Overview and Analysis |
6.3.2 Lithuania PC Polycarbonate Market Revenues & Volume, By Automotive, 2022 - 2032F |
6.3.3 Lithuania PC Polycarbonate Market Revenues & Volume, By Electronics, 2022 - 2032F |
6.3.4 Lithuania PC Polycarbonate Market Revenues & Volume, By Healthcare, 2022 - 2032F |
6.3.5 Lithuania PC Polycarbonate Market Revenues & Volume, By Construction, 2022 - 2032F |
6.3.6 Lithuania PC Polycarbonate Market Revenues & Volume, By Industrial, 2022 - 2032F |
6.4 Lithuania PC Polycarbonate Market, By Properties |
6.4.1 Overview and Analysis |
6.4.2 Lithuania PC Polycarbonate Market Revenues & Volume, By High Durability, 2022 - 2032F |
6.4.3 Lithuania PC Polycarbonate Market Revenues & Volume, By Heat Resistance, 2022 - 2032F |
6.4.4 Lithuania PC Polycarbonate Market Revenues & Volume, By UV Resistance, 2022 - 2032F |
6.4.5 Lithuania PC Polycarbonate Market Revenues & Volume, By Impact Resistance, 2022 - 2032F |
6.4.6 Lithuania PC Polycarbonate Market Revenues & Volume, By Chemical Resistance, 2022 - 2032F |
6.5 Lithuania PC Polycarbonate Market, By Manufacturing Process |
6.5.1 Overview and Analysis |
6.5.2 Lithuania PC Polycarbonate Market Revenues & Volume, By Extrusion Molding, 2022 - 2032F |
6.5.3 Lithuania PC Polycarbonate Market Revenues & Volume, By Injection Molding, 2022 - 2032F |
6.5.4 Lithuania PC Polycarbonate Market Revenues & Volume, By Blow Molding, 2022 - 2032F |
6.5.5 Lithuania PC Polycarbonate Market Revenues & Volume, By Thermoforming, 2022 - 2032F |
6.5.6 Lithuania PC Polycarbonate Market Revenues & Volume, By Compression Molding, 2022 - 2032F |
7 Lithuania PC Polycarbonate Market Import-Export Trade Statistics |
7.1 Lithuania PC Polycarbonate Market Export to Major Countries |
7.2 Lithuania PC Polycarbonate Market Imports from Major Countries |
8 Lithuania PC Polycarbonate Market Key Performance Indicators |
9 Lithuania PC Polycarbonate Market - Opportunity Assessment |
9.1 Lithuania PC Polycarbonate Market Opportunity Assessment, By Type, 2022 & 2032F |
9.2 Lithuania PC Polycarbonate Market Opportunity Assessment, By Application, 2022 & 2032F |
9.3 Lithuania PC Polycarbonate Market Opportunity Assessment, By End User, 2022 & 2032F |
9.4 Lithuania PC Polycarbonate Market Opportunity Assessment, By Properties, 2022 & 2032F |
9.5 Lithuania PC Polycarbonate Market Opportunity Assessment, By Manufacturing Process, 2022 & 2032F |
10 Lithuania PC Polycarbonate Market - Competitive Landscape |
10.1 Lithuania PC Polycarbonate Market Revenue Share, By Companies, 2025 |
10.2 Lithuania PC Polycarbonate Market Competitive Benchmarking, By Operating and Technical Parameters |
11 Company Profiles |
12 Recommendations |
13 Disclaimer |
Export potential assessment - trade Analytics for 2030
Export potential enables firms to identify high-growth global markets with greater confidence by combining advanced trade intelligence with a structured quantitative methodology. The framework analyzes emerging demand trends and country-level import patterns while integrating macroeconomic and trade datasets such as GDP and population forecasts, bilateral import–export flows, tariff structures, elasticity differentials between developed and developing economies, geographic distance, and import demand projections. Using weighted trade values from 2020–2024 as the base period to project country-to-country export potential for 2030, these inputs are operationalized through calculated drivers such as gravity model parameters, tariff impact factors, and projected GDP per-capita growth. Through an analysis of hidden potentials, demand hotspots, and market conditions that are most favorable to success, this method enables firms to focus on target countries, maximize returns, and global expansion with data, backed by accuracy.
By factoring in the projected importer demand gap that is currently unmet and could be potential opportunity, it identifies the potential for the Exporter (Country) among 190 countries, against the general trade analysis, which identifies the biggest importer or exporter.
To discover high-growth global markets and optimize your business strategy:
Click Here
Pricing
- Single User License$ 1,995
- Department License$ 2,400
- Site License$ 3,120
- Global License$ 3,795

Search
Thought Leadership and Analyst Meet


Our Clients
Latest Reports
- France Thermally Conductive Filler Dispersants Market (2026-2032) | Challenges, Restraints, Value, Share, Size, segmentation, Analysis, Trends, Investment Opportunities, Outlook, Pricing, Demand, Forecast, Revenue, Companies, Growth, Drivers, Strategy, Insights, Competition
- Egypt Thermally Conductive Filler Dispersants Market (2026-2032) | Competition, Forecast, Strategy, Value, Insights, Outlook, Investment Opportunities, Pricing, Demand, Share, segmentation, Drivers, Size, Companies, Restraints, Growth, Trends, Revenue, Challenges, Analysis
- Czech Republic Thermally Conductive Filler Dispersants Market (2026-2032) | Forecast, Pricing, Analysis, Drivers, Insights, Size, Demand, Growth, Challenges, segmentation, Competition, Outlook, Trends, Investment Opportunities, Companies, Strategy, Revenue, Share, Value, Restraints
- Colombia Thermally Conductive Filler Dispersants Market (2026-2032) | segmentation, Trends, Share, Drivers, Strategy, Companies, Demand, Insights, Size, Challenges, Value, Competition, Analysis, Growth, Revenue, Restraints, Forecast, Pricing, Outlook, Investment Opportunities
- China Thermally Conductive Filler Dispersants Market (2026-2032) | Restraints, Investment Opportunities, Pricing, Companies, Share, Size, Challenges, Trends, Outlook, Value, Analysis, Competition, Revenue, Drivers, Forecast, Demand, Insights, Growth, Strategy, segmentation
- Chile Thermally Conductive Filler Dispersants Market (2026-2032) | Investment Opportunities, Trends, Value, Restraints, Share, Companies, Forecast, segmentation, Pricing, Challenges, Demand, Size, Analysis, Drivers, Outlook, Growth, Competition, Strategy, Revenue, Insights
- Cambodia Thermally Conductive Filler Dispersants Market (2026-2032) | Analysis, Share, Outlook, Strategy, Pricing, Demand, Size, Growth, segmentation, Insights, Revenue, Forecast, Challenges, Competition, Companies, Investment Opportunities, Trends, Restraints, Value, Drivers
- Brazil Thermally Conductive Filler Dispersants Market (2026-2032) | Restraints, Forecast, Competition, Size, Revenue, Value, Investment Opportunities, Trends, Insights, Outlook, Growth, Analysis, Drivers, segmentation, Pricing, Challenges, Strategy, Share, Companies, Demand
- Bangladesh Thermally Conductive Filler Dispersants Market (2026-2032) | Restraints, Trends, Analysis, Competition, Insights, Forecast, Value, Investment Opportunities, Pricing, Share, Demand, Outlook, Revenue, segmentation, Companies, Drivers, Growth, Size, Challenges, Strategy
- Bahrain Thermally Conductive Filler Dispersants Market (2026-2032) | Trends, Outlook, Pricing, Demand, Value, Competition, Forecast, Growth, segmentation, Revenue, Companies, Analysis, Insights, Size, Drivers, Challenges, Strategy, Investment Opportunities, Share, Restraints
Industry Events and Analyst Meet

HIMTEX 2026

India Refining Summit 2026

India EV Show 2026

EV tech India Expo 2026

Auto Tech Asia 2026
Whitepaper
- Middle East & Africa Commercial Security Market Click here to view more.
- Middle East & Africa Fire Safety Systems & Equipment Market Click here to view more.
- GCC Drone Market Click here to view more.
- Middle East Lighting Fixture Market Click here to view more.
- GCC Physical & Perimeter Security Market Click here to view more.
6WResearch In News
- Doha a strategic location for EV manufacturing hub: IPA Qatar
- Demand for luxury TVs surging in the GCC, says Samsung
- Empowering Growth: The Thriving Journey of Bangladesh’s Cable Industry
- Demand for luxury TVs surging in the GCC, says Samsung
- Video call with a traditional healer? Once unthinkable, it’s now common in South Africa
- Intelligent Buildings To Smooth GCC’s Path To Net Zero