Lithuania Pedometers Market (2026-2032) | Analysis, Forecast, Value, Trends, Companies, Segmentation, Industry, Outlook, Growth, Revenue, Size & Share
Market Forecast By Product Type (Piezoelectric pedometer, Spring-levered pedometer), By Distribution Channel (e-commerce, Retail stores, Supermarket, Others) And Competitive Landscape
| Product Code: ETC4762789 | Publication Date: Nov 2023 | Updated Date: Apr 2026 | Product Type: Market Research Report | |
| Publisher: 6Wresearch | Author: Shubham Padhi | No. of Pages: 60 | No. of Figures: 30 | No. of Tables: 5 |
Lithuania Pedometers Market Size (2020-2030)
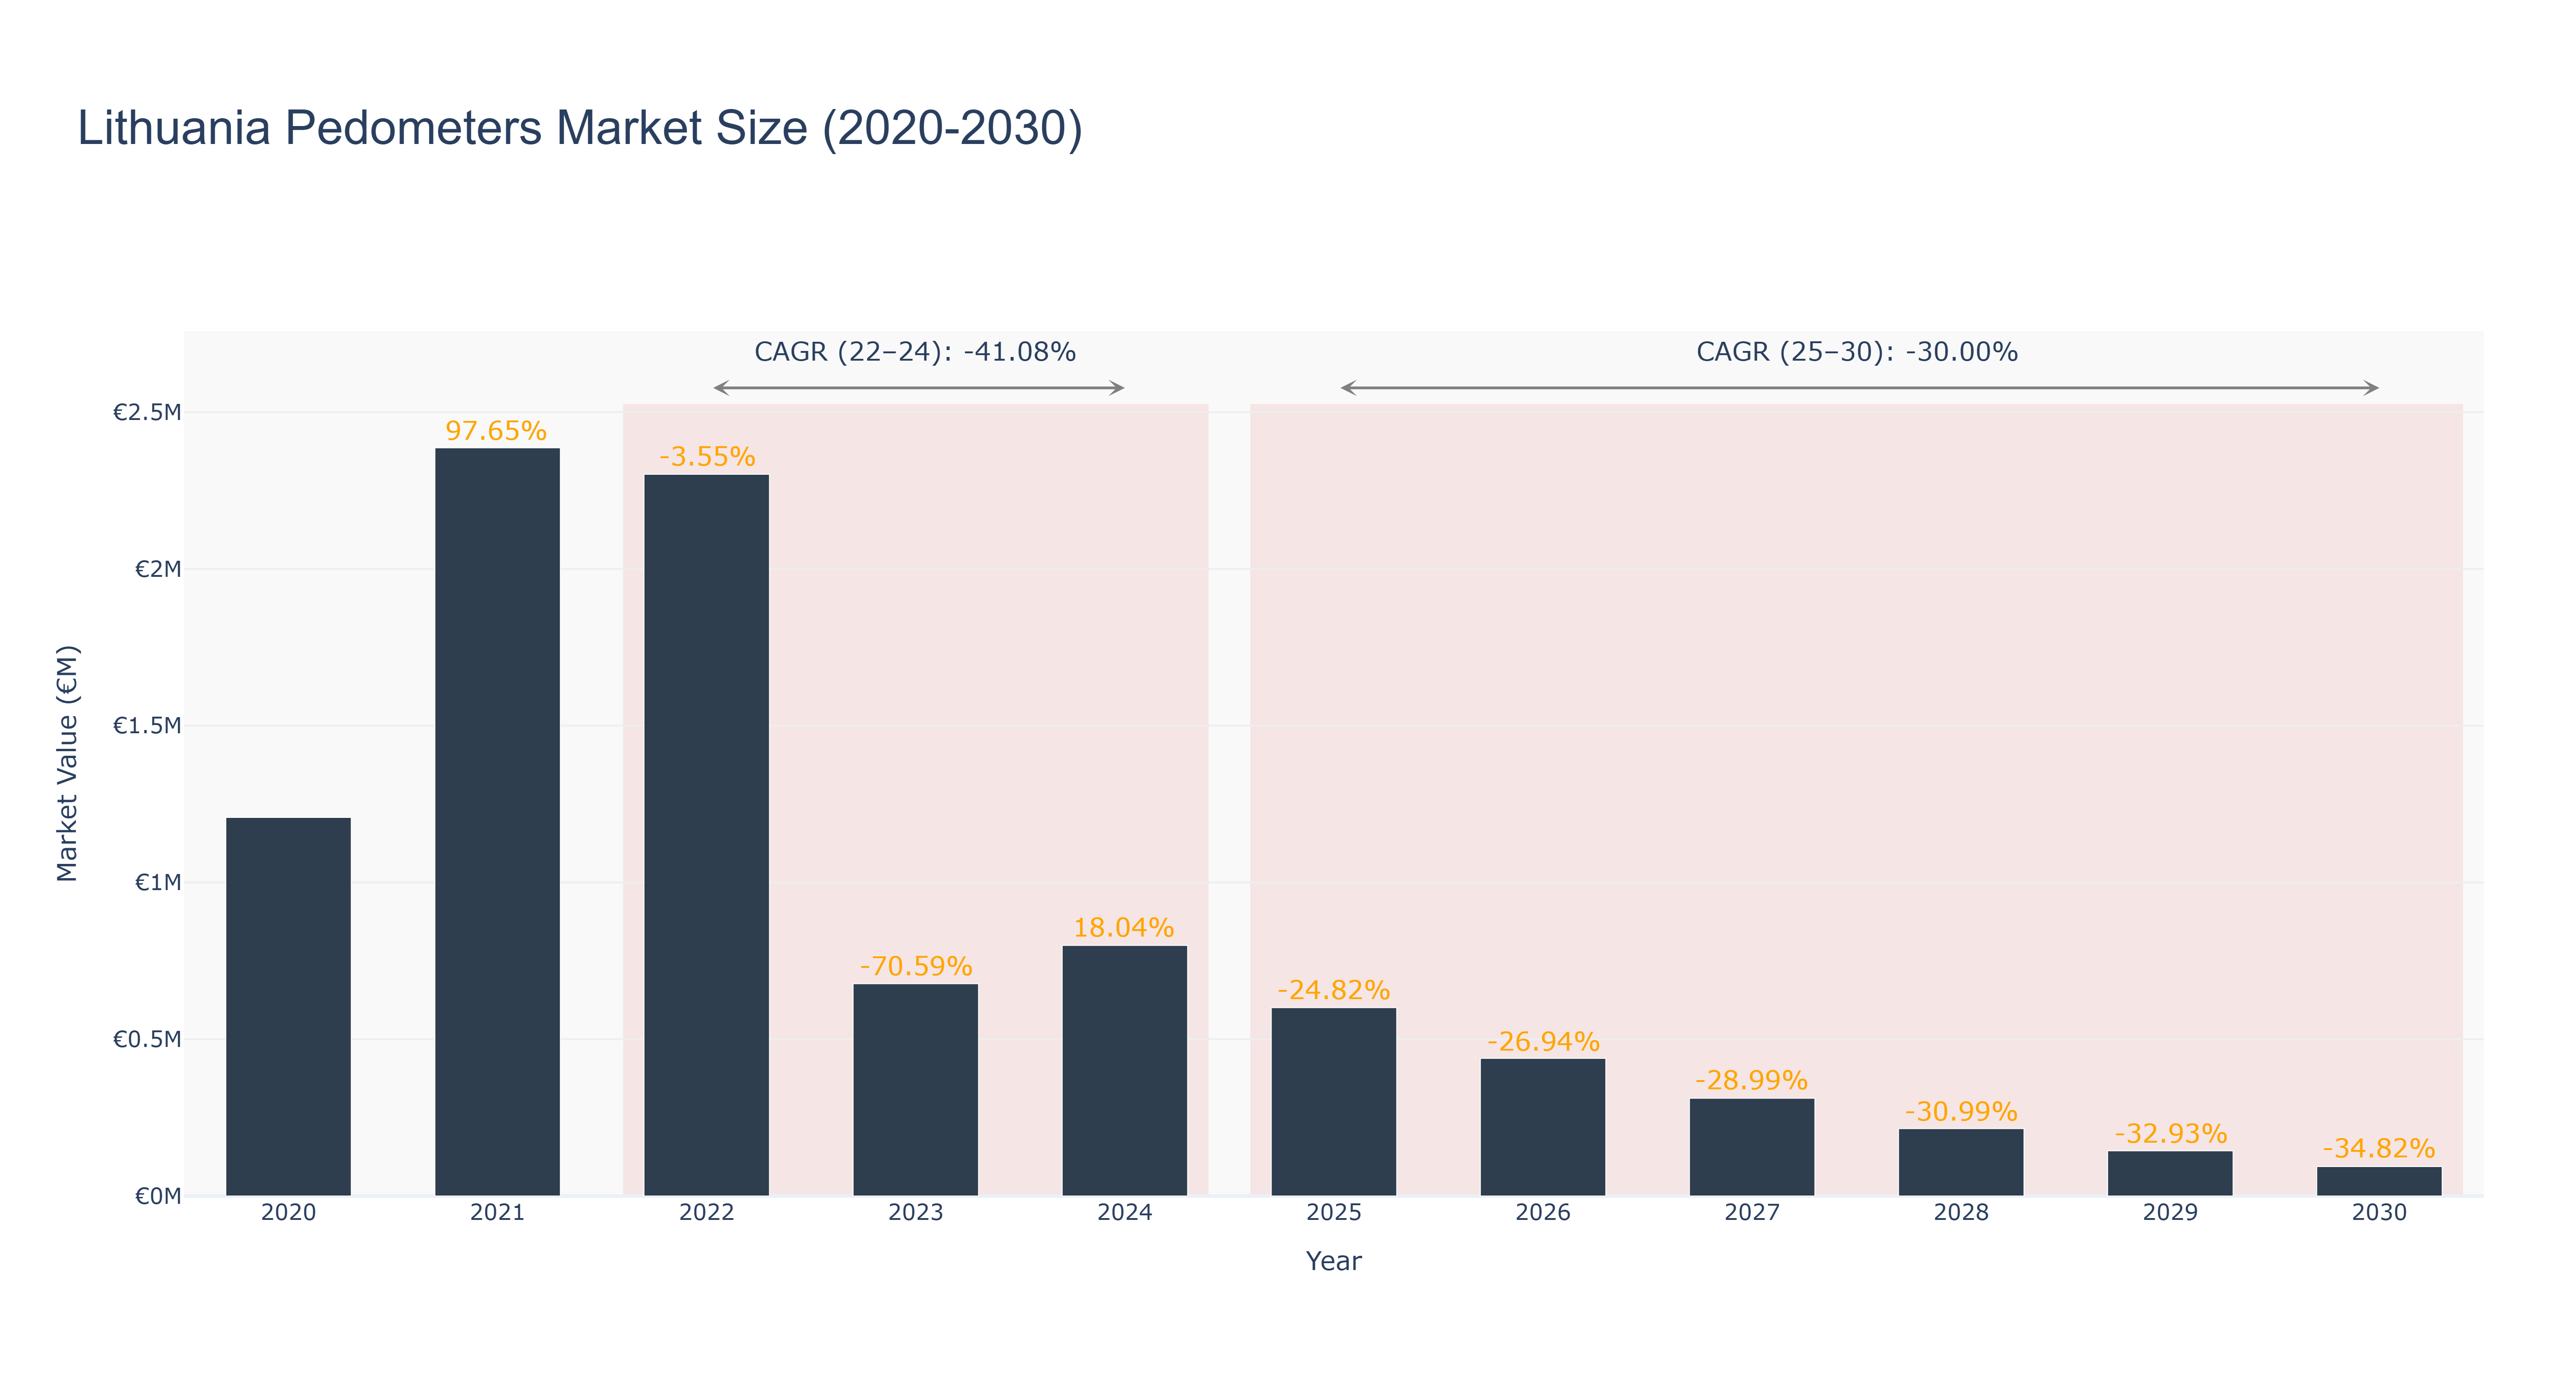
The Lithuania Pedometers Market experienced a peak size of €2.39 million in 2021, followed by a sharp decline to €0.80 million in 2024. The market is forecasted to continue shrinking, reaching €0.09 million by 2030, with a CAGR of -30.0% from 2025 to 2030. The significant drop in market size can be attributed to changing consumer preferences towards more advanced wearable technologies and a saturated market with limited innovation in pedometer devices. To revitalize the market, industry players are focusing on developing integrated health tracking solutions that offer a wider range of features beyond basic step counting. Collaborations with healthcare providers to promote wellness programs and personalized coaching services are also in the pipeline to attract a broader consumer base and drive market growth in the coming years.
Lithuania Pedometers Market: Production & Trade Performance (2019-2025)
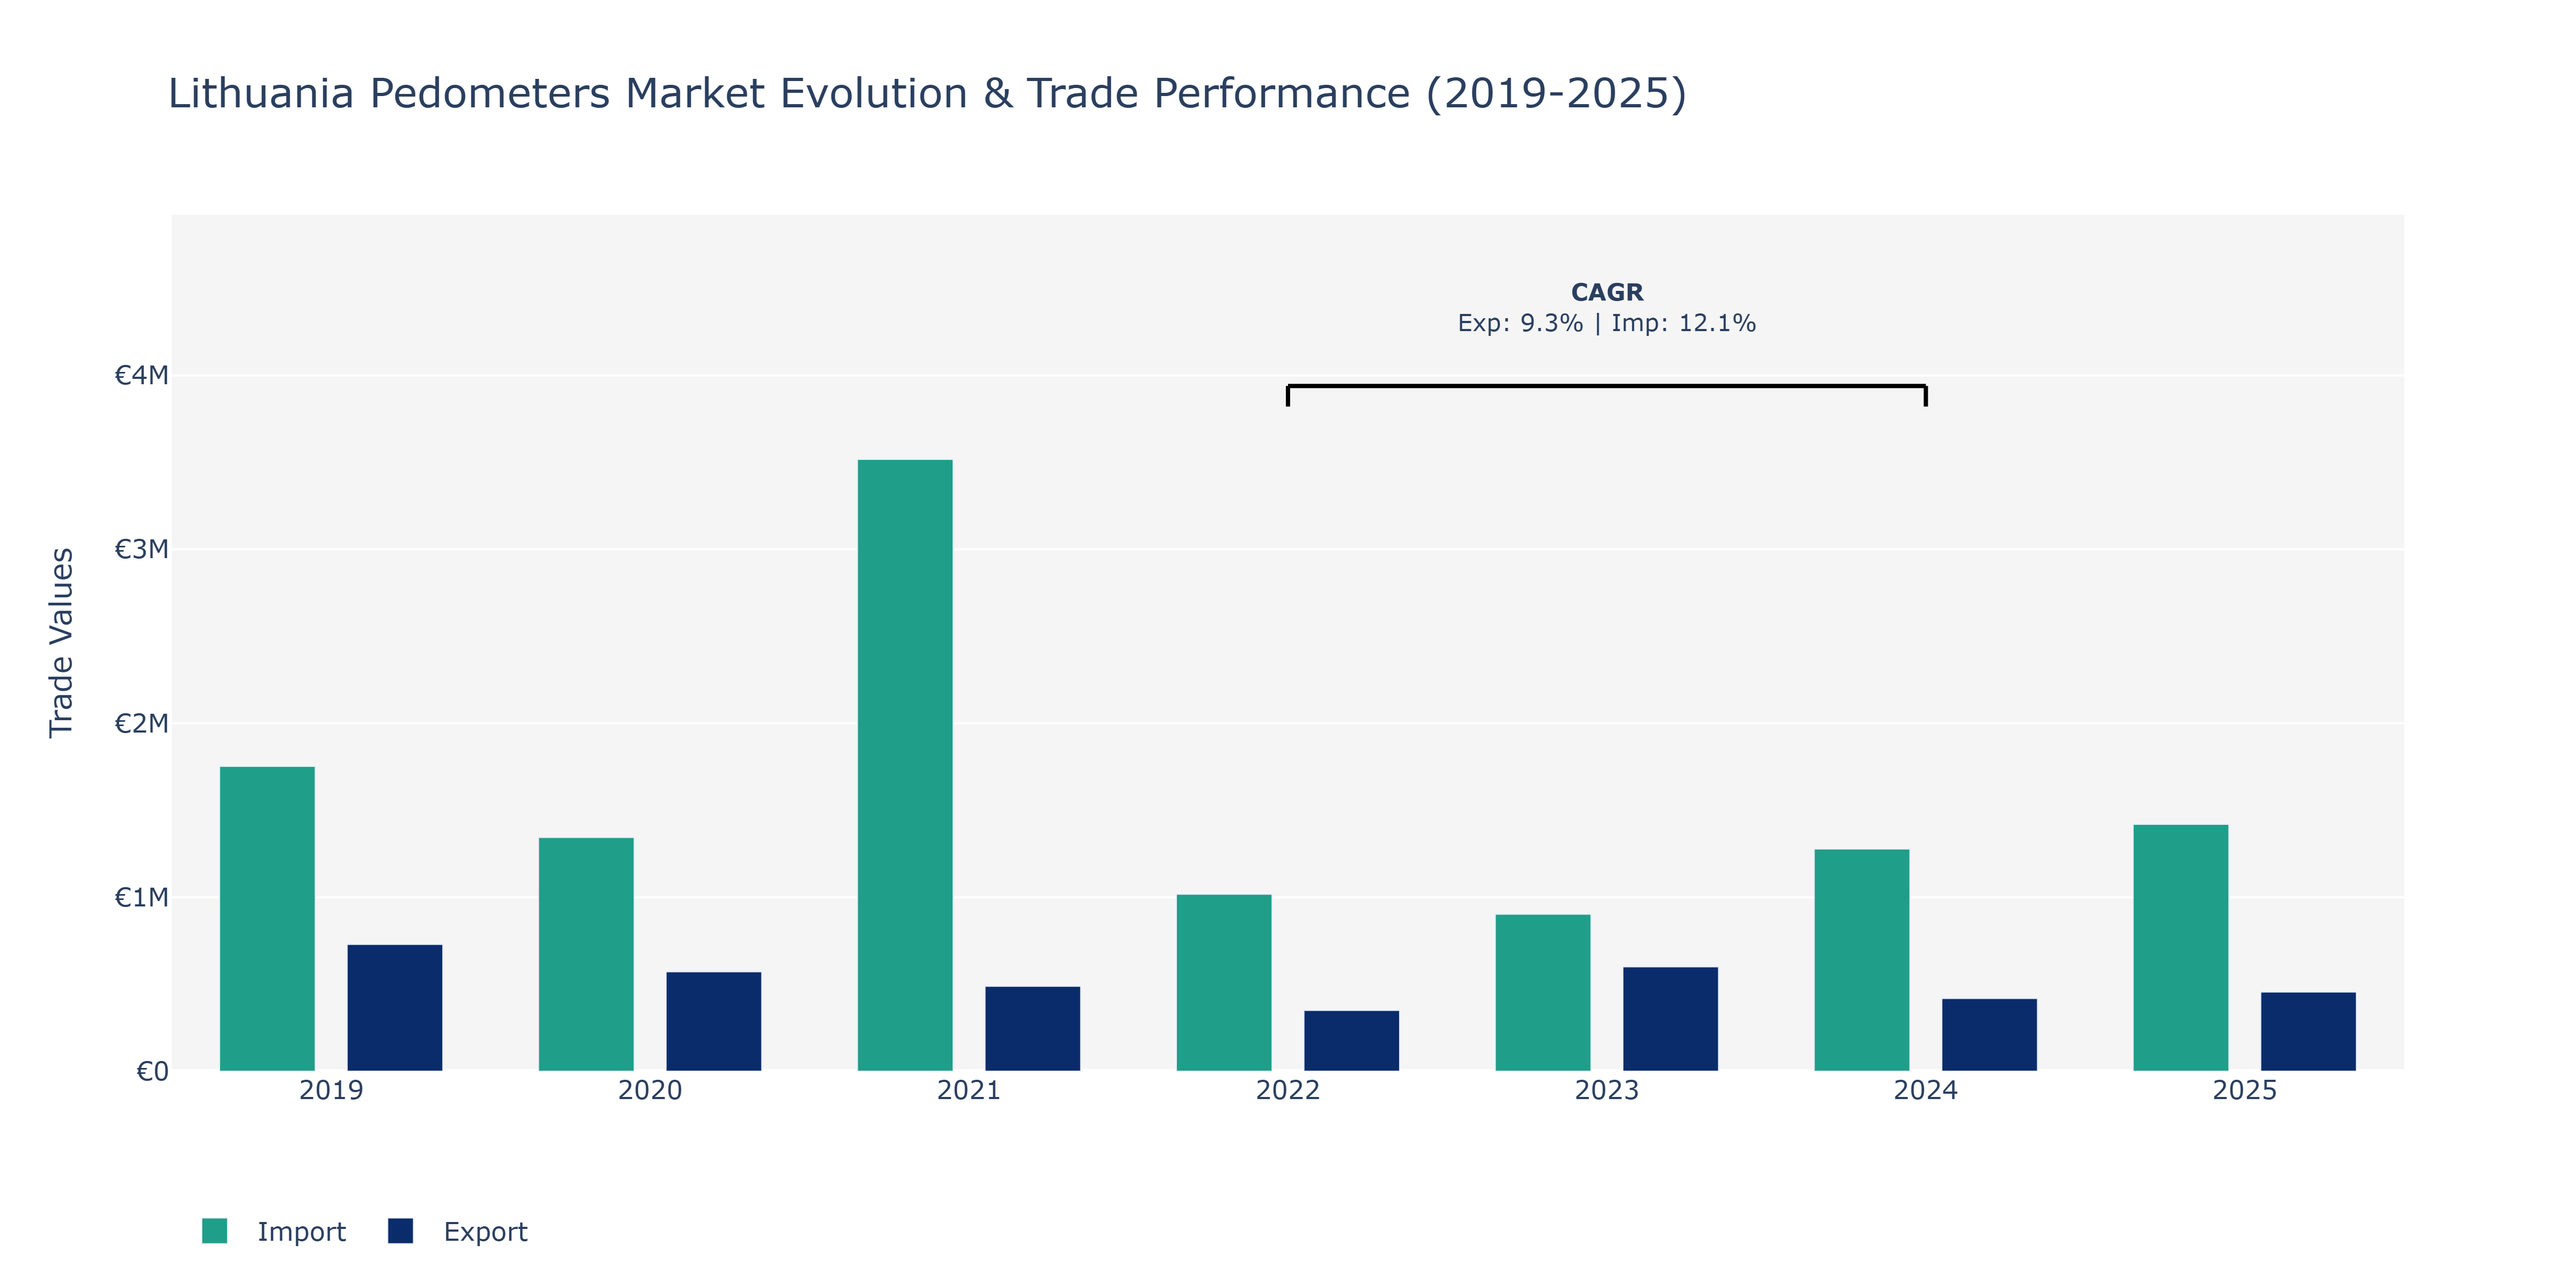
Between 2019 and 2025, Lithuania's Pedometers Market saw varying trends in Exports and Imports. Exports experienced a decline from €728.59 thousand in 2019 to €349.46 thousand in 2022, before recovering to €455.25 thousand in 2025. In contrast, Imports fluctuated, reaching a peak of €3.52 million in 2021, declining to €902.51 thousand in 2023, and then rising slightly to €1.42 million in 2025. The peak in Imports in 2021 could be attributed to increased demand for foreign pedometers due to technological advancements and changing consumer preferences for fitness tracking devices. The subsequent decrease in 2023 may have been influenced by economic factors affecting consumer purchasing power. The recovery in Exports by 2025 could signify improved competitiveness or expanded market access for Lithuanian pedometer manufacturers. These trends highlight the market's sensitivity to global economic conditions and technological advancements, necessitating strategic planning to navigate fluctuations effectively.
Key Highlights of the Report:
- Lithuania Pedometers Market Outlook
- Market Size of Lithuania Pedometers Market, 2025
- Forecast of Lithuania Pedometers Market, 2032
- Historical Data and Forecast of Lithuania Pedometers Revenues & Volume for the Period 2022 - 2032F
- Lithuania Pedometers Market Trend Evolution
- Lithuania Pedometers Market Drivers and Challenges
- Lithuania Pedometers Price Trends
- Lithuania Pedometers Porter`s Five Forces
- Lithuania Pedometers Industry Life Cycle
- Historical Data and Forecast of Lithuania Pedometers Market Revenues & Volume By Product Type for the Period 2022 - 2032F
- Historical Data and Forecast of Lithuania Pedometers Market Revenues & Volume By Piezoelectric pedometer for the Period 2022 - 2032F
- Historical Data and Forecast of Lithuania Pedometers Market Revenues & Volume By Spring-levered pedometer for the Period 2022 - 2032F
- Historical Data and Forecast of Lithuania Pedometers Market Revenues & Volume By Distribution Channel for the Period 2022 - 2032F
- Historical Data and Forecast of Lithuania Pedometers Market Revenues & Volume By e-commerce for the Period 2022 - 2032F
- Historical Data and Forecast of Lithuania Pedometers Market Revenues & Volume By Retail stores for the Period 2022 - 2032F
- Historical Data and Forecast of Lithuania Pedometers Market Revenues & Volume By Supermarket for the Period 2022 - 2032F
- Historical Data and Forecast of Lithuania Pedometers Market Revenues & Volume By Others for the Period 2022 - 2032F
- Lithuania Pedometers Import Export Trade Statistics
- Market Opportunity Assessment By Product Type
- Market Opportunity Assessment By Distribution Channel
- Lithuania Pedometers Top Companies Market Share
- Lithuania Pedometers Competitive Benchmarking By Technical and Operational Parameters
- Lithuania Pedometers Company Profiles
- Lithuania Pedometers Key Strategic Recommendations
Frequently Asked Questions About the Market Study (FAQs):
6Wresearch actively monitors the Lithuania Pedometers Market and publishes its comprehensive annual report, highlighting emerging trends, growth drivers, revenue analysis, and forecast outlook. Our insights help businesses to make data-backed strategic decisions with ongoing market dynamics. Our analysts track relevent industries related to the Lithuania Pedometers Market, allowing our clients with actionable intelligence and reliable forecasts tailored to emerging regional needs.
Yes, we provide customisation as per your requirements. To learn more, feel free to contact us on sales@6wresearch.com
1 Executive Summary |
2 Introduction |
2.1 Key Highlights of the Report |
2.2 Report Description |
2.3 Market Scope & Segmentation |
2.4 Research Methodology |
2.5 Assumptions |
3 Lithuania Pedometers Market Overview |
3.1 Lithuania Country Macro Economic Indicators |
3.2 Lithuania Pedometers Market Revenues & Volume, 2022 & 2032F |
3.3 Lithuania Pedometers Market - Industry Life Cycle |
3.4 Lithuania Pedometers Market - Porter's Five Forces |
3.5 Lithuania Pedometers Market Revenues & Volume Share, By Product Type, 2022 & 2032F |
3.6 Lithuania Pedometers Market Revenues & Volume Share, By Distribution Channel, 2022 & 2032F |
4 Lithuania Pedometers Market Dynamics |
4.1 Impact Analysis |
4.2 Market Drivers |
4.2.1 Increasing awareness about health and fitness leading to a growing interest in monitoring physical activity. |
4.2.2 Rising prevalence of chronic diseases and obesity, driving the adoption of fitness tracking devices like pedometers. |
4.2.3 Government initiatives promoting healthy lifestyles and physical activity among the population. |
4.3 Market Restraints |
4.3.1 Limited disposable income of the population affecting purchasing power for pedometers. |
4.3.2 Technological advancements leading to the availability of more sophisticated wearable devices competing with traditional pedometers. |
5 Lithuania Pedometers Market Trends |
6 Lithuania Pedometers Market Segmentations |
6.1 Lithuania Pedometers Market, By Product Type |
6.1.1 Overview and Analysis |
6.1.2 Lithuania Pedometers Market Revenues & Volume, By Piezoelectric pedometer, 2022 - 2032F |
6.1.3 Lithuania Pedometers Market Revenues & Volume, By Spring-levered pedometer, 2022 - 2032F |
6.2 Lithuania Pedometers Market, By Distribution Channel |
6.2.1 Overview and Analysis |
6.2.2 Lithuania Pedometers Market Revenues & Volume, By e-commerce, 2022 - 2032F |
6.2.3 Lithuania Pedometers Market Revenues & Volume, By Retail stores, 2022 - 2032F |
6.2.4 Lithuania Pedometers Market Revenues & Volume, By Supermarket, 2022 - 2032F |
6.2.5 Lithuania Pedometers Market Revenues & Volume, By Others, 2022 - 2032F |
7 Lithuania Pedometers Market Import-Export Trade Statistics |
7.1 Lithuania Pedometers Market Export to Major Countries |
7.2 Lithuania Pedometers Market Imports from Major Countries |
8 Lithuania Pedometers Market Key Performance Indicators |
8.1 Average daily step count per user. |
8.2 Percentage increase in the number of participants in health and fitness programs incorporating pedometers. |
8.3 Number of partnerships with health insurance companies offering incentives for using pedometers. |
8.4 Percentage increase in the number of schools integrating pedometers in physical education programs. |
9 Lithuania Pedometers Market - Opportunity Assessment |
9.1 Lithuania Pedometers Market Opportunity Assessment, By Product Type, 2022 & 2032F |
9.2 Lithuania Pedometers Market Opportunity Assessment, By Distribution Channel, 2022 & 2032F |
10 Lithuania Pedometers Market - Competitive Landscape |
10.1 Lithuania Pedometers Market Revenue Share, By Companies, 2025 |
10.2 Lithuania Pedometers Market Competitive Benchmarking, By Operating and Technical Parameters |
11 Company Profiles |
12 Recommendations | 13 Disclaimer |
Export potential assessment - trade Analytics for 2030
Export potential enables firms to identify high-growth global markets with greater confidence by combining advanced trade intelligence with a structured quantitative methodology. The framework analyzes emerging demand trends and country-level import patterns while integrating macroeconomic and trade datasets such as GDP and population forecasts, bilateral import–export flows, tariff structures, elasticity differentials between developed and developing economies, geographic distance, and import demand projections. Using weighted trade values from 2020–2024 as the base period to project country-to-country export potential for 2030, these inputs are operationalized through calculated drivers such as gravity model parameters, tariff impact factors, and projected GDP per-capita growth. Through an analysis of hidden potentials, demand hotspots, and market conditions that are most favorable to success, this method enables firms to focus on target countries, maximize returns, and global expansion with data, backed by accuracy.
By factoring in the projected importer demand gap that is currently unmet and could be potential opportunity, it identifies the potential for the Exporter (Country) among 190 countries, against the general trade analysis, which identifies the biggest importer or exporter.
To discover high-growth global markets and optimize your business strategy:
Click Here
Pricing
- Single User License$ 1,995
- Department License$ 2,400
- Site License$ 3,120
- Global License$ 3,795

Search
Thought Leadership and Analyst Meet


Our Clients
Latest Reports
- France Thermally Conductive Filler Dispersants Market (2026-2032) | Challenges, Restraints, Value, Share, Size, segmentation, Analysis, Trends, Investment Opportunities, Outlook, Pricing, Demand, Forecast, Revenue, Companies, Growth, Drivers, Strategy, Insights, Competition
- Egypt Thermally Conductive Filler Dispersants Market (2026-2032) | Competition, Forecast, Strategy, Value, Insights, Outlook, Investment Opportunities, Pricing, Demand, Share, segmentation, Drivers, Size, Companies, Restraints, Growth, Trends, Revenue, Challenges, Analysis
- Czech Republic Thermally Conductive Filler Dispersants Market (2026-2032) | Forecast, Pricing, Analysis, Drivers, Insights, Size, Demand, Growth, Challenges, segmentation, Competition, Outlook, Trends, Investment Opportunities, Companies, Strategy, Revenue, Share, Value, Restraints
- Colombia Thermally Conductive Filler Dispersants Market (2026-2032) | segmentation, Trends, Share, Drivers, Strategy, Companies, Demand, Insights, Size, Challenges, Value, Competition, Analysis, Growth, Revenue, Restraints, Forecast, Pricing, Outlook, Investment Opportunities
- China Thermally Conductive Filler Dispersants Market (2026-2032) | Restraints, Investment Opportunities, Pricing, Companies, Share, Size, Challenges, Trends, Outlook, Value, Analysis, Competition, Revenue, Drivers, Forecast, Demand, Insights, Growth, Strategy, segmentation
- Chile Thermally Conductive Filler Dispersants Market (2026-2032) | Investment Opportunities, Trends, Value, Restraints, Share, Companies, Forecast, segmentation, Pricing, Challenges, Demand, Size, Analysis, Drivers, Outlook, Growth, Competition, Strategy, Revenue, Insights
- Cambodia Thermally Conductive Filler Dispersants Market (2026-2032) | Analysis, Share, Outlook, Strategy, Pricing, Demand, Size, Growth, segmentation, Insights, Revenue, Forecast, Challenges, Competition, Companies, Investment Opportunities, Trends, Restraints, Value, Drivers
- Brazil Thermally Conductive Filler Dispersants Market (2026-2032) | Restraints, Forecast, Competition, Size, Revenue, Value, Investment Opportunities, Trends, Insights, Outlook, Growth, Analysis, Drivers, segmentation, Pricing, Challenges, Strategy, Share, Companies, Demand
- Bangladesh Thermally Conductive Filler Dispersants Market (2026-2032) | Restraints, Trends, Analysis, Competition, Insights, Forecast, Value, Investment Opportunities, Pricing, Share, Demand, Outlook, Revenue, segmentation, Companies, Drivers, Growth, Size, Challenges, Strategy
- Bahrain Thermally Conductive Filler Dispersants Market (2026-2032) | Trends, Outlook, Pricing, Demand, Value, Competition, Forecast, Growth, segmentation, Revenue, Companies, Analysis, Insights, Size, Drivers, Challenges, Strategy, Investment Opportunities, Share, Restraints
Industry Events and Analyst Meet

HIMTEX 2026

India Refining Summit 2026

India EV Show 2026

EV tech India Expo 2026

Auto Tech Asia 2026
Whitepaper
- Middle East & Africa Commercial Security Market Click here to view more.
- Middle East & Africa Fire Safety Systems & Equipment Market Click here to view more.
- GCC Drone Market Click here to view more.
- Middle East Lighting Fixture Market Click here to view more.
- GCC Physical & Perimeter Security Market Click here to view more.
6WResearch In News
- Doha a strategic location for EV manufacturing hub: IPA Qatar
- Demand for luxury TVs surging in the GCC, says Samsung
- Empowering Growth: The Thriving Journey of Bangladesh’s Cable Industry
- Demand for luxury TVs surging in the GCC, says Samsung
- Video call with a traditional healer? Once unthinkable, it’s now common in South Africa
- Intelligent Buildings To Smooth GCC’s Path To Net Zero