Lithuania Permanent Magnet Market (2025-2031) | Share, Segmentation, Value, Analysis, Industry, Companies, Size & Revenue, Forecast, Trends, Outlook, Growth, Competitive Landscape
Market Forecast By Type (Neodymium Iron Boron Magnets, Ferrite Magnets, Samarium Cobalt Magnets, Alnico Magnets, Others), By End-Use (Consumer Electronics, General Industrial, Automotive, Medical Technology, Environment & Energy, Aerospace & Defense, Others) And Competitive Landscape
| Product Code: ETC8048114 | Publication Date: Sep 2024 | Updated Date: Apr 2026 | Product Type: Market Research Report | |
| Publisher: 6Wresearch | Author: Shubham Padhi | No. of Pages: 75 | No. of Figures: 35 | No. of Tables: 20 |
Lithuania Permanent Magnet Market Size (2020-2030)
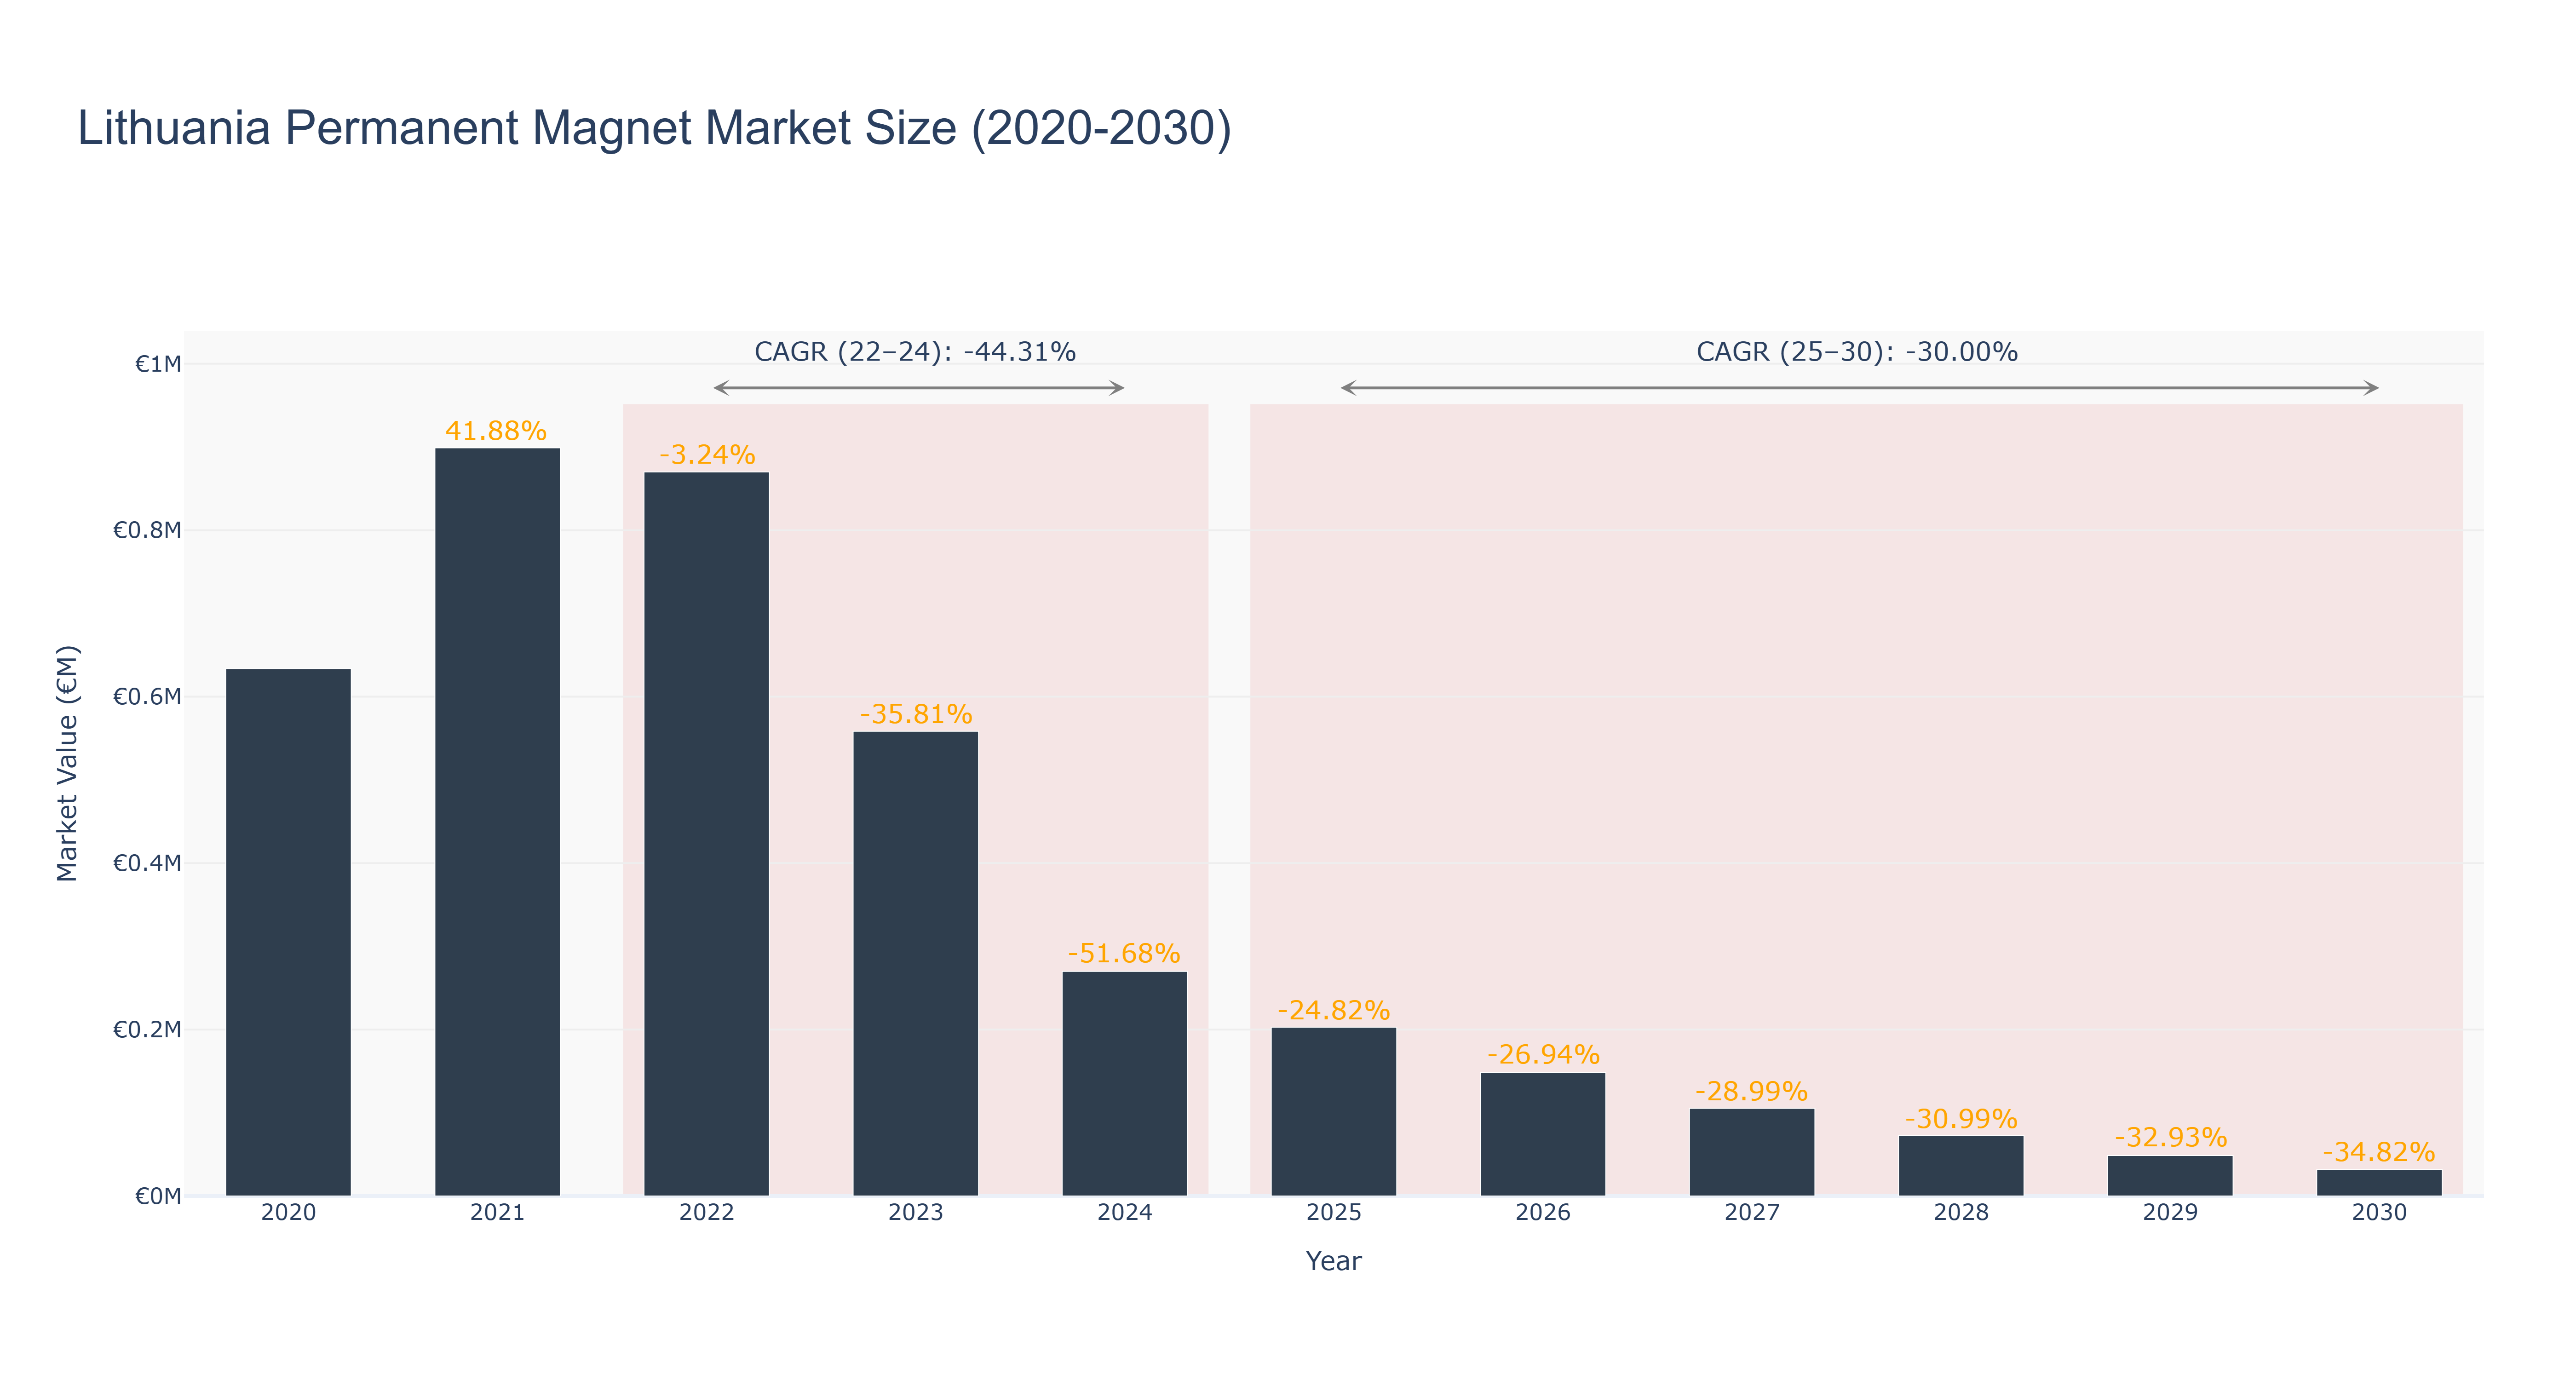
The Lithuania Permanent Magnet Market has seen a significant decline in market size over the past decade. The peak market size of €0.90 million was recorded in 2021, followed by a steady decrease to €0.03 million in 2030. The market experienced a sharp downturn from 2022 to 2024, with a CAGR of -44.31%, attributed to economic challenges and reduced demand. The forecasted CAGR from 2025 to 2030 is -30.0%, indicating a continued downward trend. Industry drivers such as technological advancements and sustainability initiatives are crucial for market recovery. Looking ahead, upcoming projects in renewable energy infrastructure are expected to drive demand for permanent magnets in Lithuania, offering a potential growth opportunity for the market in the near future.
Lithuania Permanent Magnet Market: Production & Trade Performance (2019-2025)
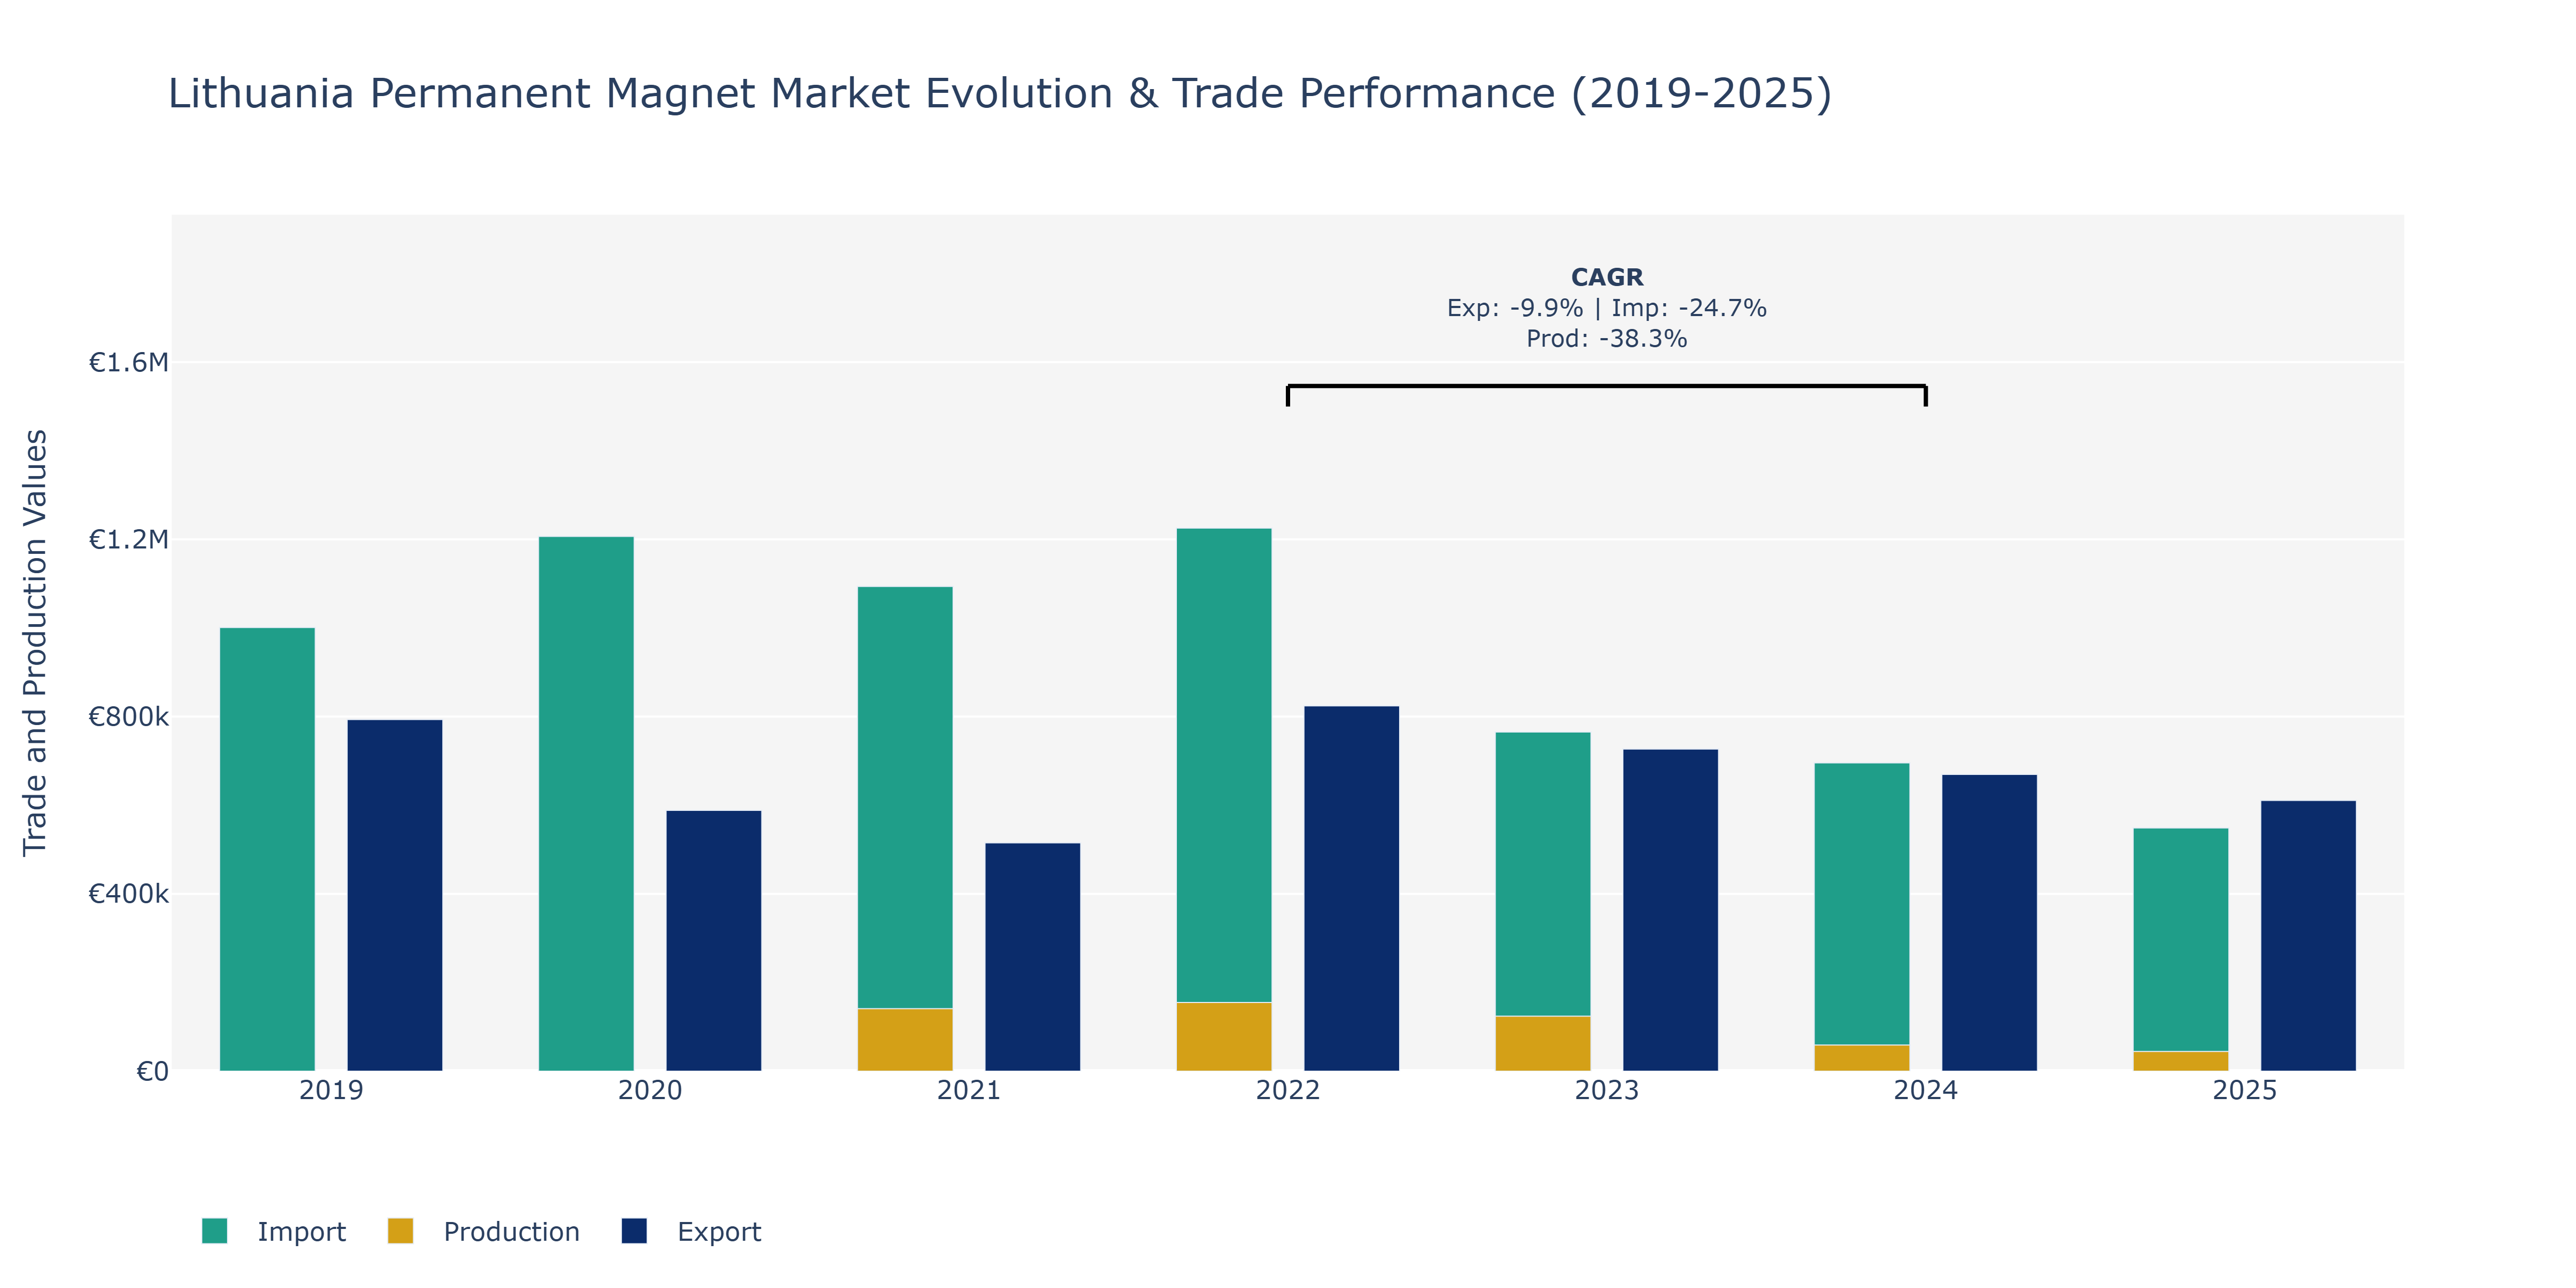
In the Lithuania Permanent Magnet Market, exports saw a gradual decline from 2019 to 2025, starting at €793.61 thousand and dropping steadily to €610.85 thousand in 2025. Imports, on the other hand, fluctuated over the years, peaking at €1.21 million in 2020 before decreasing to €548.87 thousand in 2025. Production levels also experienced a notable decline, falling from €141 million in 2021 to €44.35 million in 2025. The fluctuations in exports and imports can be attributed to global economic conditions impacting demand and supply chains. The decrease in production might be linked to technological advancements leading to more efficient manufacturing processes, resulting in reduced production costs. To maintain competitiveness, companies in the market may need to focus on innovation and cost-effective production methods amid changing market dynamics.
Key Highlights of the Report:
- Lithuania Permanent Magnet Market Outlook
- Market Size of Lithuania Permanent Magnet Market, 2024
- Forecast of Lithuania Permanent Magnet Market, 2031
- Historical Data and Forecast of Lithuania Permanent Magnet Revenues & Volume for the Period 2021- 2031
- Lithuania Permanent Magnet Market Trend Evolution
- Lithuania Permanent Magnet Market Drivers and Challenges
- Lithuania Permanent Magnet Price Trends
- Lithuania Permanent Magnet Porter's Five Forces
- Lithuania Permanent Magnet Industry Life Cycle
- Historical Data and Forecast of Lithuania Permanent Magnet Market Revenues & Volume By Type for the Period 2021- 2031
- Historical Data and Forecast of Lithuania Permanent Magnet Market Revenues & Volume By Neodymium Iron Boron Magnets for the Period 2021- 2031
- Historical Data and Forecast of Lithuania Permanent Magnet Market Revenues & Volume By Ferrite Magnets for the Period 2021- 2031
- Historical Data and Forecast of Lithuania Permanent Magnet Market Revenues & Volume By Samarium Cobalt Magnets for the Period 2021- 2031
- Historical Data and Forecast of Lithuania Permanent Magnet Market Revenues & Volume By Alnico Magnets for the Period 2021- 2031
- Historical Data and Forecast of Lithuania Permanent Magnet Market Revenues & Volume By Others for the Period 2021- 2031
- Historical Data and Forecast of Lithuania Permanent Magnet Market Revenues & Volume By End-Use for the Period 2021- 2031
- Historical Data and Forecast of Lithuania Permanent Magnet Market Revenues & Volume By Consumer Electronics for the Period 2021- 2031
- Historical Data and Forecast of Lithuania Permanent Magnet Market Revenues & Volume By General Industrial for the Period 2021- 2031
- Historical Data and Forecast of Lithuania Permanent Magnet Market Revenues & Volume By Automotive for the Period 2021- 2031
- Historical Data and Forecast of Lithuania Permanent Magnet Market Revenues & Volume By Medical Technology for the Period 2021- 2031
- Historical Data and Forecast of Lithuania Permanent Magnet Market Revenues & Volume By Environment & Energy for the Period 2021- 2031
- Historical Data and Forecast of Lithuania Permanent Magnet Market Revenues & Volume By Aerospace & Defense for the Period 2021- 2031
- Historical Data and Forecast of Lithuania Permanent Magnet Market Revenues & Volume By Others for the Period 2021- 2031
- Lithuania Permanent Magnet Import Export Trade Statistics
- Market Opportunity Assessment By Type
- Market Opportunity Assessment By End-Use
- Lithuania Permanent Magnet Top Companies Market Share
- Lithuania Permanent Magnet Competitive Benchmarking By Technical and Operational Parameters
- Lithuania Permanent Magnet Company Profiles
- Lithuania Permanent Magnet Key Strategic Recommendations
Frequently Asked Questions About the Market Study (FAQs):
6Wresearch actively monitors the Lithuania Permanent Magnet Market and publishes its comprehensive annual report, highlighting emerging trends, growth drivers, revenue analysis, and forecast outlook. Our insights help businesses to make data-backed strategic decisions with ongoing market dynamics. Our analysts track relevent industries related to the Lithuania Permanent Magnet Market, allowing our clients with actionable intelligence and reliable forecasts tailored to emerging regional needs.
Yes, we provide customisation as per your requirements. To learn more, feel free to contact us on sales@6wresearch.com
1 Executive Summary |
2 Introduction |
2.1 Key Highlights of the Report |
2.2 Report Description |
2.3 Market Scope & Segmentation |
2.4 Research Methodology |
2.5 Assumptions |
3 Lithuania Permanent Magnet Market Overview |
3.1 Lithuania Country Macro Economic Indicators |
3.2 Lithuania Permanent Magnet Market Revenues & Volume, 2021 & 2031F |
3.3 Lithuania Permanent Magnet Market - Industry Life Cycle |
3.4 Lithuania Permanent Magnet Market - Porter's Five Forces |
3.5 Lithuania Permanent Magnet Market Revenues & Volume Share, By Type, 2021 & 2031F |
3.6 Lithuania Permanent Magnet Market Revenues & Volume Share, By End-Use, 2021 & 2031F |
4 Lithuania Permanent Magnet Market Dynamics |
4.1 Impact Analysis |
4.2 Market Drivers |
4.2.1 Increasing demand for permanent magnets in automotive applications |
4.2.2 Growing adoption of renewable energy sources such as wind turbines |
4.2.3 Technological advancements in electronics and consumer goods industries |
4.3 Market Restraints |
4.3.1 Fluctuating prices of raw materials like neodymium, cobalt, and dysprosium |
4.3.2 Intense competition from other countries producing permanent magnets |
4.3.3 Environmental concerns related to the mining and extraction of raw materials |
5 Lithuania Permanent Magnet Market Trends |
6 Lithuania Permanent Magnet Market, By Types |
6.1 Lithuania Permanent Magnet Market, By Type |
6.1.1 Overview and Analysis |
6.1.2 Lithuania Permanent Magnet Market Revenues & Volume, By Type, 2021- 2031F |
6.1.3 Lithuania Permanent Magnet Market Revenues & Volume, By Neodymium Iron Boron Magnets, 2021- 2031F |
6.1.4 Lithuania Permanent Magnet Market Revenues & Volume, By Ferrite Magnets, 2021- 2031F |
6.1.5 Lithuania Permanent Magnet Market Revenues & Volume, By Samarium Cobalt Magnets, 2021- 2031F |
6.1.6 Lithuania Permanent Magnet Market Revenues & Volume, By Alnico Magnets, 2021- 2031F |
6.1.7 Lithuania Permanent Magnet Market Revenues & Volume, By Others, 2021- 2031F |
6.2 Lithuania Permanent Magnet Market, By End-Use |
6.2.1 Overview and Analysis |
6.2.2 Lithuania Permanent Magnet Market Revenues & Volume, By Consumer Electronics, 2021- 2031F |
6.2.3 Lithuania Permanent Magnet Market Revenues & Volume, By General Industrial, 2021- 2031F |
6.2.4 Lithuania Permanent Magnet Market Revenues & Volume, By Automotive, 2021- 2031F |
6.2.5 Lithuania Permanent Magnet Market Revenues & Volume, By Medical Technology, 2021- 2031F |
6.2.6 Lithuania Permanent Magnet Market Revenues & Volume, By Environment & Energy, 2021- 2031F |
6.2.7 Lithuania Permanent Magnet Market Revenues & Volume, By Aerospace & Defense, 2021- 2031F |
7 Lithuania Permanent Magnet Market Import-Export Trade Statistics |
7.1 Lithuania Permanent Magnet Market Export to Major Countries |
7.2 Lithuania Permanent Magnet Market Imports from Major Countries |
8 Lithuania Permanent Magnet Market Key Performance Indicators |
8.1 Average selling price of permanent magnets in Lithuania |
8.2 Number of patents filed for permanent magnet technologies in Lithuania |
8.3 Investment in research and development for new applications of permanent magnets in Lithuania |
9 Lithuania Permanent Magnet Market - Opportunity Assessment |
9.1 Lithuania Permanent Magnet Market Opportunity Assessment, By Type, 2021 & 2031F |
9.2 Lithuania Permanent Magnet Market Opportunity Assessment, By End-Use, 2021 & 2031F |
10 Lithuania Permanent Magnet Market - Competitive Landscape |
10.1 Lithuania Permanent Magnet Market Revenue Share, By Companies, 2024 |
10.2 Lithuania Permanent Magnet Market Competitive Benchmarking, By Operating and Technical Parameters |
11 Company Profiles |
12 Recommendations |
13 Disclaimer |
Export potential assessment - trade Analytics for 2030
Export potential enables firms to identify high-growth global markets with greater confidence by combining advanced trade intelligence with a structured quantitative methodology. The framework analyzes emerging demand trends and country-level import patterns while integrating macroeconomic and trade datasets such as GDP and population forecasts, bilateral import–export flows, tariff structures, elasticity differentials between developed and developing economies, geographic distance, and import demand projections. Using weighted trade values from 2020–2024 as the base period to project country-to-country export potential for 2030, these inputs are operationalized through calculated drivers such as gravity model parameters, tariff impact factors, and projected GDP per-capita growth. Through an analysis of hidden potentials, demand hotspots, and market conditions that are most favorable to success, this method enables firms to focus on target countries, maximize returns, and global expansion with data, backed by accuracy.
By factoring in the projected importer demand gap that is currently unmet and could be potential opportunity, it identifies the potential for the Exporter (Country) among 190 countries, against the general trade analysis, which identifies the biggest importer or exporter.
To discover high-growth global markets and optimize your business strategy:
Click Here
Pricing
- Single User License$ 1,995
- Department License$ 2,400
- Site License$ 3,120
- Global License$ 3,795

Search
Thought Leadership and Analyst Meet


Our Clients
Latest Reports
- Philippines Polyhydroxybutyrate-co-Hydroxyvalerate Market (2026-2032) | Trends, Insights, Challenges, Restraints, Competition, Size, Value, Forecast, Pricing, Share, Outlook, Revenue, Investment Opportunities, Strategy, Drivers, Demand, Growth, segmentation, Analysis, Companies
- Peru Polyhydroxybutyrate-co-Hydroxyvalerate Market (2026-2032) | Growth, Demand, Challenges, Share, Trends, Analysis, Pricing, Investment Opportunities, Drivers, Value, Forecast, Competition, Size, Companies, Insights, Outlook, Restraints, segmentation, Revenue, Strategy
- Pakistan Polyhydroxybutyrate-co-Hydroxyvalerate Market (2026-2032) | Restraints, segmentation, Pricing, Forecast, Share, Strategy, Competition, Trends, Insights, Drivers, Challenges, Growth, Revenue, Outlook, Value, Investment Opportunities, Companies, Size, Analysis, Demand
- Oman Polyhydroxybutyrate-co-Hydroxyvalerate Market (2026-2032) | Drivers, segmentation, Insights, Competition, Pricing, Outlook, Size, Revenue, Challenges, Forecast, Analysis, Growth, Value, Share, Trends, Investment Opportunities, Strategy, Restraints, Companies, Demand
- Nigeria Polyhydroxybutyrate-co-Hydroxyvalerate Market (2026-2032) | Value, Investment Opportunities, Analysis, Revenue, Restraints, Pricing, Outlook, Competition, Demand, Growth, Forecast, Companies, Trends, Challenges, segmentation, Drivers, Insights, Share, Size, Strategy
- Nepal Polyhydroxybutyrate-co-Hydroxyvalerate Market (2026-2032) | Insights, Analysis, Drivers, Share, Revenue, Demand, segmentation, Investment Opportunities, Competition, Forecast, Growth, Pricing, Companies, Strategy, Trends, Restraints, Challenges, Outlook, Size, Value
- Myanmar Polyhydroxybutyrate-co-Hydroxyvalerate Market (2026-2032) | Outlook, Revenue, Strategy, Restraints, Drivers, segmentation, Share, Forecast, Competition, Insights, Growth, Pricing, Size, Demand, Value, Companies, Trends, Challenges, Investment Opportunities, Analysis
- Morocco Polyhydroxybutyrate-co-Hydroxyvalerate Market (2026-2032) | Outlook, Investment Opportunities, Restraints, Strategy, Forecast, Challenges, Drivers, Growth, Companies, segmentation, Trends, Size, Competition, Revenue, Demand, Insights, Share, Analysis, Value, Pricing
- Mexico Polyhydroxybutyrate-co-Hydroxyvalerate Market (2026-2032) | Size, Drivers, Outlook, Share, Strategy, Growth, Pricing, Challenges, Companies, Demand, Value, Investment Opportunities, Restraints, Trends, Forecast, segmentation, Analysis, Insights, Competition, Revenue
- Malaysia Polyhydroxybutyrate-co-Hydroxyvalerate Market (2026-2032) | Share, segmentation, Size, Companies, Analysis, Insights, Forecast, Value, Revenue, Drivers, Restraints, Challenges, Investment Opportunities, Trends, Competition, Strategy, Demand, Growth, Outlook, Pricing
Industry Events and Analyst Meet

HIMTEX 2026

India Refining Summit 2026

India EV Show 2026

EV tech India Expo 2026

Auto Tech Asia 2026
Whitepaper
- Middle East & Africa Commercial Security Market Click here to view more.
- Middle East & Africa Fire Safety Systems & Equipment Market Click here to view more.
- GCC Drone Market Click here to view more.
- Middle East Lighting Fixture Market Click here to view more.
- GCC Physical & Perimeter Security Market Click here to view more.
6WResearch In News
- Doha a strategic location for EV manufacturing hub: IPA Qatar
- Demand for luxury TVs surging in the GCC, says Samsung
- Empowering Growth: The Thriving Journey of Bangladesh’s Cable Industry
- Demand for luxury TVs surging in the GCC, says Samsung
- Video call with a traditional healer? Once unthinkable, it’s now common in South Africa
- Intelligent Buildings To Smooth GCC’s Path To Net Zero