Lithuania Phenolic Resin Market (2026-2032) | Share, Value, Segmentation, Outlook, Analysis, Size, Revenue, Trends, Growth, Companies, Forecast & Industry
Market Forecast By Type (Resol, Novolac), By Application (Wood Adhesives, Laminates, Foundry & Moldings, Paper Impregnation, Coatings, Insulations) And Competitive Landscape
| Product Code: ETC5703878 | Publication Date: Nov 2023 | Updated Date: Apr 2026 | Product Type: Market Research Report | |
| Publisher: 6Wresearch | Author: Ravi Bhandari | No. of Pages: 60 | No. of Figures: 30 | No. of Tables: 5 |
Lithuania Phenolic Resin Market Size (2020-2030)
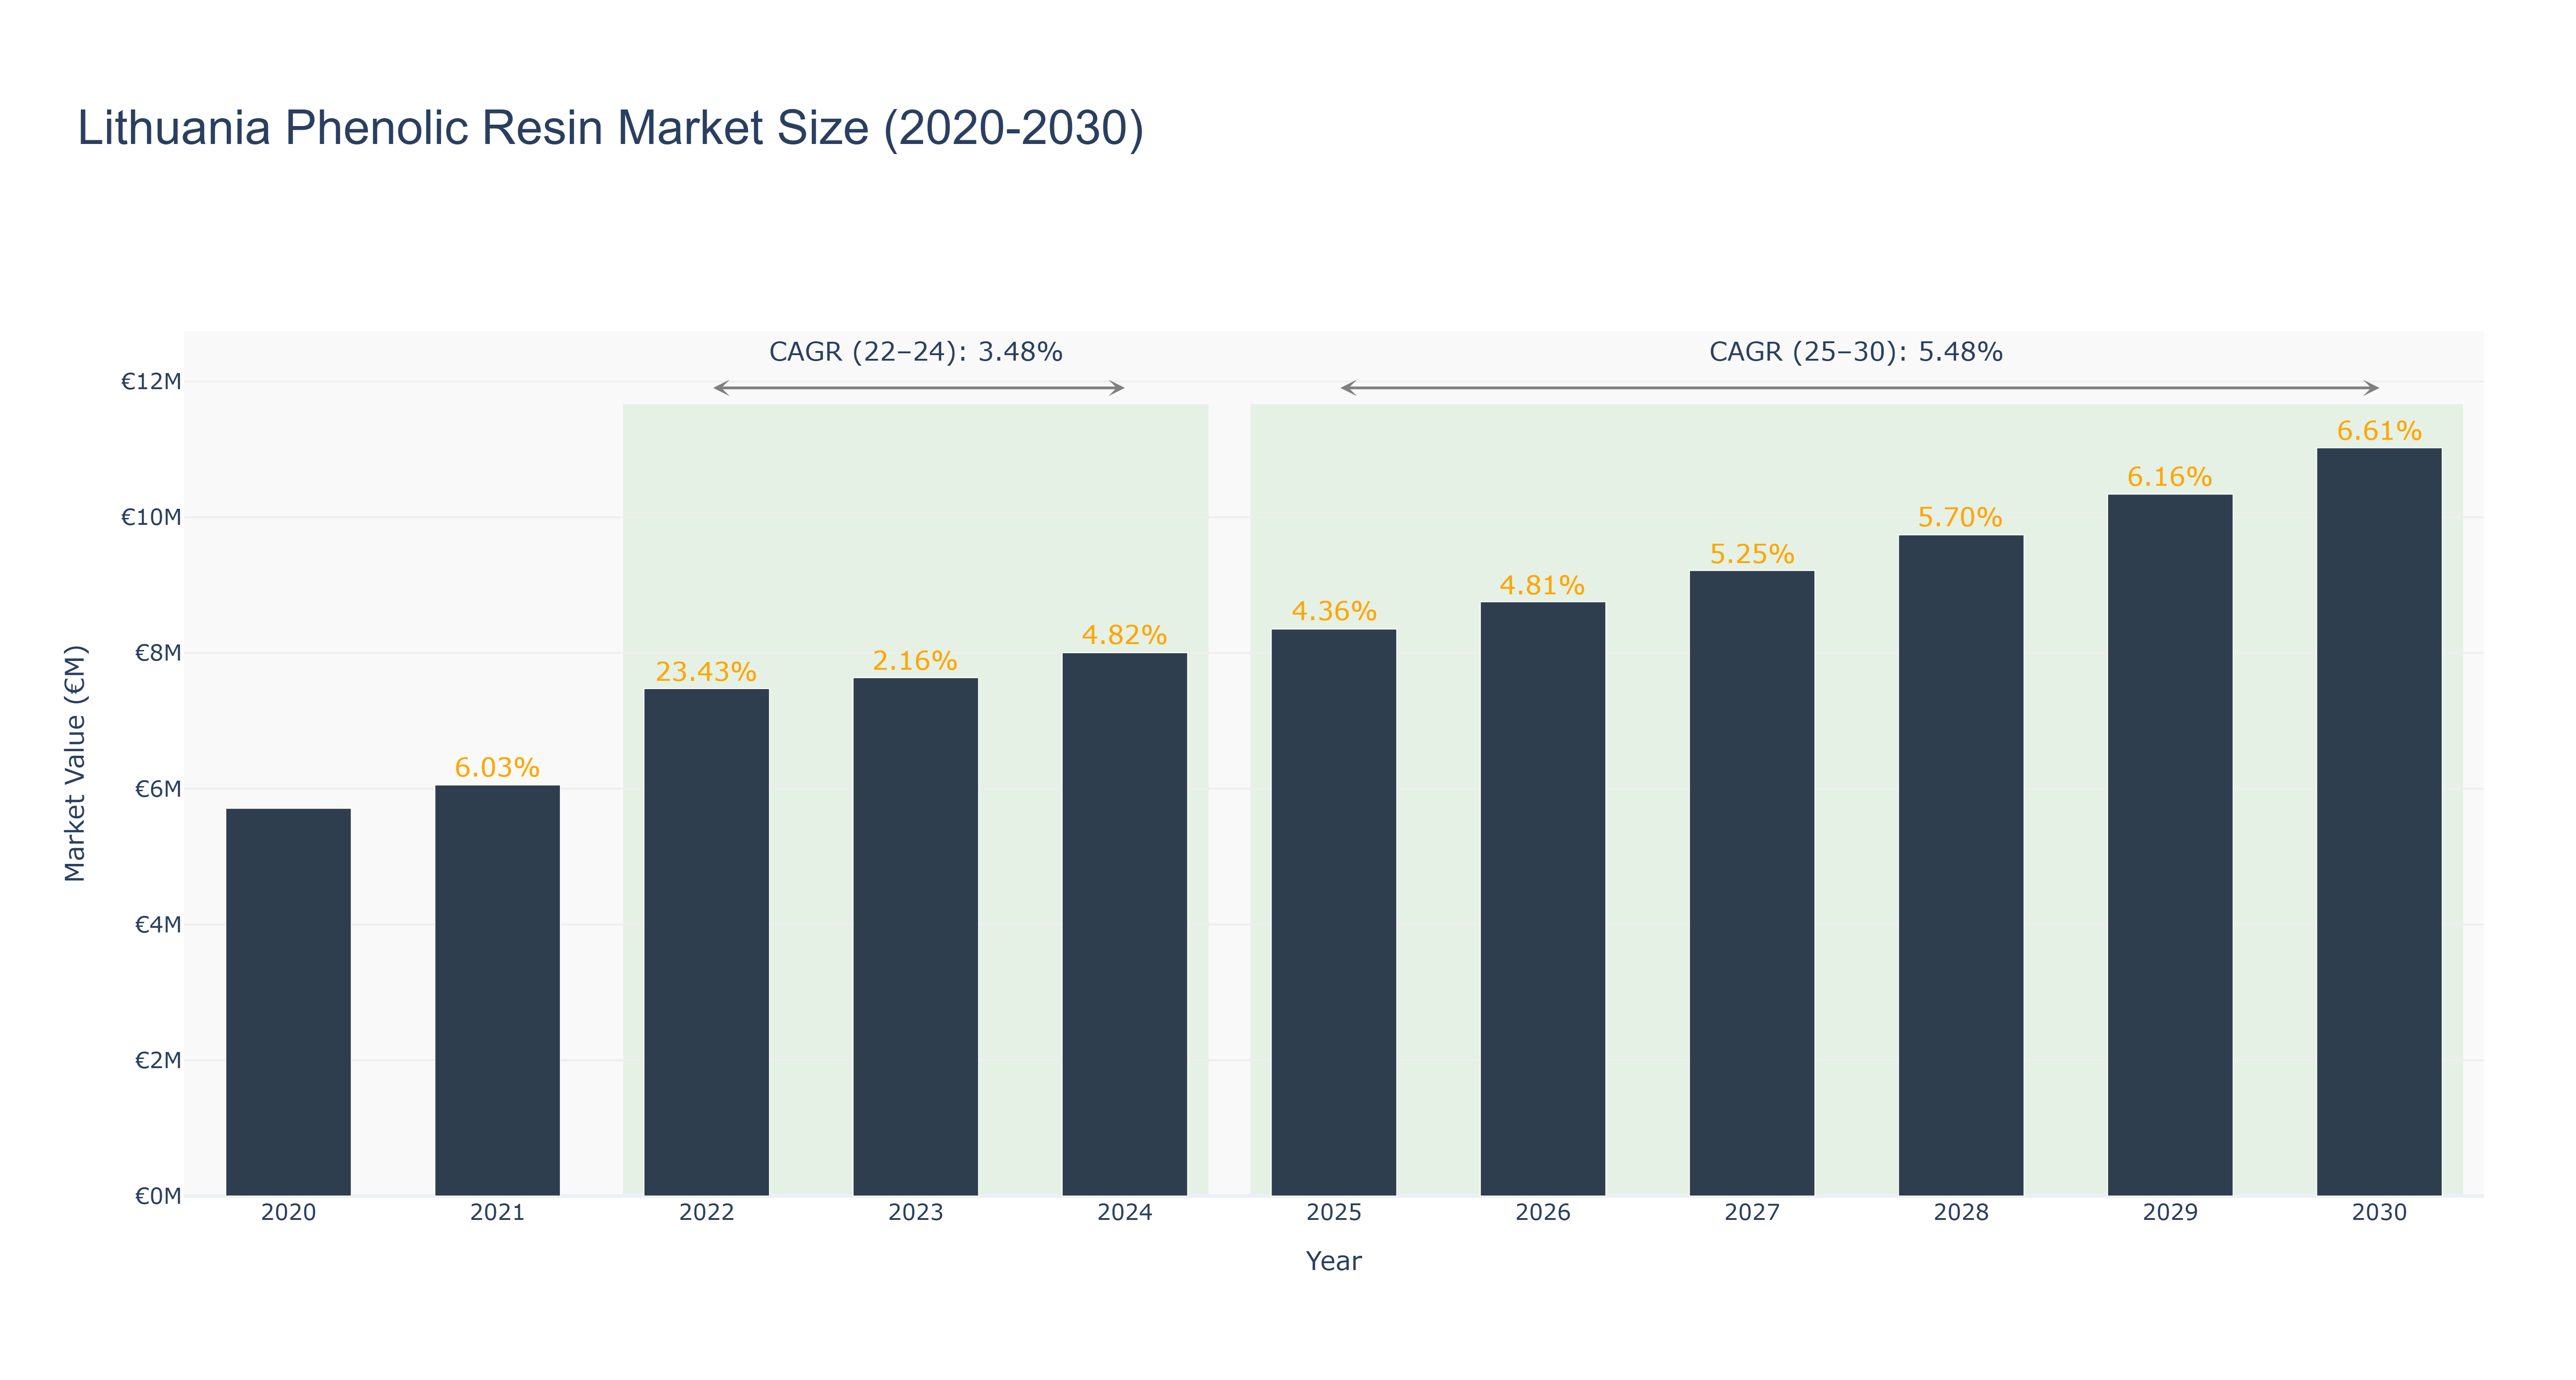
Lithuania Phenolic Resin Market has shown a steady growth trajectory over the years. The peak market size of €11.02 million is forecasted for 2030, with a notable CAGR of 5.47% from 2025 to 2030. The market experienced consistent growth from 2020 to 2024, with the market size increasing from €5.71 million to €8.00 million. The recent years have seen an upward trend in market size, attributed to increasing demand in various industries such as construction and automotive due to the superior properties of phenolic resins. Looking ahead, Lithuania is set to witness key developments in the phenolic resin market, with upcoming projects focusing on sustainability and innovation to meet the evolving consumer demands and regulatory requirements. The industry drivers include technological advancements, environmental regulations, and growing application scope across sectors.
Lithuania Phenolic Resin Market: Production & Trade Performance (2019-2025)
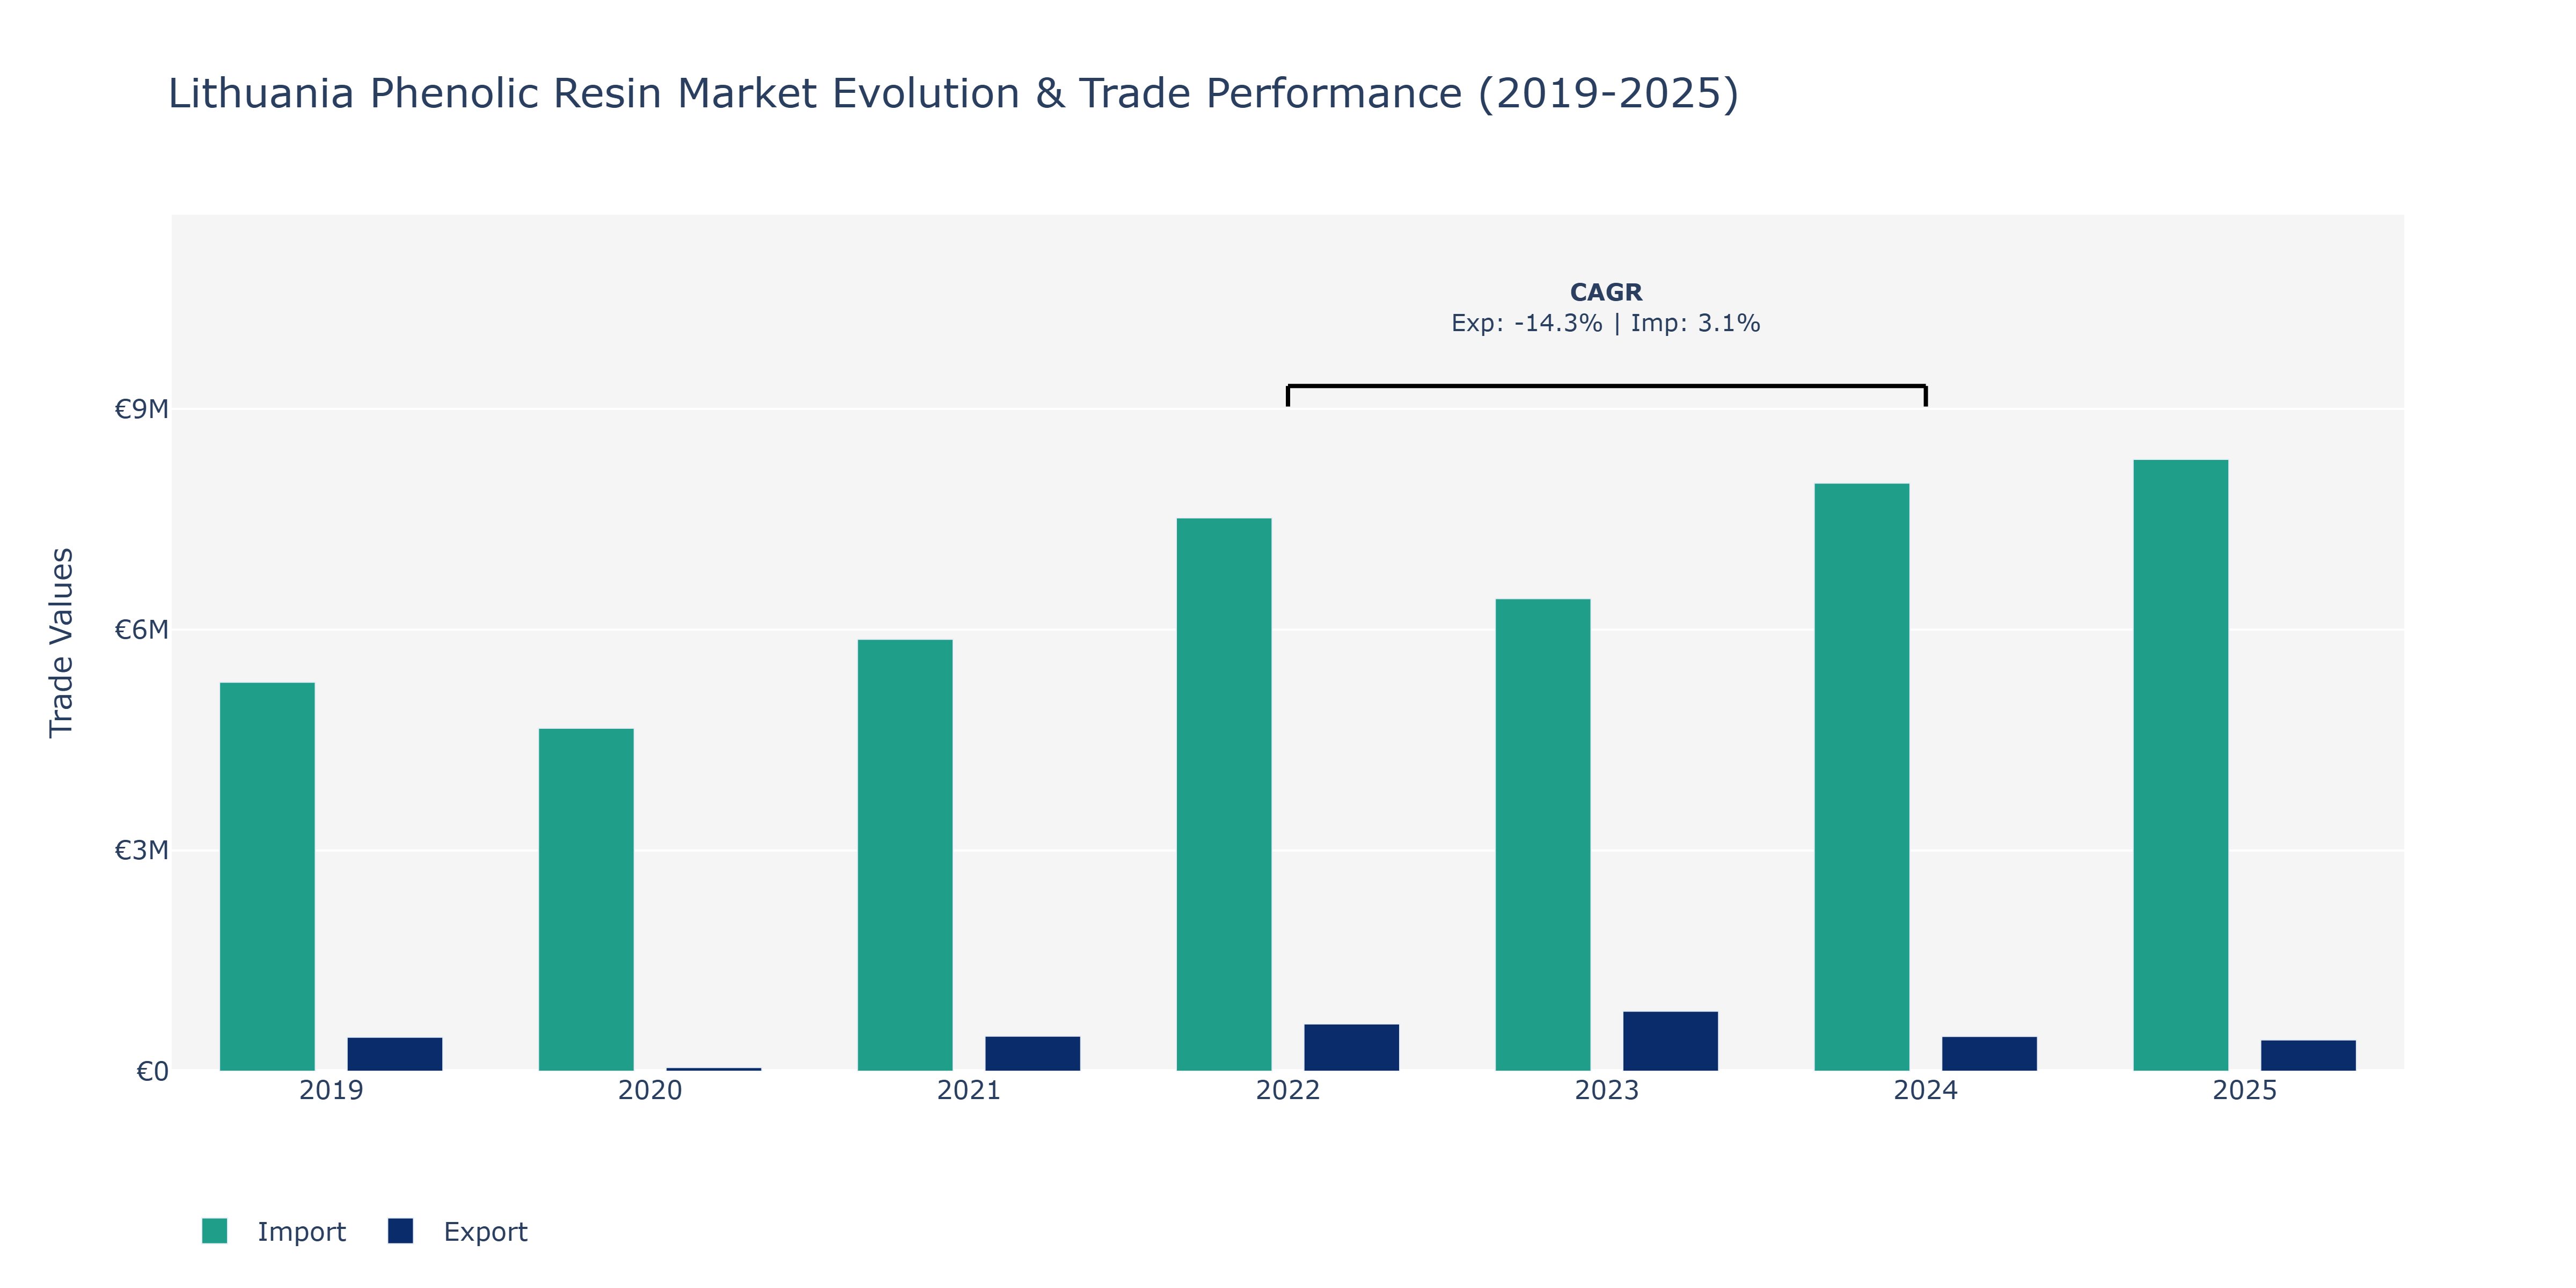
Lithuania's Phenolic Resin Market saw varied trends in Exports and Imports between 2019 and 2025. Exports started at €462.17 thousand in 2019, declined sharply in 2020 to €48.87 thousand, then showed a recovery in 2021, reaching €475.64 thousand. The peak was observed in 2023 at €815.38 thousand, followed by a drop in 2024 to €472.07 thousand, and further to €425.19 thousand in 2025. On the other hand, Imports began at a high of €5.29 million in 2019, decreased in 2020 to €4.66 million, and then consistently increased annually, reaching €8.31 million in 2025. The fluctuations in Exports could be attributed to changing demand dynamics, varying production capacities, and global market conditions affecting trade partnerships. The upward trend in Imports reflects a growing need for raw materials for local manufacturing processes and the increasing demand for phenolic resin-based products in Lithuania's industrial sectors.
Key Highlights of the Report:
- Lithuania Phenolic Resin Market Outlook
- Market Size of Lithuania Phenolic Resin Market, 2025
- Forecast of Lithuania Phenolic Resin Market, 2032
- Historical Data and Forecast of Lithuania Phenolic Resin Revenues & Volume for the Period 2022 - 2032F
- Lithuania Phenolic Resin Market Trend Evolution
- Lithuania Phenolic Resin Market Drivers and Challenges
- Lithuania Phenolic Resin Price Trends
- Lithuania Phenolic Resin Porter`s Five Forces
- Lithuania Phenolic Resin Industry Life Cycle
- Historical Data and Forecast of Lithuania Phenolic Resin Market Revenues & Volume By Type for the Period 2022 - 2032F
- Historical Data and Forecast of Lithuania Phenolic Resin Market Revenues & Volume By Resol for the Period 2022 - 2032F
- Historical Data and Forecast of Lithuania Phenolic Resin Market Revenues & Volume By Novolac for the Period 2022 - 2032F
- Historical Data and Forecast of Lithuania Phenolic Resin Market Revenues & Volume By Application for the Period 2022 - 2032F
- Historical Data and Forecast of Lithuania Phenolic Resin Market Revenues & Volume By Wood Adhesives for the Period 2022 - 2032F
- Historical Data and Forecast of Lithuania Phenolic Resin Market Revenues & Volume By Laminates for the Period 2022 - 2032F
- Historical Data and Forecast of Lithuania Phenolic Resin Market Revenues & Volume By Foundry & Moldings for the Period 2022 - 2032F
- Historical Data and Forecast of Lithuania Phenolic Resin Market Revenues & Volume By Paper Impregnation for the Period 2022 - 2032F
- Historical Data and Forecast of Lithuania Phenolic Resin Market Revenues & Volume By Coatings for the Period 2022 - 2032F
- Historical Data and Forecast of Lithuania Phenolic Resin Market Revenues & Volume By Insulations for the Period 2022 - 2032F
- Lithuania Phenolic Resin Import Export Trade Statistics
- Market Opportunity Assessment By Type
- Market Opportunity Assessment By Application
- Lithuania Phenolic Resin Top Companies Market Share
- Lithuania Phenolic Resin Competitive Benchmarking By Technical and Operational Parameters
- Lithuania Phenolic Resin Company Profiles
- Lithuania Phenolic Resin Key Strategic Recommendations
Frequently Asked Questions About the Market Study (FAQs):
6Wresearch actively monitors the Lithuania Phenolic Resin Market and publishes its comprehensive annual report, highlighting emerging trends, growth drivers, revenue analysis, and forecast outlook. Our insights help businesses to make data-backed strategic decisions with ongoing market dynamics. Our analysts track relevent industries related to the Lithuania Phenolic Resin Market, allowing our clients with actionable intelligence and reliable forecasts tailored to emerging regional needs.
Yes, we provide customisation as per your requirements. To learn more, feel free to contact us on sales@6wresearch.com
1 Executive Summary |
2 Introduction |
2.1 Key Highlights of the Report |
2.2 Report Description |
2.3 Market Scope & Segmentation |
2.4 Research Methodology |
2.5 Assumptions |
3 Lithuania Phenolic Resin Market Overview |
3.1 Lithuania Country Macro Economic Indicators |
3.2 Lithuania Phenolic Resin Market Revenues & Volume, 2022 & 2032F |
3.3 Lithuania Phenolic Resin Market - Industry Life Cycle |
3.4 Lithuania Phenolic Resin Market - Porter's Five Forces |
3.5 Lithuania Phenolic Resin Market Revenues & Volume Share, By Type, 2022 & 2032F |
3.6 Lithuania Phenolic Resin Market Revenues & Volume Share, By Application, 2022 & 2032F |
4 Lithuania Phenolic Resin Market Dynamics |
4.1 Impact Analysis |
4.2 Market Drivers |
4.2.1 Growing demand from end-use industries such as construction, automotive, and electronics. |
4.2.2 Increasing focus on sustainable and eco-friendly materials. |
4.2.3 Favorable government initiatives and regulations promoting the use of phenolic resin. |
4.3 Market Restraints |
4.3.1 Fluctuating raw material prices impacting production costs. |
4.3.2 Competition from alternative materials like epoxy resins and polyurethanes. |
4.3.3 Volatility in global economic conditions affecting market growth. |
5 Lithuania Phenolic Resin Market Trends |
6 Lithuania Phenolic Resin Market Segmentations |
6.1 Lithuania Phenolic Resin Market, By Type |
6.1.1 Overview and Analysis |
6.1.2 Lithuania Phenolic Resin Market Revenues & Volume, By Resol, 2022 - 2032F |
6.1.3 Lithuania Phenolic Resin Market Revenues & Volume, By Novolac, 2022 - 2032F |
6.2 Lithuania Phenolic Resin Market, By Application |
6.2.1 Overview and Analysis |
6.2.2 Lithuania Phenolic Resin Market Revenues & Volume, By Wood Adhesives, 2022 - 2032F |
6.2.3 Lithuania Phenolic Resin Market Revenues & Volume, By Laminates, 2022 - 2032F |
6.2.4 Lithuania Phenolic Resin Market Revenues & Volume, By Foundry & Moldings, 2022 - 2032F |
6.2.5 Lithuania Phenolic Resin Market Revenues & Volume, By Paper Impregnation, 2022 - 2032F |
6.2.6 Lithuania Phenolic Resin Market Revenues & Volume, By Coatings, 2022 - 2032F |
6.2.7 Lithuania Phenolic Resin Market Revenues & Volume, By Insulations, 2022 - 2032F |
7 Lithuania Phenolic Resin Market Import-Export Trade Statistics |
7.1 Lithuania Phenolic Resin Market Export to Major Countries |
7.2 Lithuania Phenolic Resin Market Imports from Major Countries |
8 Lithuania Phenolic Resin Market Key Performance Indicators |
8.1 Research and development investment in new phenolic resin technologies. |
8.2 Number of new product launches in the phenolic resin market. |
8.3 Adoption rate of phenolic resin in key industries such as construction and automotive. |
9 Lithuania Phenolic Resin Market - Opportunity Assessment |
9.1 Lithuania Phenolic Resin Market Opportunity Assessment, By Type, 2022 & 2032F |
9.2 Lithuania Phenolic Resin Market Opportunity Assessment, By Application, 2022 & 2032F |
10 Lithuania Phenolic Resin Market - Competitive Landscape |
10.1 Lithuania Phenolic Resin Market Revenue Share, By Companies, 2025 |
10.2 Lithuania Phenolic Resin Market Competitive Benchmarking, By Operating and Technical Parameters |
11 Company Profiles |
12 Recommendations | 13 Disclaimer |
Export potential assessment - trade Analytics for 2030
Export potential enables firms to identify high-growth global markets with greater confidence by combining advanced trade intelligence with a structured quantitative methodology. The framework analyzes emerging demand trends and country-level import patterns while integrating macroeconomic and trade datasets such as GDP and population forecasts, bilateral import–export flows, tariff structures, elasticity differentials between developed and developing economies, geographic distance, and import demand projections. Using weighted trade values from 2020–2024 as the base period to project country-to-country export potential for 2030, these inputs are operationalized through calculated drivers such as gravity model parameters, tariff impact factors, and projected GDP per-capita growth. Through an analysis of hidden potentials, demand hotspots, and market conditions that are most favorable to success, this method enables firms to focus on target countries, maximize returns, and global expansion with data, backed by accuracy.
By factoring in the projected importer demand gap that is currently unmet and could be potential opportunity, it identifies the potential for the Exporter (Country) among 190 countries, against the general trade analysis, which identifies the biggest importer or exporter.
To discover high-growth global markets and optimize your business strategy:
Click Here
Pricing
- Single User License$ 1,995
- Department License$ 2,400
- Site License$ 3,120
- Global License$ 3,795

Search
Thought Leadership and Analyst Meet


Our Clients
Latest Reports
- India Ultrasonic Smart Water Meter Market (2026-2032) | Outlook, Competition, Drivers, Trends, Demand, Competitive, Strategic Insights, Companies, Challenges, Strategy, Consumer Insights, Analysis, Opportunities, Growth, Size, Share, Industry, Revenue, Segments, Value, Segmentation, Supply, Forecast, Restraints,
- India Electromagnetic Bulk Flow Meter Market (2026-2032) | Analysis, Challenges, Strategic Insights, Supply, Forecast, Growth, Share, Consumer Insights, Competitive, Value, Outlook, Size & Demand,
- India Battery Powered Bulk Flow Meter Market (2026-2032) | Outlook, Analysis, Competitive Landscape, Growth, Size, Trends, Value, Revenue, Companies, Segmentation, Share & Forecast
- Bosnia and Herzegovina Fuel-Efficient Winglets Market (2026-2032) | Growth, Competition, Strategy, Restraints, Trends, Challenges, segmentation, Value, Outlook, Investment Opportunities, Analysis, Revenue, Companies, Insights, Pricing, Size, Drivers, Demand, Share, Forecast
- Canada Cloud CFD Market (2026-2032) | Size & Revenue, Industry, Growth, Competitive Landscape, Forecast, Segmentation, Value, Outlook, Trends, Share, Analysis, Companies
- Taiwan Food Delivery Platform Market (2026-2032) | Companies, Outlook, Analysis, Trends, Value, Revenue, Segmentation, Share, Forecast, Competitive Landscape, Growth, Size & Forecast
- United Kingdom (UK) Long-term Care Insurance Market (2026-2032) | Growth, Share, Consumer Insights, Drivers, Opportunities, Competition, Pricing Analysis, Segments, Restraints, Companies, Competitive, Value, Outlook, Size, Demand, Analysis, Challenges, Strategic Insights, Investment Trends, Revenue, Trends, Supply, Forecast
- United Kingdom (UK) Long Term Care Market (2026-2032) | Companies, Outlook, Analysis, Trends, Value, Revenue, Segmentation, Share, Forecast, Competitive Landscape, Growth, Size & Forecast
- Iraq Insulation and Waterproofing Market (2026-2032) | Outlook, Drivers, Growth, Size, Share, Industry, Revenue, Trends, Demand, Competitive, Strategic Insights, Opportunities, Segments, Companies, Challenges, Strategy, Consumer Insights, Analysis, Investment Trends, Value, Segmentation, Forecast, Restraints
- India Switchgear Market Outlook (2026-2032) | Size, Share, Trends, Growth, Revenue, Forecast, Analysis, Value, Outlook
Industry Events and Analyst Meet

India EV Show 2026

EV tech India Expo 2026

Auto Tech Asia 2026

Battery Tech India 2026

Smart Production Solutions Guangzhou 2026
Whitepaper
- Middle East & Africa Commercial Security Market Click here to view more.
- Middle East & Africa Fire Safety Systems & Equipment Market Click here to view more.
- GCC Drone Market Click here to view more.
- Middle East Lighting Fixture Market Click here to view more.
- GCC Physical & Perimeter Security Market Click here to view more.
6WResearch In News
- Doha a strategic location for EV manufacturing hub: IPA Qatar
- Demand for luxury TVs surging in the GCC, says Samsung
- Empowering Growth: The Thriving Journey of Bangladesh’s Cable Industry
- Demand for luxury TVs surging in the GCC, says Samsung
- Video call with a traditional healer? Once unthinkable, it’s now common in South Africa
- Intelligent Buildings To Smooth GCC’s Path To Net Zero