Lithuania Pipe Market (2026-2032) | Competitive Landscape, Segmentation, Analysis, Forecast, Value, Industry, Size & Revenue, Companies, Share, Growth, Trends, Outlook
Market Forecast By Material (Concrete, Thermoset and composite, Metal, Thermoplastic), By Diameter (DN upto 50 mm, DN 51 to 150 mm, DN 151 to 300 mm, DN 301 to 500 mm, DN above 501 mm), By Application (Water and wastewater, Industrial, Oil and gas, Other) And Competitive Landscape
| Product Code: ETC8048521 | Publication Date: Sep 2024 | Updated Date: Apr 2026 | Product Type: Market Research Report | |
| Publisher: 6Wresearch | Author: Dhaval Chaurasia | No. of Pages: 75 | No. of Figures: 35 | No. of Tables: 20 |
Lithuania Pipe Market Size (2020-2030)
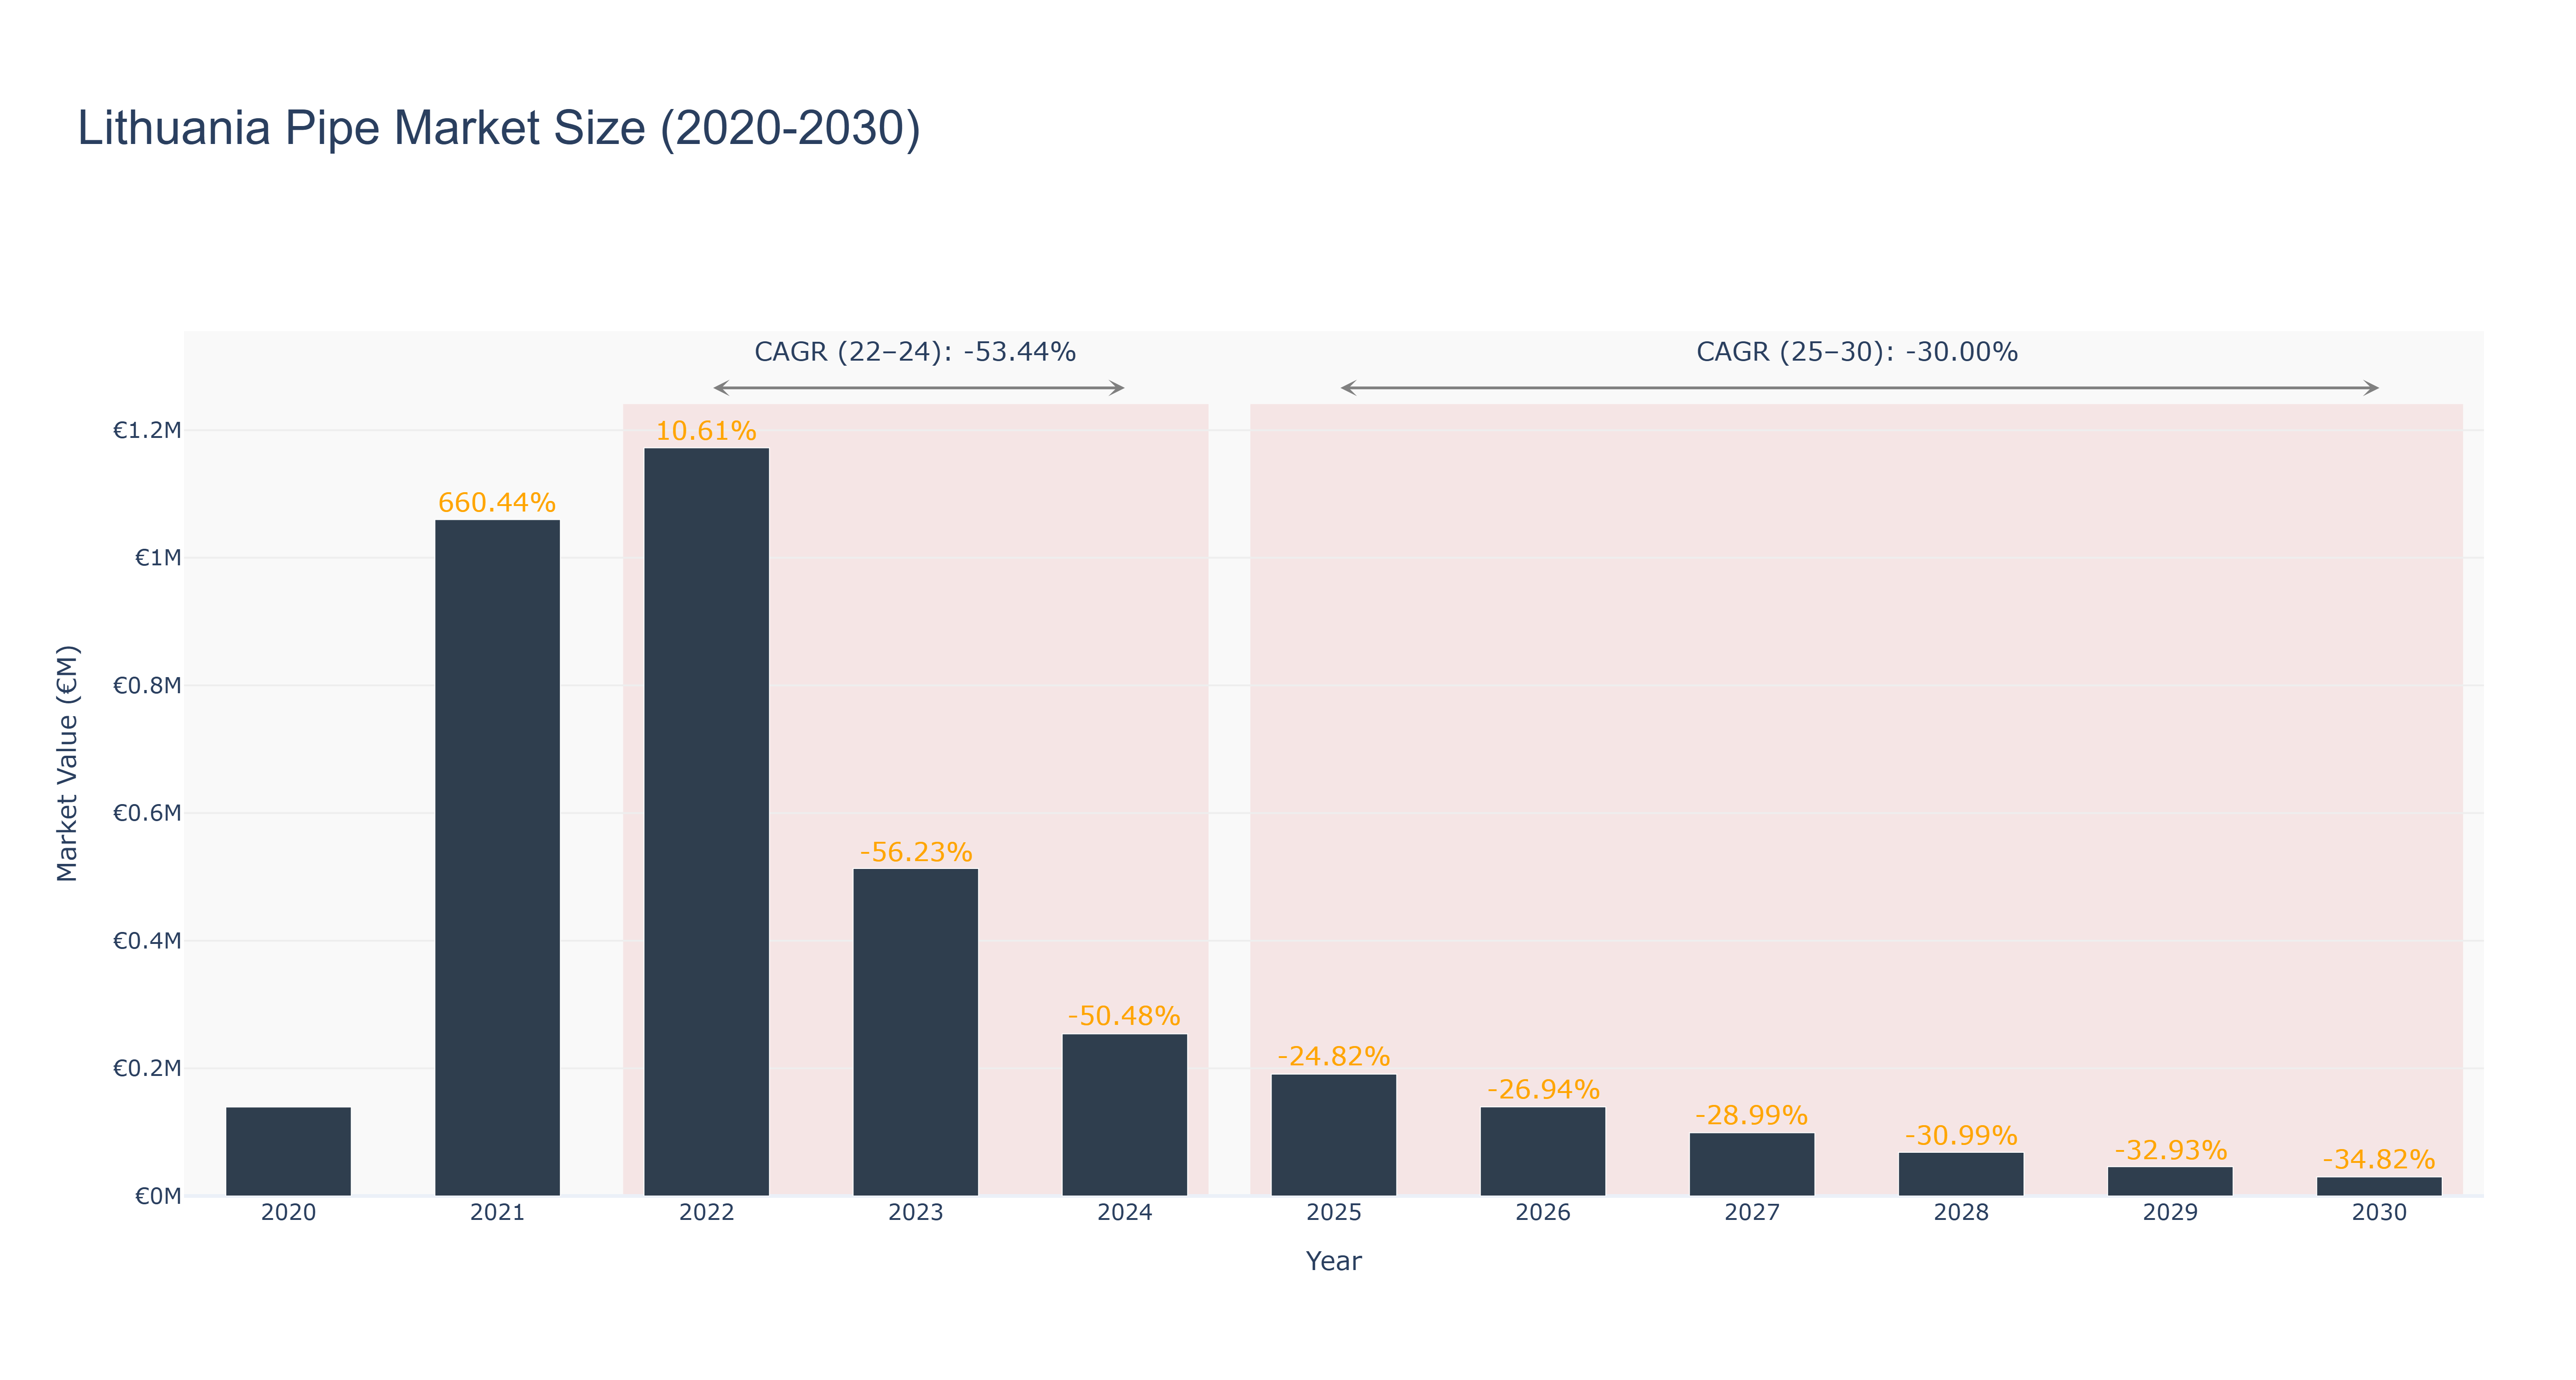
The Lithuania Pipe Market experienced a peak market size of €1.17 million in 2022, followed by a decline to €0.25 million in 2024. The market is forecasted to further decrease to €0.03 million by 2030, with a CAGR of -30.0% from 2025 to 2030. The significant downturn in market size can be attributed to various factors such as economic fluctuations, changing consumer preferences, and increased competition. Despite the current challenges, the industry drivers like technological advancements and sustainability initiatives are expected to play a crucial role in reshaping the market landscape. Looking ahead, upcoming infrastructure projects in Lithuania focusing on pipeline modernization and expansion are anticipated to drive growth and innovation in the Lithuania Pipe Market, presenting opportunities for market players to capitalize on emerging trends and enhance their market position.
Lithuania Pipe Market: Production & Trade Performance (2019-2025)
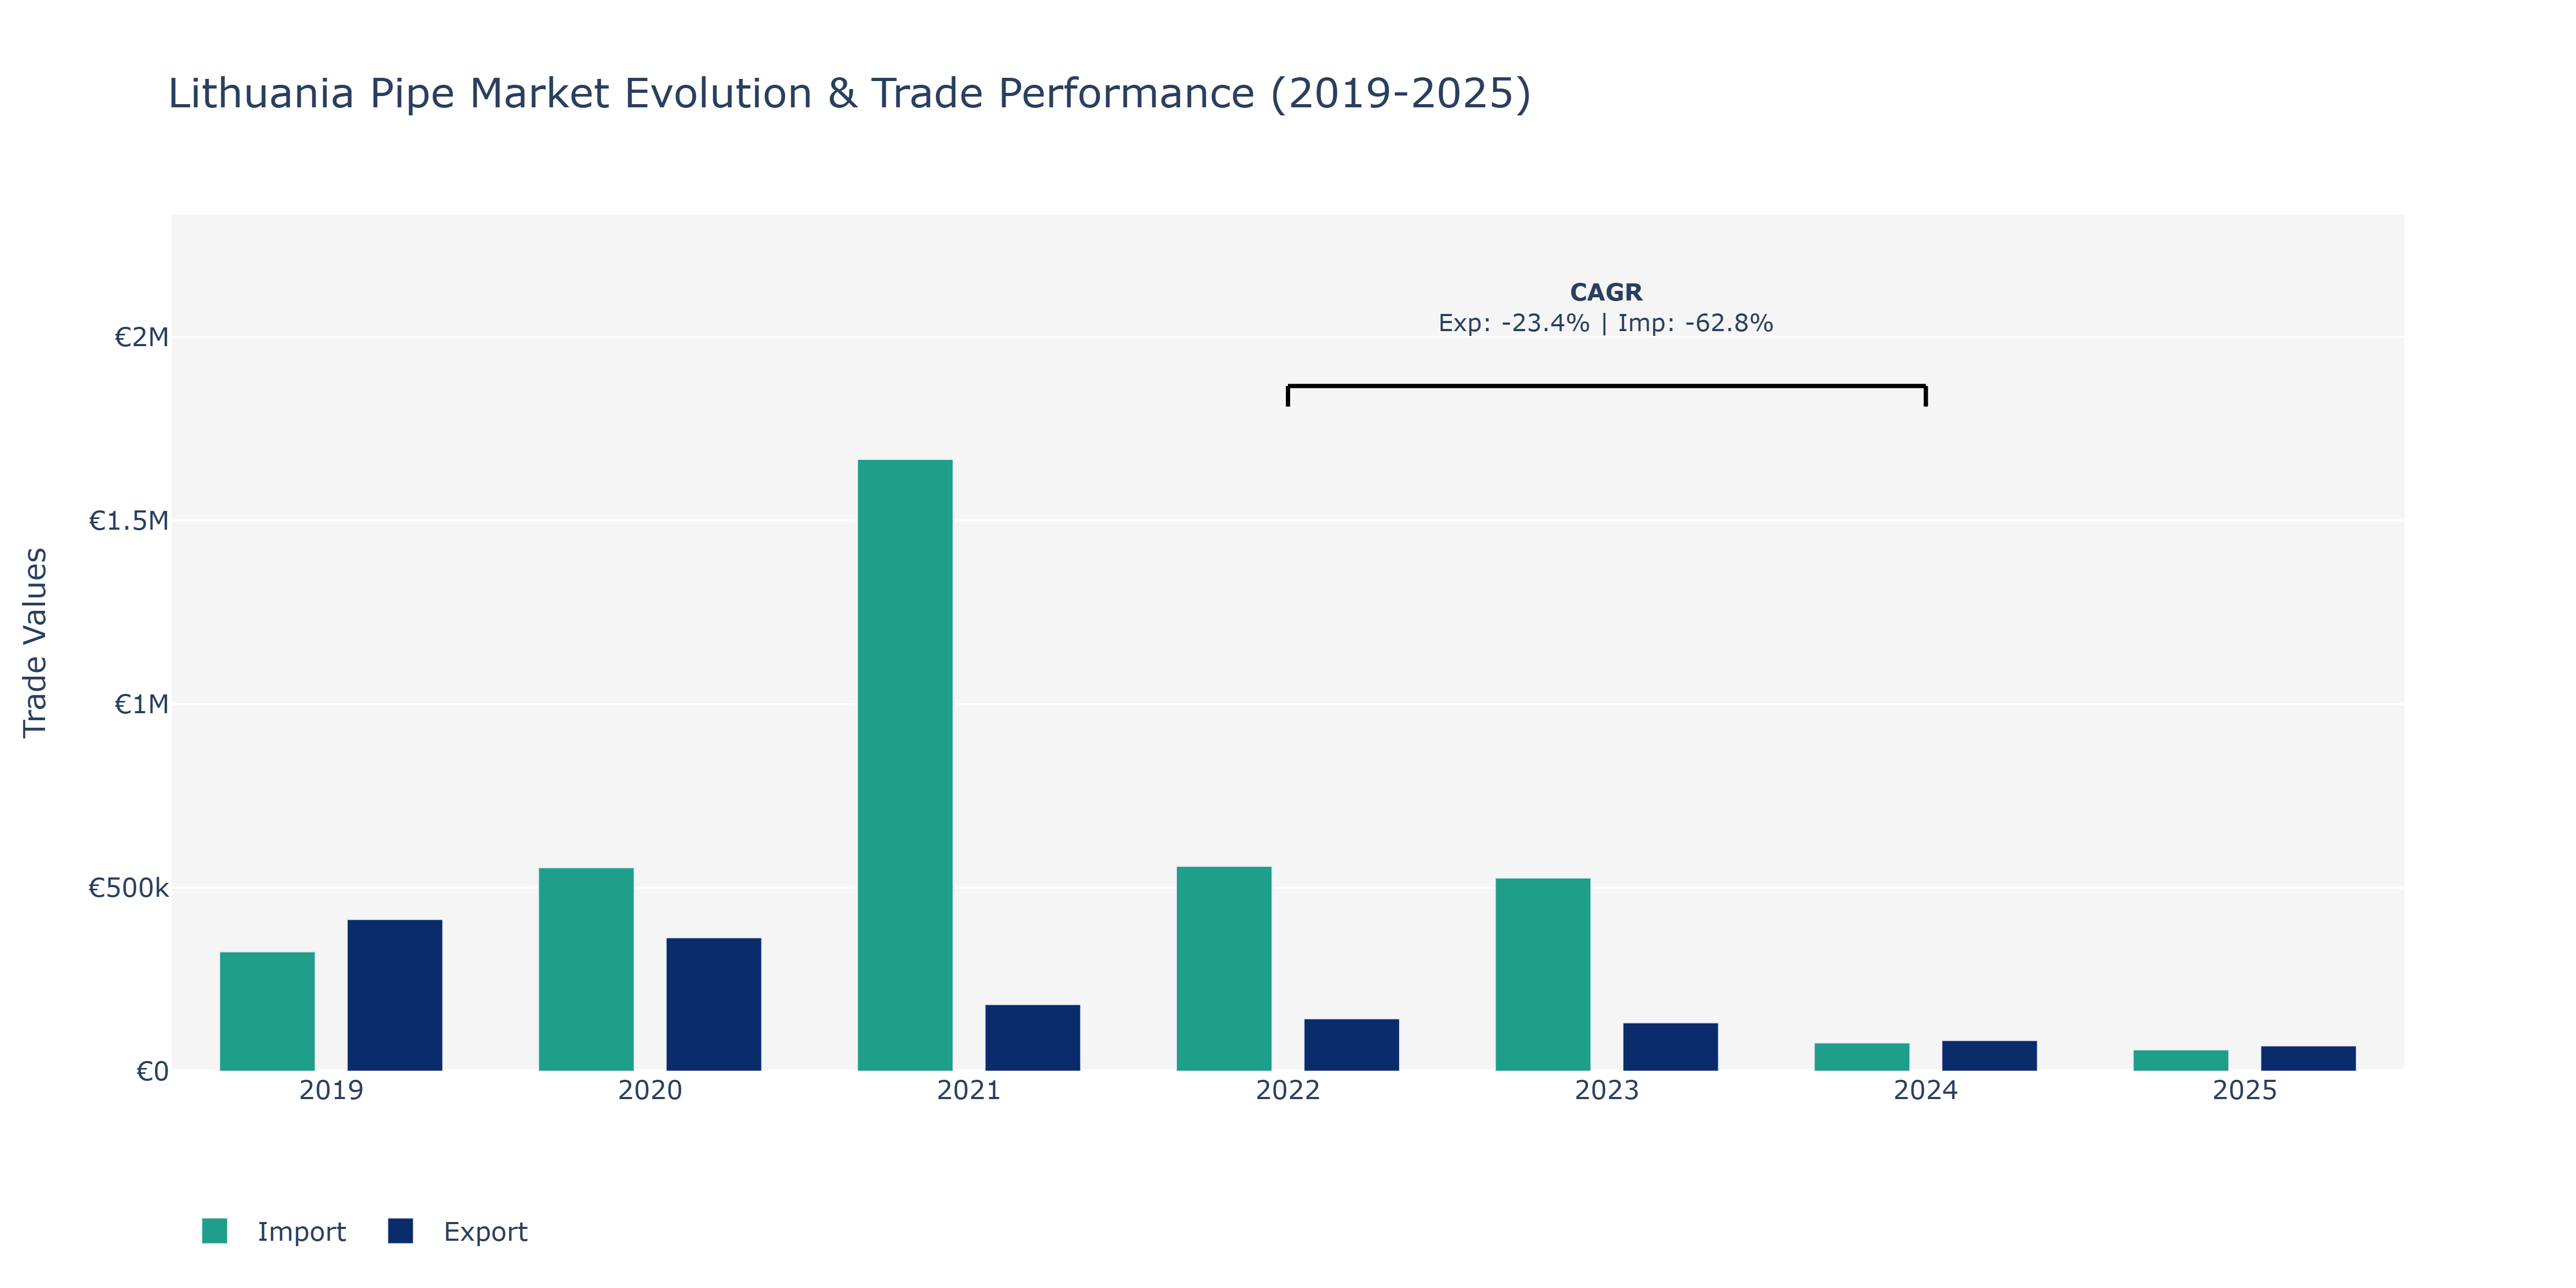
In the Lithuania Pipe Market, exports experienced a gradual decline from €413.3 thousand in 2019 to €69.11 thousand in 2025. Import value, on the other hand, fluctuated notably, with a peak of €1.67 million in 2021 followed by a decrease to €57.92 thousand in 2025. The decline in exports can be attributed to a reduction in demand for Lithuanian pipe products in international markets, possibly due to evolving consumer preferences or increased competition from other suppliers. In contrast, the fluctuations in imports could be influenced by changes in domestic infrastructure projects or shifts in global trade dynamics impacting the sourcing strategies of importers. The substantial decrease in import values from 2021 to 2025 may indicate a shift towards domestic production or sourcing from alternative markets, reflecting evolving trade patterns in the region.
Key Highlights of the Report:
- Lithuania Pipe Market Outlook
- Market Size of Lithuania Pipe Market, 2025
- Forecast of Lithuania Pipe Market, 2032
- Historical Data and Forecast of Lithuania Pipe Revenues & Volume for the Period 2022 - 2032
- Lithuania Pipe Market Trend Evolution
- Lithuania Pipe Market Drivers and Challenges
- Lithuania Pipe Price Trends
- Lithuania Pipe Porter's Five Forces
- Lithuania Pipe Industry Life Cycle
- Historical Data and Forecast of Lithuania Pipe Market Revenues & Volume By Material for the Period 2022 - 2032
- Historical Data and Forecast of Lithuania Pipe Market Revenues & Volume By Concrete for the Period 2022 - 2032
- Historical Data and Forecast of Lithuania Pipe Market Revenues & Volume By Thermoset and composite for the Period 2022 - 2032
- Historical Data and Forecast of Lithuania Pipe Market Revenues & Volume By Metal for the Period 2022 - 2032
- Historical Data and Forecast of Lithuania Pipe Market Revenues & Volume By Thermoplastic for the Period 2022 - 2032
- Historical Data and Forecast of Lithuania Pipe Market Revenues & Volume By Diameter for the Period 2022 - 2032
- Historical Data and Forecast of Lithuania Pipe Market Revenues & Volume By DN upto 50 mm for the Period 2022 - 2032
- Historical Data and Forecast of Lithuania Pipe Market Revenues & Volume By DN 51 to 150 mm for the Period 2022 - 2032
- Historical Data and Forecast of Lithuania Pipe Market Revenues & Volume By DN 151 to 300 mm for the Period 2022 - 2032
- Historical Data and Forecast of Lithuania Pipe Market Revenues & Volume By DN 301 to 500 mm for the Period 2022 - 2032
- Historical Data and Forecast of Lithuania Pipe Market Revenues & Volume By DN above 501 mm for the Period 2022 - 2032
- Historical Data and Forecast of Lithuania Pipe Market Revenues & Volume By Application for the Period 2022 - 2032
- Historical Data and Forecast of Lithuania Pipe Market Revenues & Volume By Water and wastewater for the Period 2022 - 2032
- Historical Data and Forecast of Lithuania Pipe Market Revenues & Volume By Industrial for the Period 2022 - 2032
- Historical Data and Forecast of Lithuania Pipe Market Revenues & Volume By Oil and gas for the Period 2022 - 2032
- Historical Data and Forecast of Lithuania Pipe Market Revenues & Volume By Other for the Period 2022 - 2032
- Lithuania Pipe Import Export Trade Statistics
- Market Opportunity Assessment By Material
- Market Opportunity Assessment By Diameter
- Market Opportunity Assessment By Application
- Lithuania Pipe Top Companies Market Share
- Lithuania Pipe Competitive Benchmarking By Technical and Operational Parameters
- Lithuania Pipe Company Profiles
- Lithuania Pipe Key Strategic Recommendations
Frequently Asked Questions About the Market Study (FAQs):
6Wresearch actively monitors the Lithuania Pipe Market and publishes its comprehensive annual report, highlighting emerging trends, growth drivers, revenue analysis, and forecast outlook. Our insights help businesses to make data-backed strategic decisions with ongoing market dynamics. Our analysts track relevent industries related to the Lithuania Pipe Market, allowing our clients with actionable intelligence and reliable forecasts tailored to emerging regional needs.
Yes, we provide customisation as per your requirements. To learn more, feel free to contact us on sales@6wresearch.com
1 Executive Summary |
2 Introduction |
2.1 Key Highlights of the Report |
2.2 Report Description |
2.3 Market Scope & Segmentation |
2.4 Research Methodology |
2.5 Assumptions |
3 Lithuania Pipe Market Overview |
3.1 Lithuania Country Macro Economic Indicators |
3.2 Lithuania Pipe Market Revenues & Volume, 2022 & 2032F |
3.3 Lithuania Pipe Market - Industry Life Cycle |
3.4 Lithuania Pipe Market - Porter's Five Forces |
3.5 Lithuania Pipe Market Revenues & Volume Share, By Material, 2022 & 2032F |
3.6 Lithuania Pipe Market Revenues & Volume Share, By Diameter, 2022 & 2032F |
3.7 Lithuania Pipe Market Revenues & Volume Share, By Application, 2022 & 2032F |
4 Lithuania Pipe Market Dynamics |
4.1 Impact Analysis |
4.2 Market Drivers |
4.2.1 Increasing infrastructure development projects in Lithuania |
4.2.2 Growing demand for water management and wastewater treatment systems |
4.2.3 Government initiatives promoting sustainable and efficient pipe systems |
4.3 Market Restraints |
4.3.1 Fluctuating raw material prices affecting production costs |
4.3.2 Competition from alternative materials such as PVC and composite pipes |
4.3.3 Economic instability impacting investment in construction projects |
5 Lithuania Pipe Market Trends |
6 Lithuania Pipe Market, By Types |
6.1 Lithuania Pipe Market, By Material |
6.1.1 Overview and Analysis |
6.1.2 Lithuania Pipe Market Revenues & Volume, By Material, 2022 - 2032F |
6.1.3 Lithuania Pipe Market Revenues & Volume, By Concrete, 2022 - 2032F |
6.1.4 Lithuania Pipe Market Revenues & Volume, By Thermoset and composite, 2022 - 2032F |
6.1.5 Lithuania Pipe Market Revenues & Volume, By Metal, 2022 - 2032F |
6.1.6 Lithuania Pipe Market Revenues & Volume, By Thermoplastic, 2022 - 2032F |
6.2 Lithuania Pipe Market, By Diameter |
6.2.1 Overview and Analysis |
6.2.2 Lithuania Pipe Market Revenues & Volume, By DN upto 50 mm, 2022 - 2032F |
6.2.3 Lithuania Pipe Market Revenues & Volume, By DN 51 to 150 mm, 2022 - 2032F |
6.2.4 Lithuania Pipe Market Revenues & Volume, By DN 151 to 300 mm, 2022 - 2032F |
6.2.5 Lithuania Pipe Market Revenues & Volume, By DN 301 to 500 mm, 2022 - 2032F |
6.2.6 Lithuania Pipe Market Revenues & Volume, By DN above 501 mm, 2022 - 2032F |
6.3 Lithuania Pipe Market, By Application |
6.3.1 Overview and Analysis |
6.3.2 Lithuania Pipe Market Revenues & Volume, By Water and wastewater, 2022 - 2032F |
6.3.3 Lithuania Pipe Market Revenues & Volume, By Industrial, 2022 - 2032F |
6.3.4 Lithuania Pipe Market Revenues & Volume, By Oil and gas, 2022 - 2032F |
6.3.5 Lithuania Pipe Market Revenues & Volume, By Other, 2022 - 2032F |
7 Lithuania Pipe Market Import-Export Trade Statistics |
7.1 Lithuania Pipe Market Export to Major Countries |
7.2 Lithuania Pipe Market Imports from Major Countries |
8 Lithuania Pipe Market Key Performance Indicators |
8.1 Adoption rate of advanced pipe technologies in Lithuania |
8.2 Percentage of infrastructure projects using high-quality piping systems |
8.3 Investment in research and development for innovative pipe materials and designs |
9 Lithuania Pipe Market - Opportunity Assessment |
9.1 Lithuania Pipe Market Opportunity Assessment, By Material, 2022 & 2032F |
9.2 Lithuania Pipe Market Opportunity Assessment, By Diameter, 2022 & 2032F |
9.3 Lithuania Pipe Market Opportunity Assessment, By Application, 2022 & 2032F |
10 Lithuania Pipe Market - Competitive Landscape |
10.1 Lithuania Pipe Market Revenue Share, By Companies, 2025 |
10.2 Lithuania Pipe Market Competitive Benchmarking, By Operating and Technical Parameters |
11 Company Profiles |
12 Recommendations |
13 Disclaimer |
Export potential assessment - trade Analytics for 2030
Export potential enables firms to identify high-growth global markets with greater confidence by combining advanced trade intelligence with a structured quantitative methodology. The framework analyzes emerging demand trends and country-level import patterns while integrating macroeconomic and trade datasets such as GDP and population forecasts, bilateral import–export flows, tariff structures, elasticity differentials between developed and developing economies, geographic distance, and import demand projections. Using weighted trade values from 2020–2024 as the base period to project country-to-country export potential for 2030, these inputs are operationalized through calculated drivers such as gravity model parameters, tariff impact factors, and projected GDP per-capita growth. Through an analysis of hidden potentials, demand hotspots, and market conditions that are most favorable to success, this method enables firms to focus on target countries, maximize returns, and global expansion with data, backed by accuracy.
By factoring in the projected importer demand gap that is currently unmet and could be potential opportunity, it identifies the potential for the Exporter (Country) among 190 countries, against the general trade analysis, which identifies the biggest importer or exporter.
To discover high-growth global markets and optimize your business strategy:
Click Here
Pricing
- Single User License$ 1,995
- Department License$ 2,400
- Site License$ 3,120
- Global License$ 3,795

Search
Thought Leadership and Analyst Meet


Our Clients
Latest Reports
- France Thermally Conductive Filler Dispersants Market (2026-2032) | Challenges, Restraints, Value, Share, Size, segmentation, Analysis, Trends, Investment Opportunities, Outlook, Pricing, Demand, Forecast, Revenue, Companies, Growth, Drivers, Strategy, Insights, Competition
- Egypt Thermally Conductive Filler Dispersants Market (2026-2032) | Competition, Forecast, Strategy, Value, Insights, Outlook, Investment Opportunities, Pricing, Demand, Share, segmentation, Drivers, Size, Companies, Restraints, Growth, Trends, Revenue, Challenges, Analysis
- Czech Republic Thermally Conductive Filler Dispersants Market (2026-2032) | Forecast, Pricing, Analysis, Drivers, Insights, Size, Demand, Growth, Challenges, segmentation, Competition, Outlook, Trends, Investment Opportunities, Companies, Strategy, Revenue, Share, Value, Restraints
- Colombia Thermally Conductive Filler Dispersants Market (2026-2032) | segmentation, Trends, Share, Drivers, Strategy, Companies, Demand, Insights, Size, Challenges, Value, Competition, Analysis, Growth, Revenue, Restraints, Forecast, Pricing, Outlook, Investment Opportunities
- China Thermally Conductive Filler Dispersants Market (2026-2032) | Restraints, Investment Opportunities, Pricing, Companies, Share, Size, Challenges, Trends, Outlook, Value, Analysis, Competition, Revenue, Drivers, Forecast, Demand, Insights, Growth, Strategy, segmentation
- Chile Thermally Conductive Filler Dispersants Market (2026-2032) | Investment Opportunities, Trends, Value, Restraints, Share, Companies, Forecast, segmentation, Pricing, Challenges, Demand, Size, Analysis, Drivers, Outlook, Growth, Competition, Strategy, Revenue, Insights
- Cambodia Thermally Conductive Filler Dispersants Market (2026-2032) | Analysis, Share, Outlook, Strategy, Pricing, Demand, Size, Growth, segmentation, Insights, Revenue, Forecast, Challenges, Competition, Companies, Investment Opportunities, Trends, Restraints, Value, Drivers
- Brazil Thermally Conductive Filler Dispersants Market (2026-2032) | Restraints, Forecast, Competition, Size, Revenue, Value, Investment Opportunities, Trends, Insights, Outlook, Growth, Analysis, Drivers, segmentation, Pricing, Challenges, Strategy, Share, Companies, Demand
- Bangladesh Thermally Conductive Filler Dispersants Market (2026-2032) | Restraints, Trends, Analysis, Competition, Insights, Forecast, Value, Investment Opportunities, Pricing, Share, Demand, Outlook, Revenue, segmentation, Companies, Drivers, Growth, Size, Challenges, Strategy
- Bahrain Thermally Conductive Filler Dispersants Market (2026-2032) | Trends, Outlook, Pricing, Demand, Value, Competition, Forecast, Growth, segmentation, Revenue, Companies, Analysis, Insights, Size, Drivers, Challenges, Strategy, Investment Opportunities, Share, Restraints
Industry Events and Analyst Meet

HIMTEX 2026

India Refining Summit 2026

India EV Show 2026

EV tech India Expo 2026

Auto Tech Asia 2026
Whitepaper
- Middle East & Africa Commercial Security Market Click here to view more.
- Middle East & Africa Fire Safety Systems & Equipment Market Click here to view more.
- GCC Drone Market Click here to view more.
- Middle East Lighting Fixture Market Click here to view more.
- GCC Physical & Perimeter Security Market Click here to view more.
6WResearch In News
- Doha a strategic location for EV manufacturing hub: IPA Qatar
- Demand for luxury TVs surging in the GCC, says Samsung
- Empowering Growth: The Thriving Journey of Bangladesh’s Cable Industry
- Demand for luxury TVs surging in the GCC, says Samsung
- Video call with a traditional healer? Once unthinkable, it’s now common in South Africa
- Intelligent Buildings To Smooth GCC’s Path To Net Zero