Lithuania Plastic Dispensing Caps Market (2026-2032) | Value, Segmentation, Industry, Outlook, Analysis, Forecast, Trends, Companies, Growth, Share, Competitive Landscape, Size & Revenue
Market Forecast By Products (Screw-on Caps, Dispensing Caps), By Technology (Injection Molding, Compression Molding, Post-mold TE Band), By Materials (PET, PP, HDPE, LDPE, Other), By End-User (Beverage, Pharmaceutical, Cosmetics, Others) And Competitive Landscape
| Product Code: ETC8048662 | Publication Date: Sep 2024 | Updated Date: Apr 2026 | Product Type: Market Research Report | |
| Publisher: 6Wresearch | Author: Summon Dutta | No. of Pages: 75 | No. of Figures: 35 | No. of Tables: 20 |
Lithuania Plastic Dispensing Caps Market Size (2020-2030)
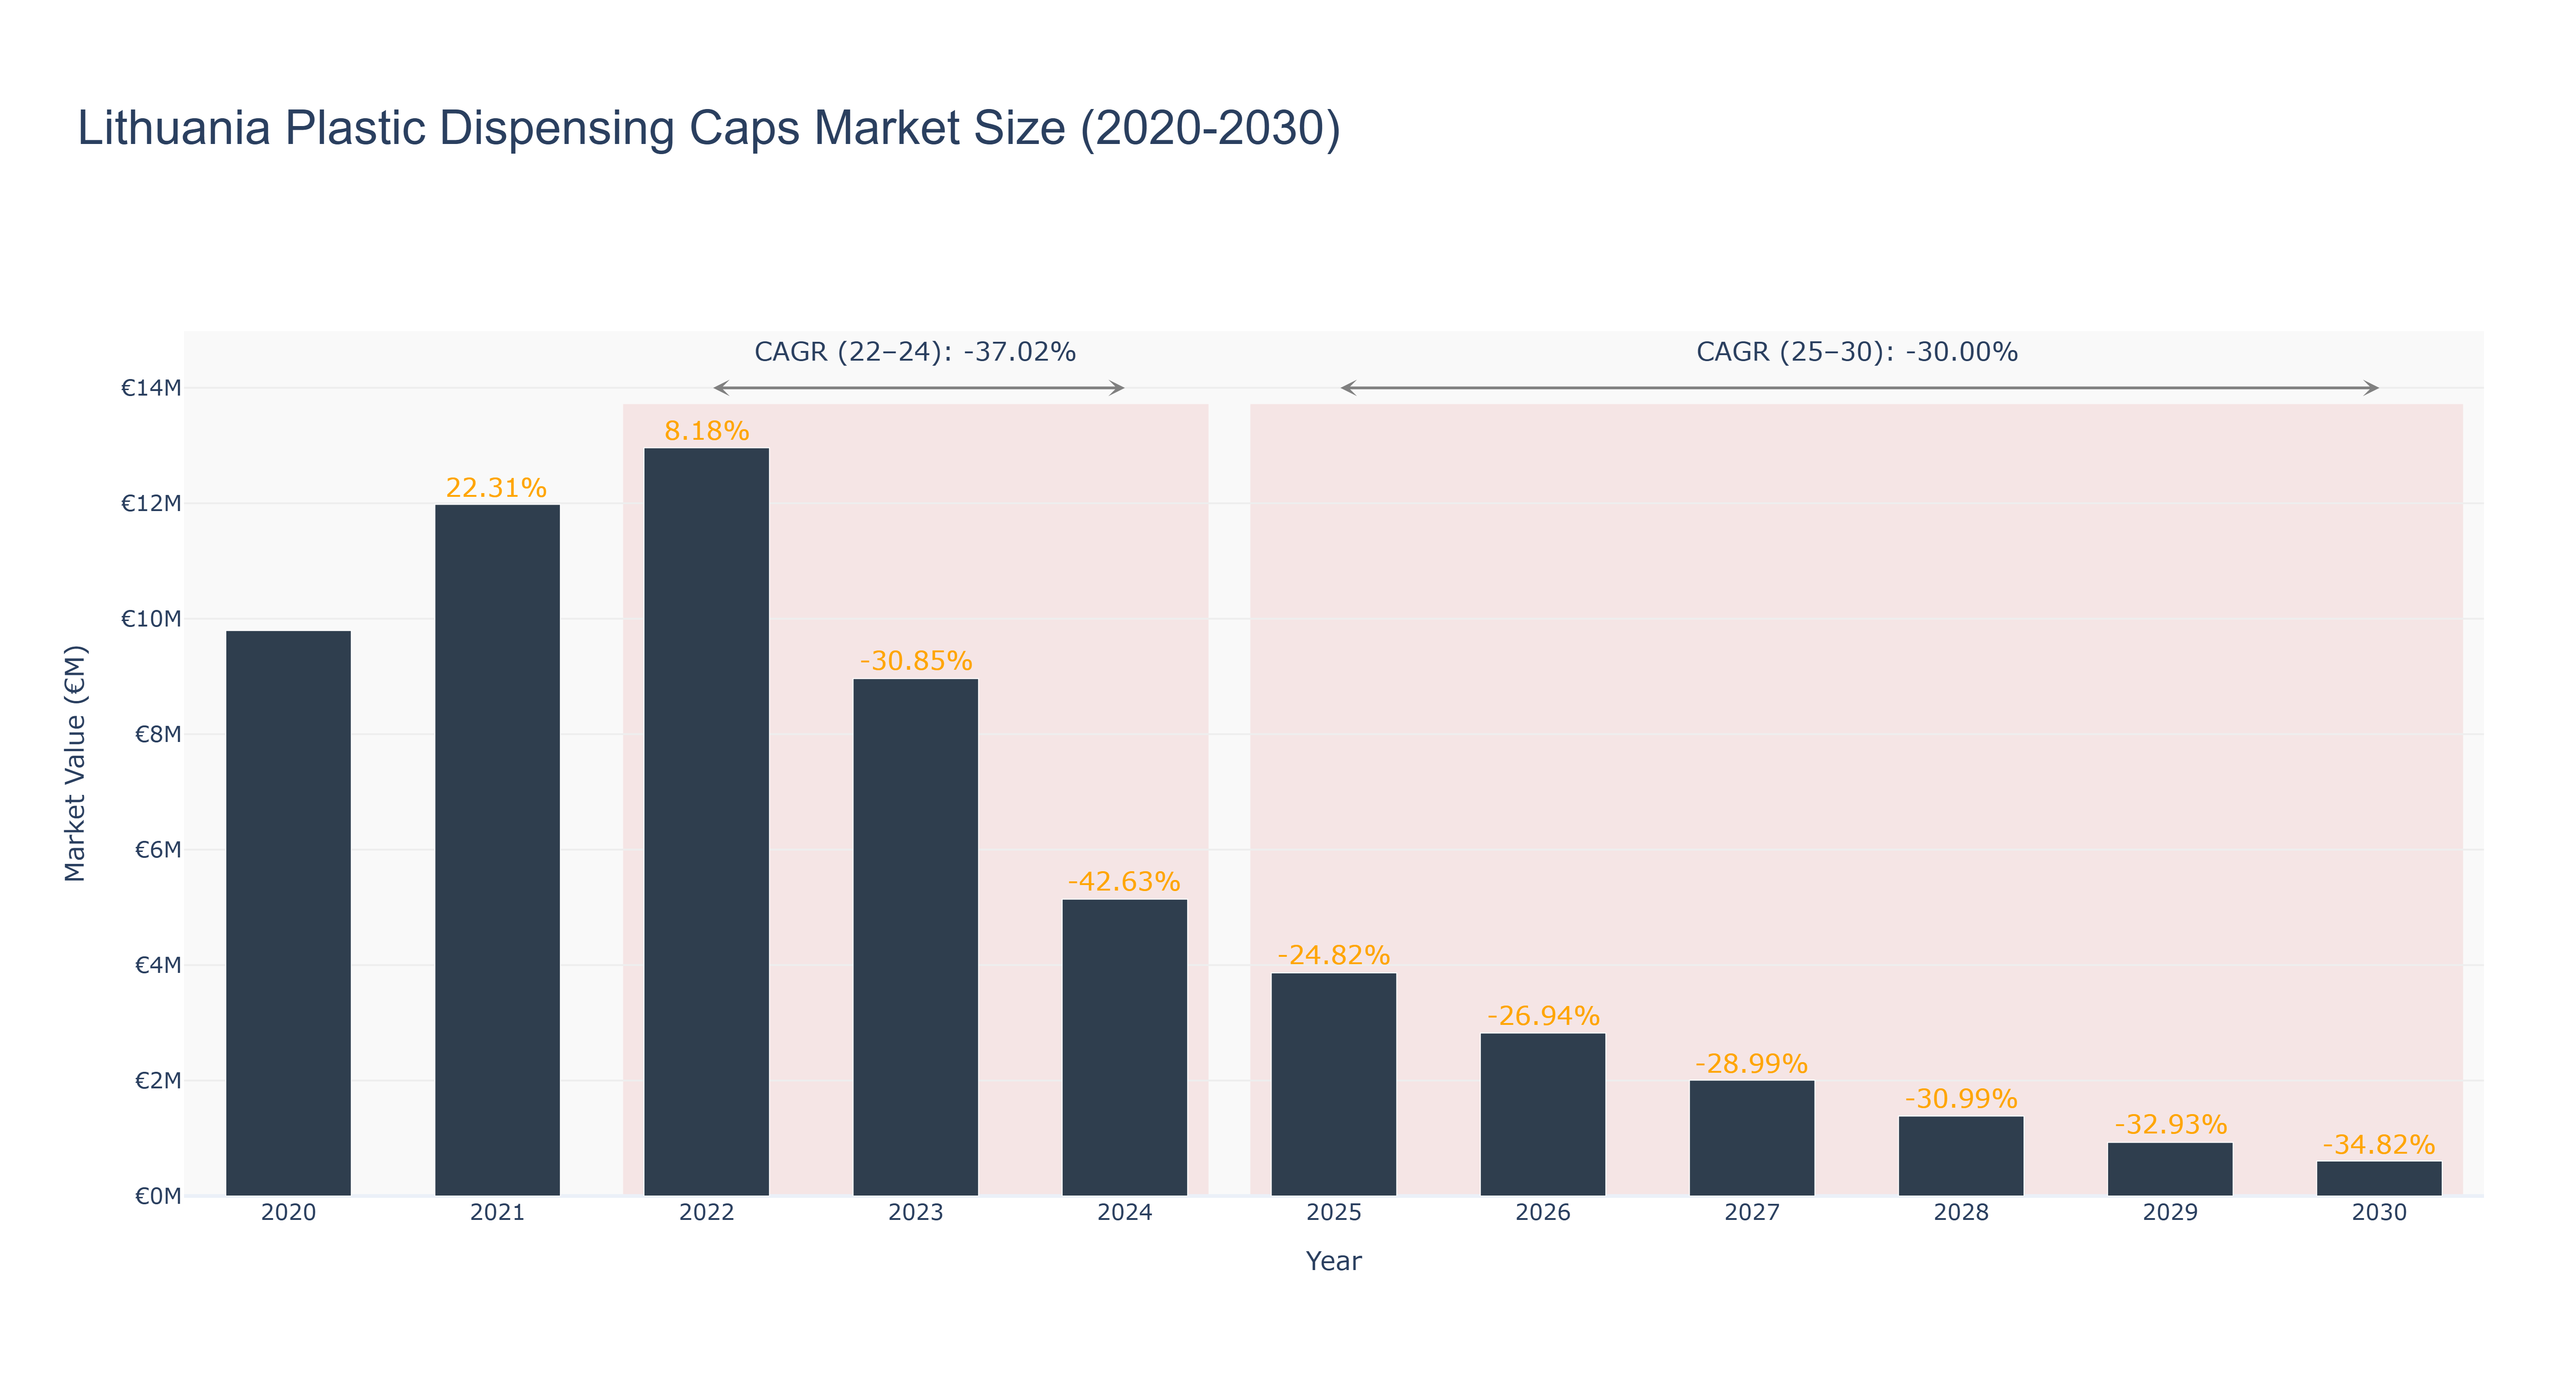
The Lithuania Plastic Dispensing Caps Market experienced a peak market size of €12.96 million in 2022, followed by a significant decline to €2.82 million in 2026. The market is forecasted to continue shrinking, reaching €0.60 million by 2030 with a CAGR of -30.0% from 2025 to 2030. The downward trend can be attributed to factors such as changing consumer preferences towards alternative packaging solutions and increased competition in the market. To counter this decline, industry players are focusing on innovation in sustainable packaging solutions and enhancing product quality to attract environmentally conscious consumers. In the near future, Lithuania is set to launch initiatives promoting eco-friendly packaging practices, which is expected to drive growth in the plastic dispensing caps market.
Lithuania Plastic Dispensing Caps Market: Production & Trade Performance (2019-2025)
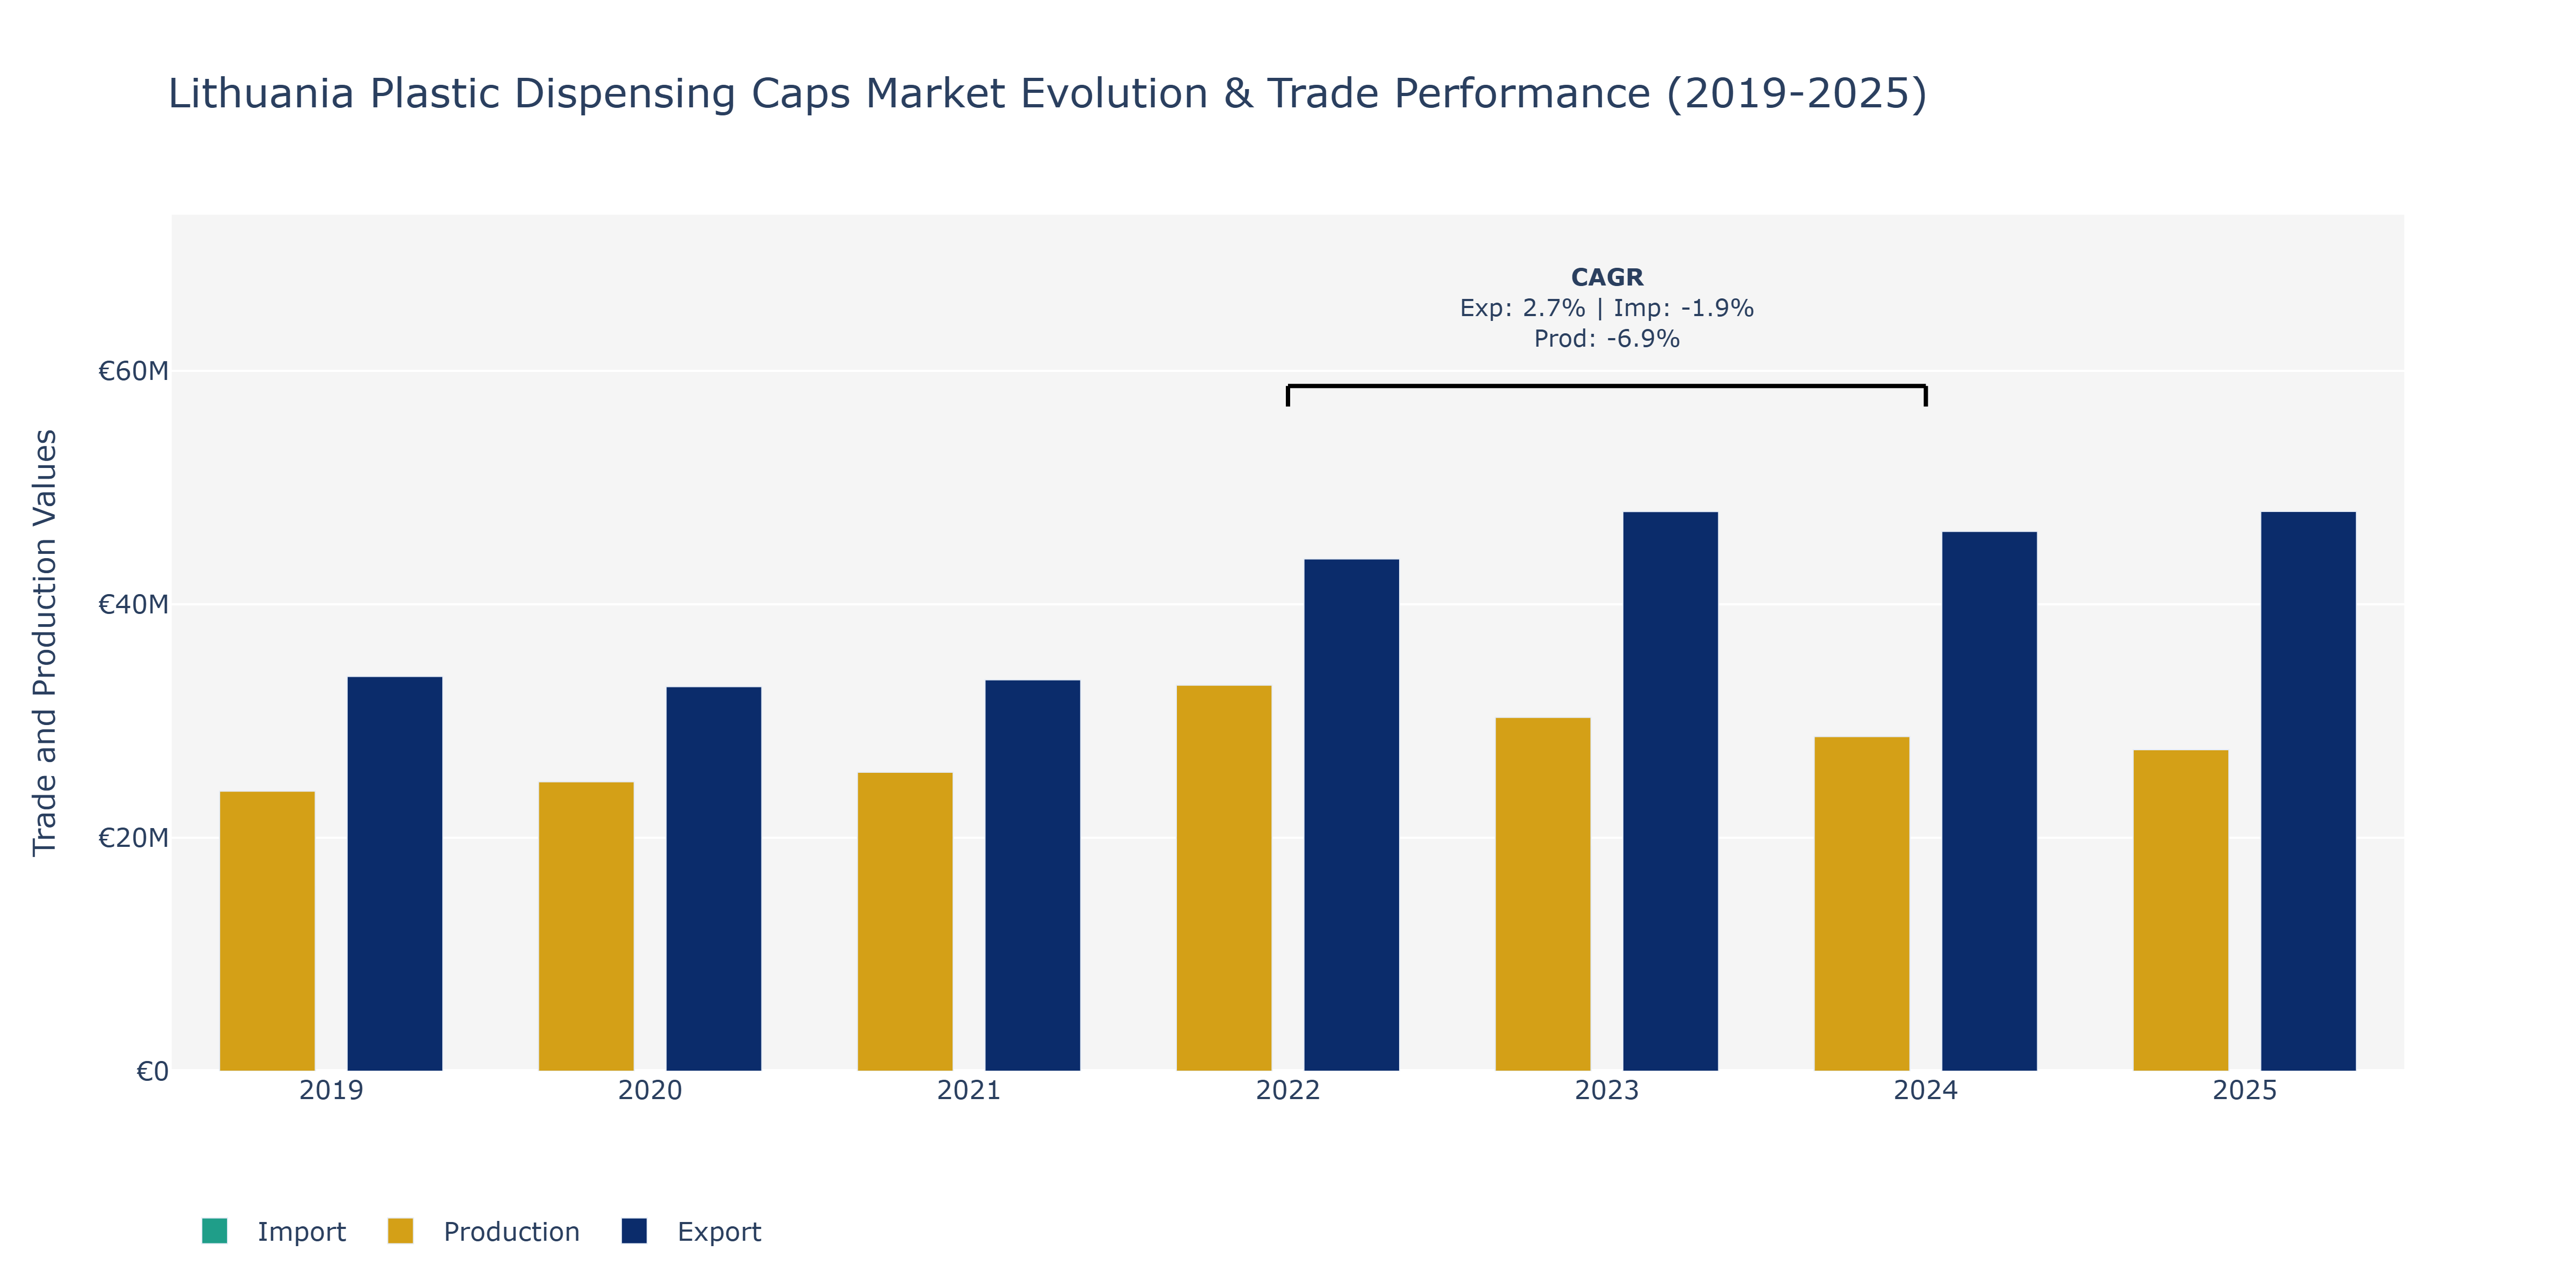
The Lithuania Plastic Dispensing Caps Market witnessed varied performances in exports, imports, and production from 2019 to 2025. Exports showed an increasing trend, peaking at €47.96 million in 2025, marking a significant growth from €33.81 million in 2019. In contrast, imports fluctuated, with a peak of €19.34 million in 2022 but stabilized at €18.63 million in 2024. Production displayed a declining trend, decreasing from €33.07 million in 2022 to €27.53 million in 2025. The surge in exports can be attributed to the growing demand for plastic dispensing caps in the global market, where Lithuania likely strengthened its export capabilities. The fluctuations in imports may reflect changing sourcing strategies or global market conditions impacting inbound shipments. The declining production trend could be influenced by factors such as shifting manufacturing locations or technological advancements leading to changes in production volumes within the country. To capitalize on the export growth, local manufacturers may focus on enhancing production efficiency and exploring new markets to sustain competitiveness in the plastic dispensing caps industry.
Key Highlights of the Report:
- Lithuania Plastic Dispensing Caps Market Outlook
- Market Size of Lithuania Plastic Dispensing Caps Market, 2025
- Forecast of Lithuania Plastic Dispensing Caps Market, 2032
- Historical Data and Forecast of Lithuania Plastic Dispensing Caps Revenues & Volume for the Period 2022 - 2032
- Lithuania Plastic Dispensing Caps Market Trend Evolution
- Lithuania Plastic Dispensing Caps Market Drivers and Challenges
- Lithuania Plastic Dispensing Caps Price Trends
- Lithuania Plastic Dispensing Caps Porter's Five Forces
- Lithuania Plastic Dispensing Caps Industry Life Cycle
- Historical Data and Forecast of Lithuania Plastic Dispensing Caps Market Revenues & Volume By Products for the Period 2022 - 2032
- Historical Data and Forecast of Lithuania Plastic Dispensing Caps Market Revenues & Volume By Screw-on Caps for the Period 2022 - 2032
- Historical Data and Forecast of Lithuania Plastic Dispensing Caps Market Revenues & Volume By Dispensing Caps for the Period 2022 - 2032
- Historical Data and Forecast of Lithuania Plastic Dispensing Caps Market Revenues & Volume By Technology for the Period 2022 - 2032
- Historical Data and Forecast of Lithuania Plastic Dispensing Caps Market Revenues & Volume By Injection Molding for the Period 2022 - 2032
- Historical Data and Forecast of Lithuania Plastic Dispensing Caps Market Revenues & Volume By Compression Molding for the Period 2022 - 2032
- Historical Data and Forecast of Lithuania Plastic Dispensing Caps Market Revenues & Volume By Post-mold TE Band for the Period 2022 - 2032
- Historical Data and Forecast of Lithuania Plastic Dispensing Caps Market Revenues & Volume By Materials for the Period 2022 - 2032
- Historical Data and Forecast of Lithuania Plastic Dispensing Caps Market Revenues & Volume By PET for the Period 2022 - 2032
- Historical Data and Forecast of Lithuania Plastic Dispensing Caps Market Revenues & Volume By PP for the Period 2022 - 2032
- Historical Data and Forecast of Lithuania Plastic Dispensing Caps Market Revenues & Volume By HDPE for the Period 2022 - 2032
- Historical Data and Forecast of Lithuania Plastic Dispensing Caps Market Revenues & Volume By LDPE for the Period 2022 - 2032
- Historical Data and Forecast of Lithuania Plastic Dispensing Caps Market Revenues & Volume By Other for the Period 2022 - 2032
- Historical Data and Forecast of Lithuania Plastic Dispensing Caps Market Revenues & Volume By End-User for the Period 2022 - 2032
- Historical Data and Forecast of Lithuania Plastic Dispensing Caps Market Revenues & Volume By Beverage for the Period 2022 - 2032
- Historical Data and Forecast of Lithuania Plastic Dispensing Caps Market Revenues & Volume By Pharmaceutical for the Period 2022 - 2032
- Historical Data and Forecast of Lithuania Plastic Dispensing Caps Market Revenues & Volume By Cosmetics for the Period 2022 - 2032
- Historical Data and Forecast of Lithuania Plastic Dispensing Caps Market Revenues & Volume By Others for the Period 2022 - 2032
- Lithuania Plastic Dispensing Caps Import Export Trade Statistics
- Market Opportunity Assessment By Products
- Market Opportunity Assessment By Technology
- Market Opportunity Assessment By Materials
- Market Opportunity Assessment By End-User
- Lithuania Plastic Dispensing Caps Top Companies Market Share
- Lithuania Plastic Dispensing Caps Competitive Benchmarking By Technical and Operational Parameters
- Lithuania Plastic Dispensing Caps Company Profiles
- Lithuania Plastic Dispensing Caps Key Strategic Recommendations
Frequently Asked Questions About the Market Study (FAQs):
6Wresearch actively monitors the Lithuania Plastic Dispensing Caps Market and publishes its comprehensive annual report, highlighting emerging trends, growth drivers, revenue analysis, and forecast outlook. Our insights help businesses to make data-backed strategic decisions with ongoing market dynamics. Our analysts track relevent industries related to the Lithuania Plastic Dispensing Caps Market, allowing our clients with actionable intelligence and reliable forecasts tailored to emerging regional needs.
Yes, we provide customisation as per your requirements. To learn more, feel free to contact us on sales@6wresearch.com
1 Executive Summary |
2 Introduction |
2.1 Key Highlights of the Report |
2.2 Report Description |
2.3 Market Scope & Segmentation |
2.4 Research Methodology |
2.5 Assumptions |
3 Lithuania Plastic Dispensing Caps Market Overview |
3.1 Lithuania Country Macro Economic Indicators |
3.2 Lithuania Plastic Dispensing Caps Market Revenues & Volume, 2022 & 2032F |
3.3 Lithuania Plastic Dispensing Caps Market - Industry Life Cycle |
3.4 Lithuania Plastic Dispensing Caps Market - Porter's Five Forces |
3.5 Lithuania Plastic Dispensing Caps Market Revenues & Volume Share, By Products, 2022 & 2032F |
3.6 Lithuania Plastic Dispensing Caps Market Revenues & Volume Share, By Technology, 2022 & 2032F |
3.7 Lithuania Plastic Dispensing Caps Market Revenues & Volume Share, By Materials, 2022 & 2032F |
3.8 Lithuania Plastic Dispensing Caps Market Revenues & Volume Share, By End-User, 2022 & 2032F |
4 Lithuania Plastic Dispensing Caps Market Dynamics |
4.1 Impact Analysis |
4.2 Market Drivers |
4.2.1 Increasing demand for convenient packaging solutions in various industries |
4.2.2 Growing awareness about environmental sustainability leading to the preference for plastic dispensing caps over other materials |
4.2.3 Innovation in product design and functionality to meet consumer preferences |
4.3 Market Restraints |
4.3.1 Fluctuating raw material prices impacting production costs |
4.3.2 Stringent regulations related to plastic usage and disposal |
4.3.3 Competition from alternative packaging solutions such as glass or metal caps |
5 Lithuania Plastic Dispensing Caps Market Trends |
6 Lithuania Plastic Dispensing Caps Market, By Types |
6.1 Lithuania Plastic Dispensing Caps Market, By Products |
6.1.1 Overview and Analysis |
6.1.2 Lithuania Plastic Dispensing Caps Market Revenues & Volume, By Products, 2022 - 2032F |
6.1.3 Lithuania Plastic Dispensing Caps Market Revenues & Volume, By Screw-on Caps, 2022 - 2032F |
6.1.4 Lithuania Plastic Dispensing Caps Market Revenues & Volume, By Dispensing Caps, 2022 - 2032F |
6.2 Lithuania Plastic Dispensing Caps Market, By Technology |
6.2.1 Overview and Analysis |
6.2.2 Lithuania Plastic Dispensing Caps Market Revenues & Volume, By Injection Molding, 2022 - 2032F |
6.2.3 Lithuania Plastic Dispensing Caps Market Revenues & Volume, By Compression Molding, 2022 - 2032F |
6.2.4 Lithuania Plastic Dispensing Caps Market Revenues & Volume, By Post-mold TE Band, 2022 - 2032F |
6.3 Lithuania Plastic Dispensing Caps Market, By Materials |
6.3.1 Overview and Analysis |
6.3.2 Lithuania Plastic Dispensing Caps Market Revenues & Volume, By PET, 2022 - 2032F |
6.3.3 Lithuania Plastic Dispensing Caps Market Revenues & Volume, By PP, 2022 - 2032F |
6.3.4 Lithuania Plastic Dispensing Caps Market Revenues & Volume, By HDPE, 2022 - 2032F |
6.3.5 Lithuania Plastic Dispensing Caps Market Revenues & Volume, By LDPE, 2022 - 2032F |
6.3.6 Lithuania Plastic Dispensing Caps Market Revenues & Volume, By Other, 2022 - 2032F |
6.4 Lithuania Plastic Dispensing Caps Market, By End-User |
6.4.1 Overview and Analysis |
6.4.2 Lithuania Plastic Dispensing Caps Market Revenues & Volume, By Beverage, 2022 - 2032F |
6.4.3 Lithuania Plastic Dispensing Caps Market Revenues & Volume, By Pharmaceutical, 2022 - 2032F |
6.4.4 Lithuania Plastic Dispensing Caps Market Revenues & Volume, By Cosmetics, 2022 - 2032F |
6.4.5 Lithuania Plastic Dispensing Caps Market Revenues & Volume, By Others, 2022 - 2032F |
7 Lithuania Plastic Dispensing Caps Market Import-Export Trade Statistics |
7.1 Lithuania Plastic Dispensing Caps Market Export to Major Countries |
7.2 Lithuania Plastic Dispensing Caps Market Imports from Major Countries |
8 Lithuania Plastic Dispensing Caps Market Key Performance Indicators |
8.1 Number of new product launches in the plastic dispensing caps market |
8.2 Percentage of market share held by eco-friendly plastic dispensing caps |
8.3 Average time taken for product development and commercialization |
9 Lithuania Plastic Dispensing Caps Market - Opportunity Assessment |
9.1 Lithuania Plastic Dispensing Caps Market Opportunity Assessment, By Products, 2022 & 2032F |
9.2 Lithuania Plastic Dispensing Caps Market Opportunity Assessment, By Technology, 2022 & 2032F |
9.3 Lithuania Plastic Dispensing Caps Market Opportunity Assessment, By Materials, 2022 & 2032F |
9.4 Lithuania Plastic Dispensing Caps Market Opportunity Assessment, By End-User, 2022 & 2032F |
10 Lithuania Plastic Dispensing Caps Market - Competitive Landscape |
10.1 Lithuania Plastic Dispensing Caps Market Revenue Share, By Companies, 2025 |
10.2 Lithuania Plastic Dispensing Caps Market Competitive Benchmarking, By Operating and Technical Parameters |
11 Company Profiles |
12 Recommendations |
13 Disclaimer |
Export potential assessment - trade Analytics for 2030
Export potential enables firms to identify high-growth global markets with greater confidence by combining advanced trade intelligence with a structured quantitative methodology. The framework analyzes emerging demand trends and country-level import patterns while integrating macroeconomic and trade datasets such as GDP and population forecasts, bilateral import–export flows, tariff structures, elasticity differentials between developed and developing economies, geographic distance, and import demand projections. Using weighted trade values from 2020–2024 as the base period to project country-to-country export potential for 2030, these inputs are operationalized through calculated drivers such as gravity model parameters, tariff impact factors, and projected GDP per-capita growth. Through an analysis of hidden potentials, demand hotspots, and market conditions that are most favorable to success, this method enables firms to focus on target countries, maximize returns, and global expansion with data, backed by accuracy.
By factoring in the projected importer demand gap that is currently unmet and could be potential opportunity, it identifies the potential for the Exporter (Country) among 190 countries, against the general trade analysis, which identifies the biggest importer or exporter.
To discover high-growth global markets and optimize your business strategy:
Click Here
Pricing
- Single User License$ 1,995
- Department License$ 2,400
- Site License$ 3,120
- Global License$ 3,795

Thought Leadership
Search
Thought Leadership and Analyst Meet


Our Clients
Latest Reports
- New Zealand Aseptic Manufacturing Market (2026-2032)
- Netherlands Aseptic Manufacturing Market (2026-2032)
- Nauru Aseptic Manufacturing Market (2026-2032)
- Namibia Aseptic Manufacturing Market (2026-2032)
- Mozambique Aseptic Manufacturing Market (2026-2032)
- Montenegro Aseptic Manufacturing Market (2026-2032)
- Mongolia Aseptic Manufacturing Market (2026-2032)
- Monaco Aseptic Manufacturing Market (2026-2032)
- Micronesia Aseptic Manufacturing Market (2026-2032)
- Mauritius Aseptic Manufacturing Market (2026-2032)
Industry Events and Analyst Meet

HIMTEX 2026

India Refining Summit 2026

India EV Show 2026

EV tech India Expo 2026

Auto Tech Asia 2026
Whitepaper
- Middle East & Africa Commercial Security Market Click here to view more.
- Middle East & Africa Fire Safety Systems & Equipment Market Click here to view more.
- GCC Drone Market Click here to view more.
- Middle East Lighting Fixture Market Click here to view more.
- GCC Physical & Perimeter Security Market Click here to view more.
6WResearch In News
- Doha a strategic location for EV manufacturing hub: IPA Qatar
- Demand for luxury TVs surging in the GCC, says Samsung
- Empowering Growth: The Thriving Journey of Bangladesh’s Cable Industry
- Demand for luxury TVs surging in the GCC, says Samsung
- Video call with a traditional healer? Once unthinkable, it’s now common in South Africa
- Intelligent Buildings To Smooth GCC’s Path To Net Zero