Lithuania Powdered Soft Drinks Market (2026-2032) | Growth, Size & Revenue, Competitive Landscape, Segmentation, Industry, Outlook, Companies, Analysis, Value, Trends, Share, Forecast
Market Forecast By Flavor (Mango, Citrus, Apple, Others), By Packaging (Cartons, Pouches & Sachets, Others), By Distribution Channel (Online Stores, Hypermarkets, Specialized Stores, Others) And Competitive Landscape
| Product Code: ETC8049205 | Publication Date: Sep 2024 | Updated Date: Apr 2026 | Product Type: Market Research Report | |
| Publisher: 6Wresearch | Author: Shubham Padhi | No. of Pages: 75 | No. of Figures: 35 | No. of Tables: 20 |
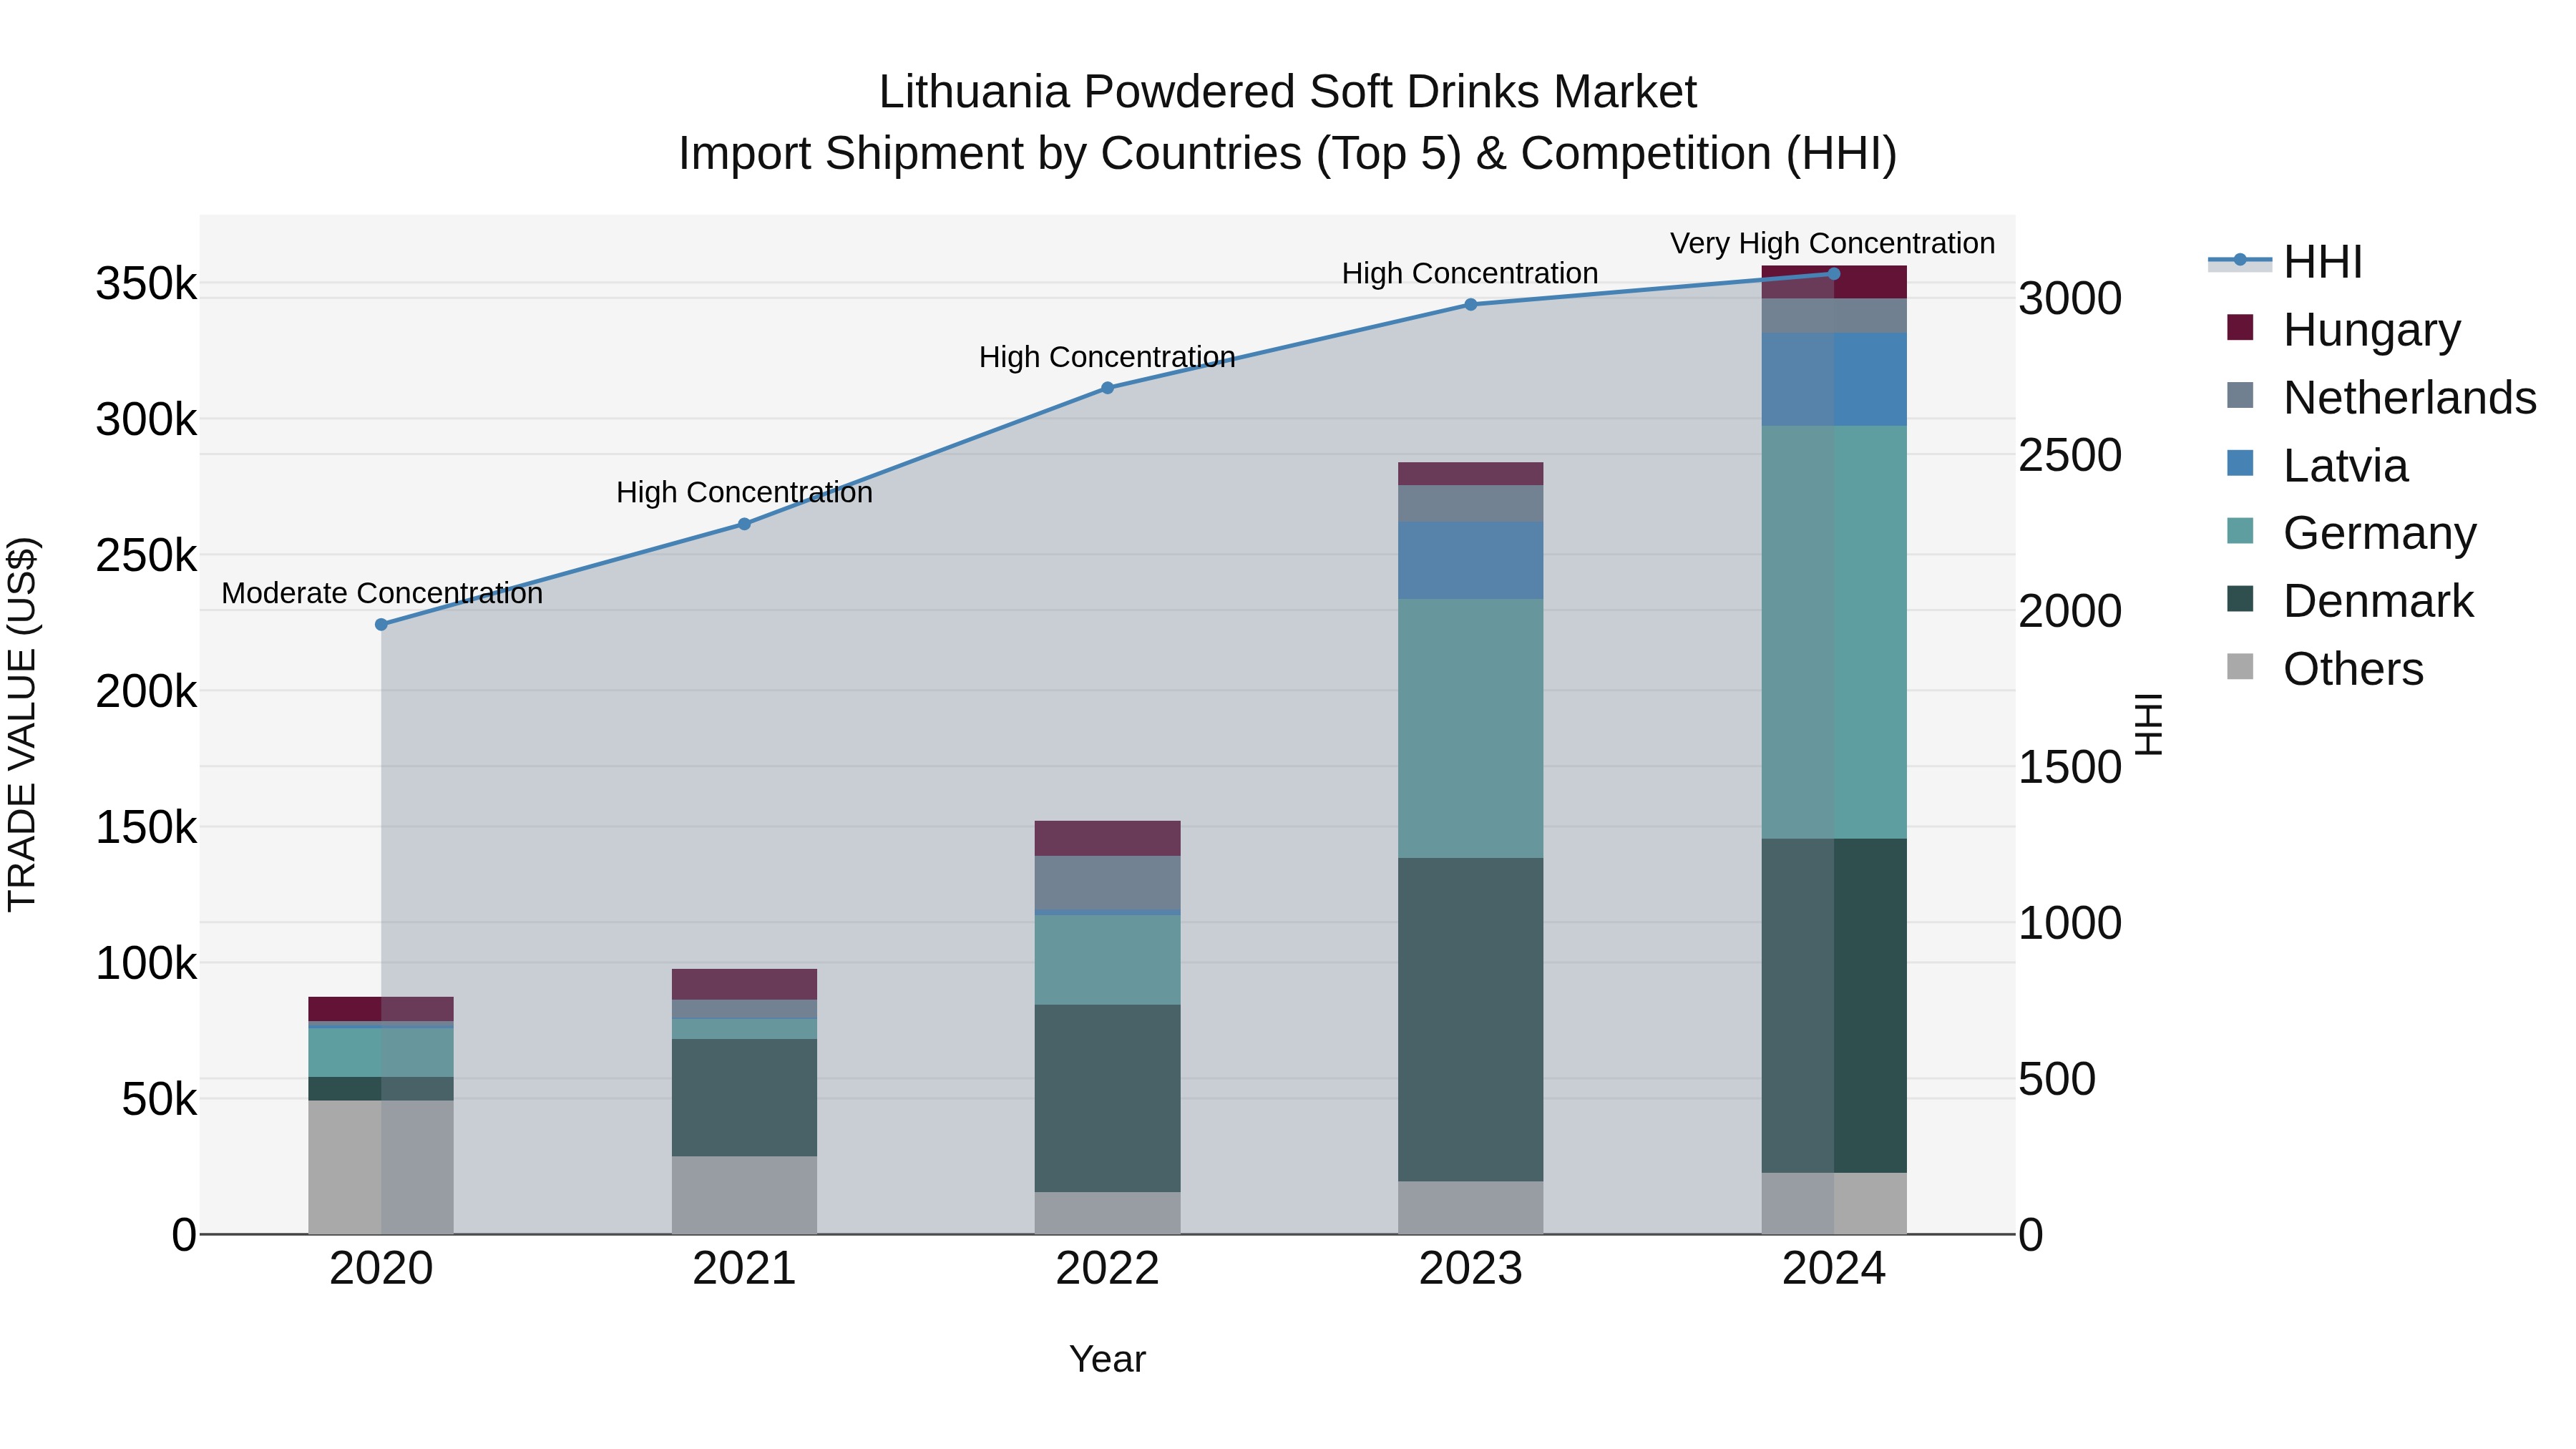
Lithuania Powdered Soft Drinks Market Top 5 Importing Countries and Market Competition (HHI) Analysis
The Lithuania powdered soft drinks import market continued to exhibit strong growth in 2024, with Germany, Denmark, Latvia, Netherlands, and Hungary emerging as the top exporting countries. The high Herfindahl-Hirschman Index (HHI) indicates a concentrated market landscape. The impressive compound annual growth rate (CAGR) of 42.11% from 2020 to 2024 underscores the increasing demand for powdered soft drinks in Lithuania. Moreover, the growth rate of 25.44% from 2023 to 2024 suggests a sustained momentum in the market, making it an attractive opportunity for both domestic and international players.
Key Highlights of the Report:
- Lithuania Powdered Soft Drinks Market Outlook
- Market Size of Lithuania Powdered Soft Drinks Market, 2025
- Forecast of Lithuania Powdered Soft Drinks Market, 2032
- Historical Data and Forecast of Lithuania Powdered Soft Drinks Revenues & Volume for the Period 2022 - 2032
- Lithuania Powdered Soft Drinks Market Trend Evolution
- Lithuania Powdered Soft Drinks Market Drivers and Challenges
- Lithuania Powdered Soft Drinks Price Trends
- Lithuania Powdered Soft Drinks Porter's Five Forces
- Lithuania Powdered Soft Drinks Industry Life Cycle
- Historical Data and Forecast of Lithuania Powdered Soft Drinks Market Revenues & Volume By Flavor for the Period 2022 - 2032
- Historical Data and Forecast of Lithuania Powdered Soft Drinks Market Revenues & Volume By Mango for the Period 2022 - 2032
- Historical Data and Forecast of Lithuania Powdered Soft Drinks Market Revenues & Volume By Citrus for the Period 2022 - 2032
- Historical Data and Forecast of Lithuania Powdered Soft Drinks Market Revenues & Volume By Apple for the Period 2022 - 2032
- Historical Data and Forecast of Lithuania Powdered Soft Drinks Market Revenues & Volume By Others for the Period 2022 - 2032
- Historical Data and Forecast of Lithuania Powdered Soft Drinks Market Revenues & Volume By Packaging for the Period 2022 - 2032
- Historical Data and Forecast of Lithuania Powdered Soft Drinks Market Revenues & Volume By Cartons for the Period 2022 - 2032
- Historical Data and Forecast of Lithuania Powdered Soft Drinks Market Revenues & Volume By Pouches & Sachets for the Period 2022 - 2032
- Historical Data and Forecast of Lithuania Powdered Soft Drinks Market Revenues & Volume By Others for the Period 2022 - 2032
- Historical Data and Forecast of Lithuania Powdered Soft Drinks Market Revenues & Volume By Distribution Channel for the Period 2022 - 2032
- Historical Data and Forecast of Lithuania Powdered Soft Drinks Market Revenues & Volume By Online Stores for the Period 2022 - 2032
- Historical Data and Forecast of Lithuania Powdered Soft Drinks Market Revenues & Volume By Hypermarkets for the Period 2022 - 2032
- Historical Data and Forecast of Lithuania Powdered Soft Drinks Market Revenues & Volume By Specialized Stores for the Period 2022 - 2032
- Historical Data and Forecast of Lithuania Powdered Soft Drinks Market Revenues & Volume By Others for the Period 2022 - 2032
- Lithuania Powdered Soft Drinks Import Export Trade Statistics
- Market Opportunity Assessment By Flavor
- Market Opportunity Assessment By Packaging
- Market Opportunity Assessment By Distribution Channel
- Lithuania Powdered Soft Drinks Top Companies Market Share
- Lithuania Powdered Soft Drinks Competitive Benchmarking By Technical and Operational Parameters
- Lithuania Powdered Soft Drinks Company Profiles
- Lithuania Powdered Soft Drinks Key Strategic Recommendations
Frequently Asked Questions About the Market Study (FAQs):
6Wresearch actively monitors the Lithuania Powdered Soft Drinks Market and publishes its comprehensive annual report, highlighting emerging trends, growth drivers, revenue analysis, and forecast outlook. Our insights help businesses to make data-backed strategic decisions with ongoing market dynamics. Our analysts track relevent industries related to the Lithuania Powdered Soft Drinks Market, allowing our clients with actionable intelligence and reliable forecasts tailored to emerging regional needs.
Yes, we provide customisation as per your requirements. To learn more, feel free to contact us on sales@6wresearch.com
1 Executive Summary |
2 Introduction |
2.1 Key Highlights of the Report |
2.2 Report Description |
2.3 Market Scope & Segmentation |
2.4 Research Methodology |
2.5 Assumptions |
3 Lithuania Powdered Soft Drinks Market Overview |
3.1 Lithuania Country Macro Economic Indicators |
3.2 Lithuania Powdered Soft Drinks Market Revenues & Volume, 2022 & 2032F |
3.3 Lithuania Powdered Soft Drinks Market - Industry Life Cycle |
3.4 Lithuania Powdered Soft Drinks Market - Porter's Five Forces |
3.5 Lithuania Powdered Soft Drinks Market Revenues & Volume Share, By Flavor, 2022 & 2032F |
3.6 Lithuania Powdered Soft Drinks Market Revenues & Volume Share, By Packaging, 2022 & 2032F |
3.7 Lithuania Powdered Soft Drinks Market Revenues & Volume Share, By Distribution Channel, 2022 & 2032F |
4 Lithuania Powdered Soft Drinks Market Dynamics |
4.1 Impact Analysis |
4.2 Market Drivers |
4.2.1 Increasing consumer awareness towards health and wellness leading to a shift towards healthier beverage options. |
4.2.2 Growing trend of convenience and portability of powdered soft drinks, especially among busy urban consumers. |
4.2.3 Rising disposable income levels and changing lifestyles driving the demand for on-the-go beverage solutions. |
4.3 Market Restraints |
4.3.1 Fluctuating raw material prices, such as sugar and flavorings, impacting the production cost and profitability. |
4.3.2 Intense competition from other beverage categories like ready-to-drink beverages and traditional soft drinks, limiting market share growth. |
4.3.3 Concerns regarding the environmental impact of packaging materials and sustainability practices in the powdered soft drinks industry. |
5 Lithuania Powdered Soft Drinks Market Trends |
6 Lithuania Powdered Soft Drinks Market, By Types |
6.1 Lithuania Powdered Soft Drinks Market, By Flavor |
6.1.1 Overview and Analysis |
6.1.2 Lithuania Powdered Soft Drinks Market Revenues & Volume, By Flavor, 2022 - 2032F |
6.1.3 Lithuania Powdered Soft Drinks Market Revenues & Volume, By Mango, 2022 - 2032F |
6.1.4 Lithuania Powdered Soft Drinks Market Revenues & Volume, By Citrus, 2022 - 2032F |
6.1.5 Lithuania Powdered Soft Drinks Market Revenues & Volume, By Apple, 2022 - 2032F |
6.1.6 Lithuania Powdered Soft Drinks Market Revenues & Volume, By Others, 2022 - 2032F |
6.2 Lithuania Powdered Soft Drinks Market, By Packaging |
6.2.1 Overview and Analysis |
6.2.2 Lithuania Powdered Soft Drinks Market Revenues & Volume, By Cartons, 2022 - 2032F |
6.2.3 Lithuania Powdered Soft Drinks Market Revenues & Volume, By Pouches & Sachets, 2022 - 2032F |
6.2.4 Lithuania Powdered Soft Drinks Market Revenues & Volume, By Others, 2022 - 2032F |
6.3 Lithuania Powdered Soft Drinks Market, By Distribution Channel |
6.3.1 Overview and Analysis |
6.3.2 Lithuania Powdered Soft Drinks Market Revenues & Volume, By Online Stores, 2022 - 2032F |
6.3.3 Lithuania Powdered Soft Drinks Market Revenues & Volume, By Hypermarkets, 2022 - 2032F |
6.3.4 Lithuania Powdered Soft Drinks Market Revenues & Volume, By Specialized Stores, 2022 - 2032F |
6.3.5 Lithuania Powdered Soft Drinks Market Revenues & Volume, By Others, 2022 - 2032F |
7 Lithuania Powdered Soft Drinks Market Import-Export Trade Statistics |
7.1 Lithuania Powdered Soft Drinks Market Export to Major Countries |
7.2 Lithuania Powdered Soft Drinks Market Imports from Major Countries |
8 Lithuania Powdered Soft Drinks Market Key Performance Indicators |
8.1 Consumer engagement metrics on social media platforms, indicating the level of brand awareness and customer loyalty. |
8.2 Sustainability metrics such as percentage of recyclable packaging materials used, reflecting the commitment towards environmental responsibility. |
8.3 Innovation rate, measured by the frequency of new product launches and improvements in powdered soft drink formulations, showcasing the market's adaptability to changing consumer preferences. |
9 Lithuania Powdered Soft Drinks Market - Opportunity Assessment |
9.1 Lithuania Powdered Soft Drinks Market Opportunity Assessment, By Flavor, 2022 & 2032F |
9.2 Lithuania Powdered Soft Drinks Market Opportunity Assessment, By Packaging, 2022 & 2032F |
9.3 Lithuania Powdered Soft Drinks Market Opportunity Assessment, By Distribution Channel, 2022 & 2032F |
10 Lithuania Powdered Soft Drinks Market - Competitive Landscape |
10.1 Lithuania Powdered Soft Drinks Market Revenue Share, By Companies, 2025 |
10.2 Lithuania Powdered Soft Drinks Market Competitive Benchmarking, By Operating and Technical Parameters |
11 Company Profiles |
12 Recommendations |
13 Disclaimer |
Export potential assessment - trade Analytics for 2030
Export potential enables firms to identify high-growth global markets with greater confidence by combining advanced trade intelligence with a structured quantitative methodology. The framework analyzes emerging demand trends and country-level import patterns while integrating macroeconomic and trade datasets such as GDP and population forecasts, bilateral import–export flows, tariff structures, elasticity differentials between developed and developing economies, geographic distance, and import demand projections. Using weighted trade values from 2020–2024 as the base period to project country-to-country export potential for 2030, these inputs are operationalized through calculated drivers such as gravity model parameters, tariff impact factors, and projected GDP per-capita growth. Through an analysis of hidden potentials, demand hotspots, and market conditions that are most favorable to success, this method enables firms to focus on target countries, maximize returns, and global expansion with data, backed by accuracy.
By factoring in the projected importer demand gap that is currently unmet and could be potential opportunity, it identifies the potential for the Exporter (Country) among 190 countries, against the general trade analysis, which identifies the biggest importer or exporter.
To discover high-growth global markets and optimize your business strategy:
Click Here
Pricing
- Single User License$ 1,995
- Department License$ 2,400
- Site License$ 3,120
- Global License$ 3,795

Thought Leadership
Search
Thought Leadership and Analyst Meet


Our Clients
Latest Reports
- New Zealand Aseptic Manufacturing Market (2026-2032)
- Netherlands Aseptic Manufacturing Market (2026-2032)
- Nauru Aseptic Manufacturing Market (2026-2032)
- Namibia Aseptic Manufacturing Market (2026-2032)
- Mozambique Aseptic Manufacturing Market (2026-2032)
- Montenegro Aseptic Manufacturing Market (2026-2032)
- Mongolia Aseptic Manufacturing Market (2026-2032)
- Monaco Aseptic Manufacturing Market (2026-2032)
- Micronesia Aseptic Manufacturing Market (2026-2032)
- Mauritius Aseptic Manufacturing Market (2026-2032)
Industry Events and Analyst Meet

HIMTEX 2026

India Refining Summit 2026

India EV Show 2026

EV tech India Expo 2026

Auto Tech Asia 2026
Whitepaper
- Middle East & Africa Commercial Security Market Click here to view more.
- Middle East & Africa Fire Safety Systems & Equipment Market Click here to view more.
- GCC Drone Market Click here to view more.
- Middle East Lighting Fixture Market Click here to view more.
- GCC Physical & Perimeter Security Market Click here to view more.
6WResearch In News
- Doha a strategic location for EV manufacturing hub: IPA Qatar
- Demand for luxury TVs surging in the GCC, says Samsung
- Empowering Growth: The Thriving Journey of Bangladesh’s Cable Industry
- Demand for luxury TVs surging in the GCC, says Samsung
- Video call with a traditional healer? Once unthinkable, it’s now common in South Africa
- Intelligent Buildings To Smooth GCC’s Path To Net Zero