Lithuania SCR Power Controller Market (2026-2032) | Outlook, Growth, Segmentation, Forecast, Industry, Share, Trends, Revenue, Companies, Analysis, Size & Value
Market Forecast By Type (Three Phase, Single Phase), By Load Type (Resistive, Non-Resistive), By Control Method (Phase Angle Control, Integral Cycle Switching), By Industry (Glass, Oil & Gas, Metals, Textile, Plastics, Chemicals, Food & Beverages, Semiconductor) And Competitive Landscape
| Product Code: ETC5587769 | Publication Date: Nov 2023 | Updated Date: Mar 2026 | Product Type: Market Research Report | |
| Publisher: 6Wresearch | Author: Ravi Bhandari | No. of Pages: 60 | No. of Figures: 30 | No. of Tables: 5 |
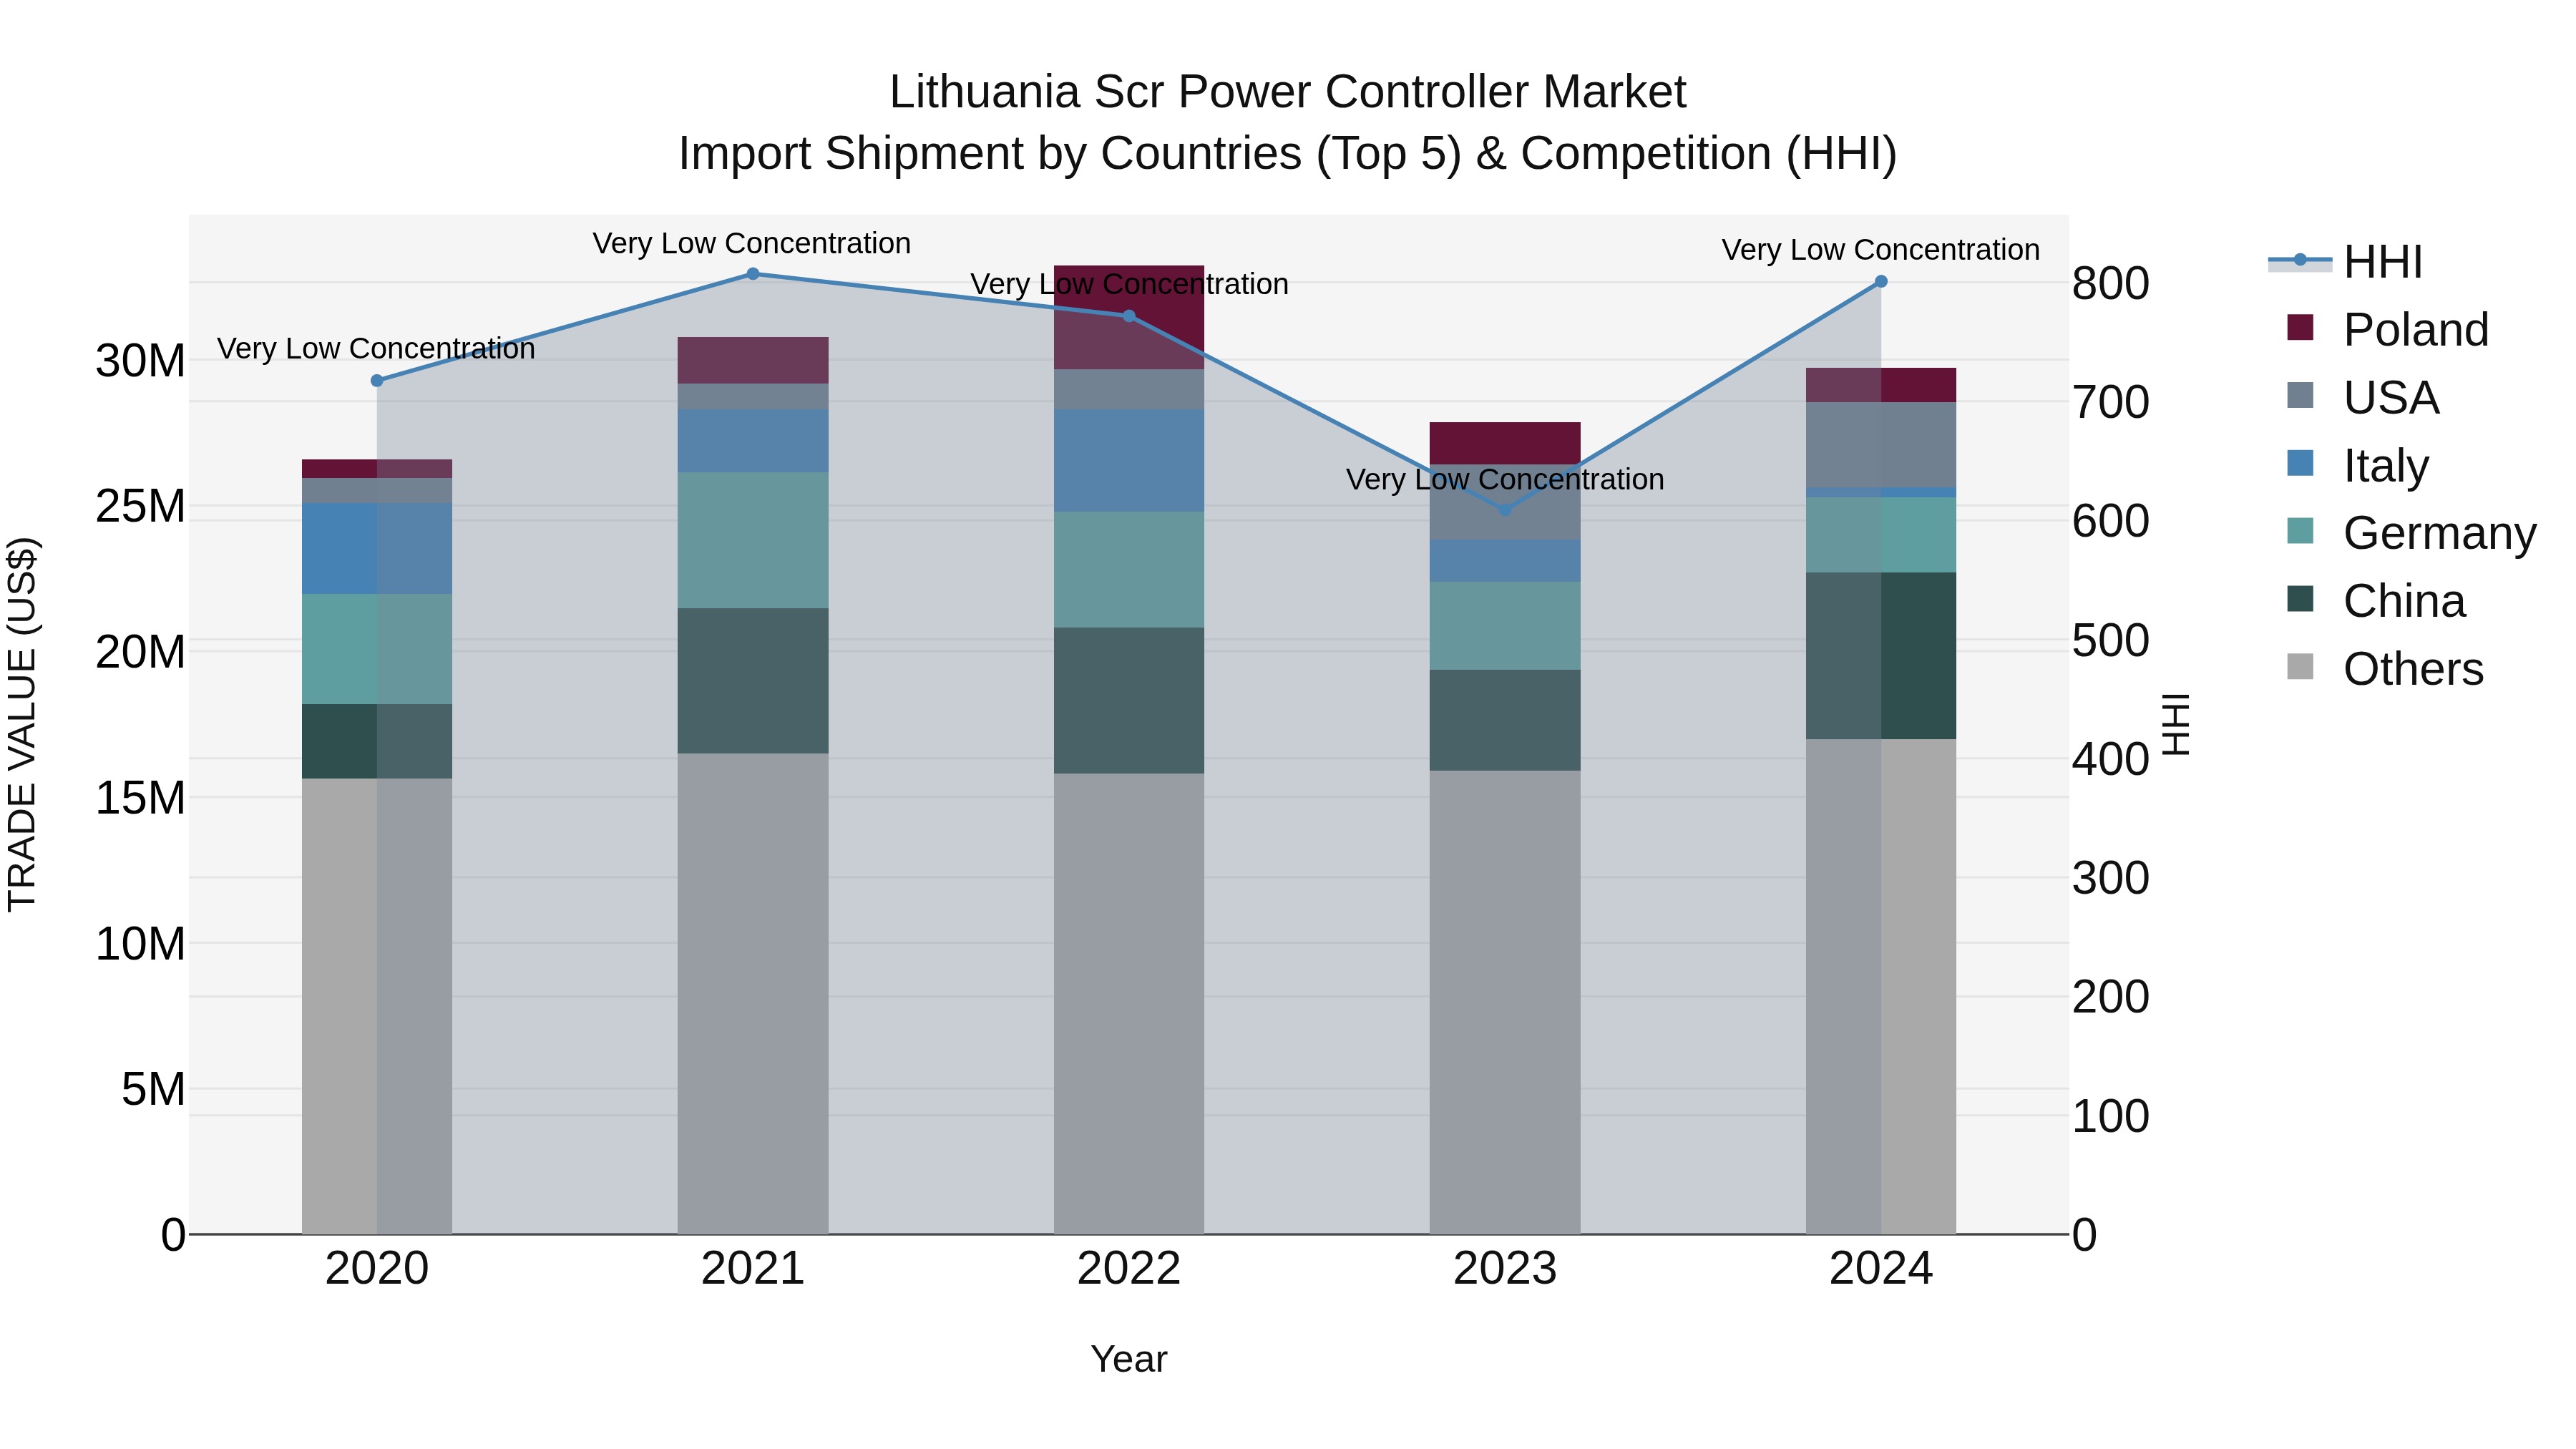
Lithuania Scr Power Controller Market Top 5 Importing Countries and Market Competition (HHI) Analysis
In 2024, Lithuania saw a diverse range of countries exporting SCR power controllers, with top suppliers including China, USA, Germany, Mexico, and the UK. The market showed a low concentration with a stable HHI in 2024, indicating a healthy level of competition. The compound annual growth rate (CAGR) from 2020 to 2024 was 2.83%, reflecting steady expansion. Furthermore, the growth rate in 2024 spiked to 6.71%, suggesting a potential uptick in demand for SCR power controllers in Lithuania.
Key Highlights of the Report:
- Lithuania SCR Power Controller Market Outlook
- Market Size of Lithuania SCR Power Controller Market, 2025
- Forecast of Lithuania SCR Power Controller Market, 2032
- Historical Data and Forecast of Lithuania SCR Power Controller Revenues & Volume for the Period 2022 - 2032F
- Lithuania SCR Power Controller Market Trend Evolution
- Lithuania SCR Power Controller Market Drivers and Challenges
- Lithuania SCR Power Controller Price Trends
- Lithuania SCR Power Controller Porter`s Five Forces
- Lithuania SCR Power Controller Industry Life Cycle
- Historical Data and Forecast of Lithuania SCR Power Controller Market Revenues & Volume By Type for the Period 2022 - 2032F
- Historical Data and Forecast of Lithuania SCR Power Controller Market Revenues & Volume By Three Phase for the Period 2022 - 2032F
- Historical Data and Forecast of Lithuania SCR Power Controller Market Revenues & Volume By Single Phase for the Period 2022 - 2032F
- Historical Data and Forecast of Lithuania SCR Power Controller Market Revenues & Volume By Load Type for the Period 2022 - 2032F
- Historical Data and Forecast of Lithuania SCR Power Controller Market Revenues & Volume By Resistive for the Period 2022 - 2032F
- Historical Data and Forecast of Lithuania SCR Power Controller Market Revenues & Volume By Non-Resistive for the Period 2022 - 2032F
- Historical Data and Forecast of Lithuania SCR Power Controller Market Revenues & Volume By Control Method for the Period 2022 - 2032F
- Historical Data and Forecast of Lithuania SCR Power Controller Market Revenues & Volume By Phase Angle Control for the Period 2022 - 2032F
- Historical Data and Forecast of Lithuania SCR Power Controller Market Revenues & Volume By Integral Cycle Switching for the Period 2022 - 2032F
- Historical Data and Forecast of Lithuania SCR Power Controller Market Revenues & Volume By Industry for the Period 2022 - 2032F
- Historical Data and Forecast of Lithuania SCR Power Controller Market Revenues & Volume By Glass for the Period 2022 - 2032F
- Historical Data and Forecast of Lithuania SCR Power Controller Market Revenues & Volume By Oil & Gas for the Period 2022 - 2032F
- Historical Data and Forecast of Lithuania SCR Power Controller Market Revenues & Volume By Metals for the Period 2022 - 2032F
- Historical Data and Forecast of Lithuania SCR Power Controller Market Revenues & Volume By Textile for the Period 2022 - 2032F
- Historical Data and Forecast of Lithuania SCR Power Controller Market Revenues & Volume By Plastics for the Period 2022 - 2032F
- Historical Data and Forecast of Lithuania SCR Power Controller Market Revenues & Volume By Chemicals for the Period 2022 - 2032F
- Historical Data and Forecast of Lithuania SCR Power Controller Market Revenues & Volume By Food & Beverages for the Period 2022 - 2032F
- Historical Data and Forecast of Lithuania SCR Power Controller Market Revenues & Volume By Semiconductor for the Period 2022 - 2032F
- Lithuania SCR Power Controller Import Export Trade Statistics
- Market Opportunity Assessment By Type
- Market Opportunity Assessment By Load Type
- Market Opportunity Assessment By Control Method
- Market Opportunity Assessment By Industry
- Lithuania SCR Power Controller Top Companies Market Share
- Lithuania SCR Power Controller Competitive Benchmarking By Technical and Operational Parameters
- Lithuania SCR Power Controller Company Profiles
- Lithuania SCR Power Controller Key Strategic Recommendations
Frequently Asked Questions About the Market Study (FAQs):
6Wresearch actively monitors the Lithuania SCR Power Controller Market and publishes its comprehensive annual report, highlighting emerging trends, growth drivers, revenue analysis, and forecast outlook. Our insights help businesses to make data-backed strategic decisions with ongoing market dynamics. Our analysts track relevent industries related to the Lithuania SCR Power Controller Market, allowing our clients with actionable intelligence and reliable forecasts tailored to emerging regional needs.
Yes, we provide customisation as per your requirements. To learn more, feel free to contact us on sales@6wresearch.com
1 Executive Summary |
2 Introduction |
2.1 Key Highlights of the Report |
2.2 Report Description |
2.3 Market Scope & Segmentation |
2.4 Research Methodology |
2.5 Assumptions |
3 Lithuania SCR Power Controller Market Overview |
3.1 Lithuania Country Macro Economic Indicators |
3.2 Lithuania SCR Power Controller Market Revenues & Volume, 2022 & 2032F |
3.3 Lithuania SCR Power Controller Market - Industry Life Cycle |
3.4 Lithuania SCR Power Controller Market - Porter's Five Forces |
3.5 Lithuania SCR Power Controller Market Revenues & Volume Share, By Type , 2022 & 2032F |
3.6 Lithuania SCR Power Controller Market Revenues & Volume Share, By Load Type , 2022 & 2032F |
3.7 Lithuania SCR Power Controller Market Revenues & Volume Share, By Control Method , 2022 & 2032F |
3.8 Lithuania SCR Power Controller Market Revenues & Volume Share, By Industry, 2022 & 2032F |
4 Lithuania SCR Power Controller Market Dynamics |
4.1 Impact Analysis |
4.2 Market Drivers |
4.2.1 Increasing adoption of renewable energy sources in Lithuania, leading to a higher demand for SCR power controllers. |
4.2.2 Growing focus on energy efficiency and power quality improvements in industries and commercial sectors. |
4.2.3 Government initiatives and regulations promoting the use of SCR power controllers for reducing carbon emissions. |
4.3 Market Restraints |
4.3.1 High initial investment costs associated with SCR power controllers. |
4.3.2 Lack of awareness and technical expertise among end-users about the benefits and applications of SCR power controllers. |
5 Lithuania SCR Power Controller Market Trends |
6 Lithuania SCR Power Controller Market Segmentations |
6.1 Lithuania SCR Power Controller Market, By Type |
6.1.1 Overview and Analysis |
6.1.2 Lithuania SCR Power Controller Market Revenues & Volume, By Three Phase, 2022 - 2032F |
6.1.3 Lithuania SCR Power Controller Market Revenues & Volume, By Single Phase, 2022 - 2032F |
6.2 Lithuania SCR Power Controller Market, By Load Type |
6.2.1 Overview and Analysis |
6.2.2 Lithuania SCR Power Controller Market Revenues & Volume, By Resistive, 2022 - 2032F |
6.2.3 Lithuania SCR Power Controller Market Revenues & Volume, By Non-Resistive, 2022 - 2032F |
6.3 Lithuania SCR Power Controller Market, By Control Method |
6.3.1 Overview and Analysis |
6.3.2 Lithuania SCR Power Controller Market Revenues & Volume, By Phase Angle Control, 2022 - 2032F |
6.3.3 Lithuania SCR Power Controller Market Revenues & Volume, By Integral Cycle Switching, 2022 - 2032F |
6.4 Lithuania SCR Power Controller Market, By Industry |
6.4.1 Overview and Analysis |
6.4.2 Lithuania SCR Power Controller Market Revenues & Volume, By Glass, 2022 - 2032F |
6.4.3 Lithuania SCR Power Controller Market Revenues & Volume, By Oil & Gas, 2022 - 2032F |
6.4.4 Lithuania SCR Power Controller Market Revenues & Volume, By Metals, 2022 - 2032F |
6.4.5 Lithuania SCR Power Controller Market Revenues & Volume, By Textile, 2022 - 2032F |
6.4.6 Lithuania SCR Power Controller Market Revenues & Volume, By Plastics, 2022 - 2032F |
6.4.7 Lithuania SCR Power Controller Market Revenues & Volume, By Chemicals, 2022 - 2032F |
6.4.8 Lithuania SCR Power Controller Market Revenues & Volume, By Semiconductor, 2022 - 2032F |
6.4.9 Lithuania SCR Power Controller Market Revenues & Volume, By Semiconductor, 2022 - 2032F |
7 Lithuania SCR Power Controller Market Import-Export Trade Statistics |
7.1 Lithuania SCR Power Controller Market Export to Major Countries |
7.2 Lithuania SCR Power Controller Market Imports from Major Countries |
8 Lithuania SCR Power Controller Market Key Performance Indicators |
8.1 Percentage increase in the number of renewable energy projects in Lithuania. |
8.2 Energy savings achieved by industries and commercial sectors after implementing SCR power controllers. |
8.3 Number of government policies or incentives supporting the adoption of SCR power controllers. |
9 Lithuania SCR Power Controller Market - Opportunity Assessment |
9.1 Lithuania SCR Power Controller Market Opportunity Assessment, By Type , 2022 & 2032F |
9.2 Lithuania SCR Power Controller Market Opportunity Assessment, By Load Type , 2022 & 2032F |
9.3 Lithuania SCR Power Controller Market Opportunity Assessment, By Control Method , 2022 & 2032F |
9.4 Lithuania SCR Power Controller Market Opportunity Assessment, By Industry, 2022 & 2032F |
10 Lithuania SCR Power Controller Market - Competitive Landscape |
10.1 Lithuania SCR Power Controller Market Revenue Share, By Companies, 2025 |
10.2 Lithuania SCR Power Controller Market Competitive Benchmarking, By Operating and Technical Parameters |
11 Company Profiles |
12 Recommendations | 13 Disclaimer |
Export potential assessment - trade Analytics for 2030
Export potential enables firms to identify high-growth global markets with greater confidence by combining advanced trade intelligence with a structured quantitative methodology. The framework analyzes emerging demand trends and country-level import patterns while integrating macroeconomic and trade datasets such as GDP and population forecasts, bilateral import–export flows, tariff structures, elasticity differentials between developed and developing economies, geographic distance, and import demand projections. Using weighted trade values from 2020–2024 as the base period to project country-to-country export potential for 2030, these inputs are operationalized through calculated drivers such as gravity model parameters, tariff impact factors, and projected GDP per-capita growth. Through an analysis of hidden potentials, demand hotspots, and market conditions that are most favorable to success, this method enables firms to focus on target countries, maximize returns, and global expansion with data, backed by accuracy.
By factoring in the projected importer demand gap that is currently unmet and could be potential opportunity, it identifies the potential for the Exporter (Country) among 190 countries, against the general trade analysis, which identifies the biggest importer or exporter.
To discover high-growth global markets and optimize your business strategy:
Click Here
Pricing
- Single User License$ 1,995
- Department License$ 2,400
- Site License$ 3,120
- Global License$ 3,795

Search
Thought Leadership and Analyst Meet


Our Clients
Latest Reports
- Philippines Polyhydroxybutyrate-co-Hydroxyvalerate Market (2026-2032) | Trends, Insights, Challenges, Restraints, Competition, Size, Value, Forecast, Pricing, Share, Outlook, Revenue, Investment Opportunities, Strategy, Drivers, Demand, Growth, segmentation, Analysis, Companies
- Peru Polyhydroxybutyrate-co-Hydroxyvalerate Market (2026-2032) | Growth, Demand, Challenges, Share, Trends, Analysis, Pricing, Investment Opportunities, Drivers, Value, Forecast, Competition, Size, Companies, Insights, Outlook, Restraints, segmentation, Revenue, Strategy
- Pakistan Polyhydroxybutyrate-co-Hydroxyvalerate Market (2026-2032) | Restraints, segmentation, Pricing, Forecast, Share, Strategy, Competition, Trends, Insights, Drivers, Challenges, Growth, Revenue, Outlook, Value, Investment Opportunities, Companies, Size, Analysis, Demand
- Oman Polyhydroxybutyrate-co-Hydroxyvalerate Market (2026-2032) | Drivers, segmentation, Insights, Competition, Pricing, Outlook, Size, Revenue, Challenges, Forecast, Analysis, Growth, Value, Share, Trends, Investment Opportunities, Strategy, Restraints, Companies, Demand
- Nigeria Polyhydroxybutyrate-co-Hydroxyvalerate Market (2026-2032) | Value, Investment Opportunities, Analysis, Revenue, Restraints, Pricing, Outlook, Competition, Demand, Growth, Forecast, Companies, Trends, Challenges, segmentation, Drivers, Insights, Share, Size, Strategy
- Nepal Polyhydroxybutyrate-co-Hydroxyvalerate Market (2026-2032) | Insights, Analysis, Drivers, Share, Revenue, Demand, segmentation, Investment Opportunities, Competition, Forecast, Growth, Pricing, Companies, Strategy, Trends, Restraints, Challenges, Outlook, Size, Value
- Myanmar Polyhydroxybutyrate-co-Hydroxyvalerate Market (2026-2032) | Outlook, Revenue, Strategy, Restraints, Drivers, segmentation, Share, Forecast, Competition, Insights, Growth, Pricing, Size, Demand, Value, Companies, Trends, Challenges, Investment Opportunities, Analysis
- Morocco Polyhydroxybutyrate-co-Hydroxyvalerate Market (2026-2032) | Outlook, Investment Opportunities, Restraints, Strategy, Forecast, Challenges, Drivers, Growth, Companies, segmentation, Trends, Size, Competition, Revenue, Demand, Insights, Share, Analysis, Value, Pricing
- Mexico Polyhydroxybutyrate-co-Hydroxyvalerate Market (2026-2032) | Size, Drivers, Outlook, Share, Strategy, Growth, Pricing, Challenges, Companies, Demand, Value, Investment Opportunities, Restraints, Trends, Forecast, segmentation, Analysis, Insights, Competition, Revenue
- Malaysia Polyhydroxybutyrate-co-Hydroxyvalerate Market (2026-2032) | Share, segmentation, Size, Companies, Analysis, Insights, Forecast, Value, Revenue, Drivers, Restraints, Challenges, Investment Opportunities, Trends, Competition, Strategy, Demand, Growth, Outlook, Pricing
Industry Events and Analyst Meet

HIMTEX 2026

India Refining Summit 2026

India EV Show 2026

EV tech India Expo 2026

Auto Tech Asia 2026
Whitepaper
- Middle East & Africa Commercial Security Market Click here to view more.
- Middle East & Africa Fire Safety Systems & Equipment Market Click here to view more.
- GCC Drone Market Click here to view more.
- Middle East Lighting Fixture Market Click here to view more.
- GCC Physical & Perimeter Security Market Click here to view more.
6WResearch In News
- Doha a strategic location for EV manufacturing hub: IPA Qatar
- Demand for luxury TVs surging in the GCC, says Samsung
- Empowering Growth: The Thriving Journey of Bangladesh’s Cable Industry
- Demand for luxury TVs surging in the GCC, says Samsung
- Video call with a traditional healer? Once unthinkable, it’s now common in South Africa
- Intelligent Buildings To Smooth GCC’s Path To Net Zero