Lithuania Secondary Agricultural Nutrients Market (2026-2032) | Forecast, Growth, Segmentation, Value, Share, Industry, Competitive Landscape, Size & Revenue, Trends, Outlook, Analysis, Companies
Market Forecast By Nutrient Type (Sulphur, Calcium, Magnesium), By Application Method (Solid, Liquid), By Crop type (Cereals and Grains, Oilseeds and Pulses, Fruits and Vegetables, Turfs and Ornamentals, Others) And Competitive Landscape
| Product Code: ETC8050841 | Publication Date: Sep 2024 | Updated Date: Apr 2026 | Product Type: Market Research Report | |
| Publisher: 6Wresearch | Author: Dhaval Chaurasia | No. of Pages: 75 | No. of Figures: 35 | No. of Tables: 20 |
Lithuania Secondary Agricultural Nutrients Market Size (2020-2030)
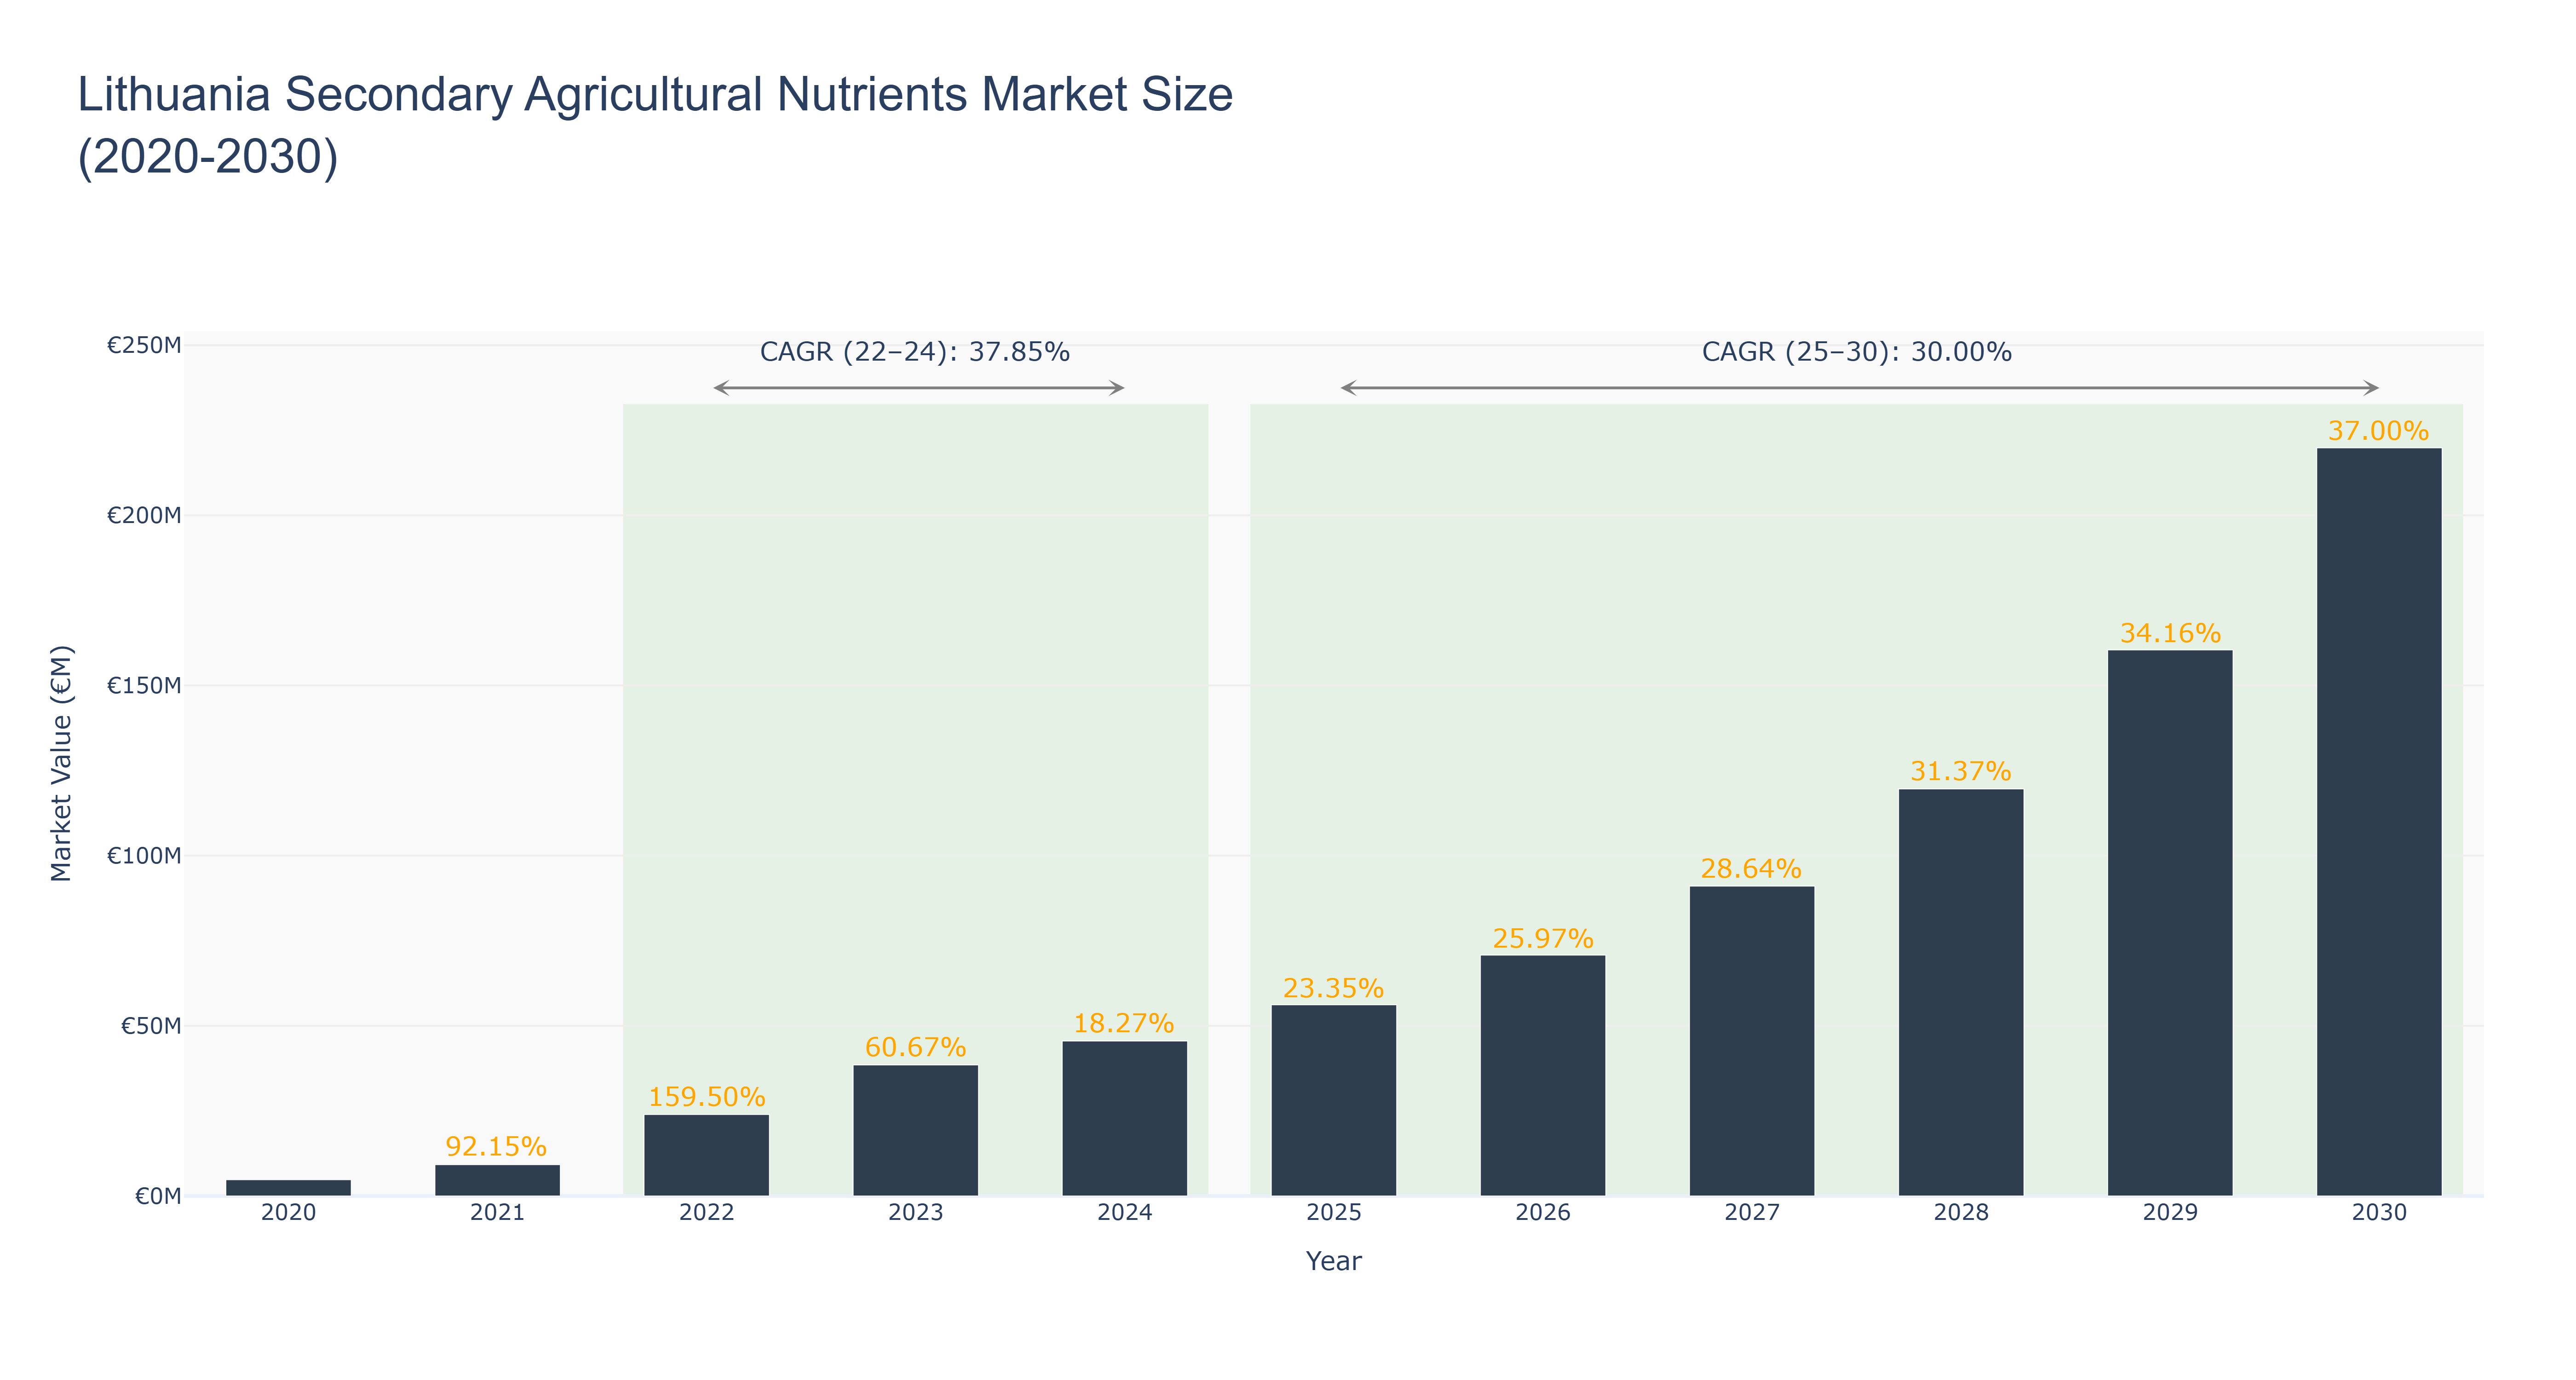
The Lithuania Secondary Agricultural Nutrients Market has shown a significant growth trend over the years. The peak market size was recorded at €219.83 million in 2030, with a steady increase from €4.81 million in 2020. The market experienced rapid growth from 2020 to 2024, with a compound annual growth rate (CAGR) of 37.85% during 2022-24. The forecasted growth from 2025 to 2030 is projected to continue at a CAGR of 30.0%. This growth can be attributed to increasing awareness about sustainable agricultural practices and the rising demand for secondary agricultural nutrients. Moving forward, upcoming projects in Lithuania aim to further enhance the efficiency of nutrient utilization in agriculture, fostering continued growth in the market. Industry drivers for this market include the emphasis on soil health and crop productivity, driving the demand for secondary agricultural nutrients. The future outlook remains optimistic, with ongoing developments focusing on innovative nutrient management solutions to support sustainable agricultural practices in Lithuania.
Lithuania Secondary Agricultural Nutrients Market: Production & Trade Performance (2019-2025)
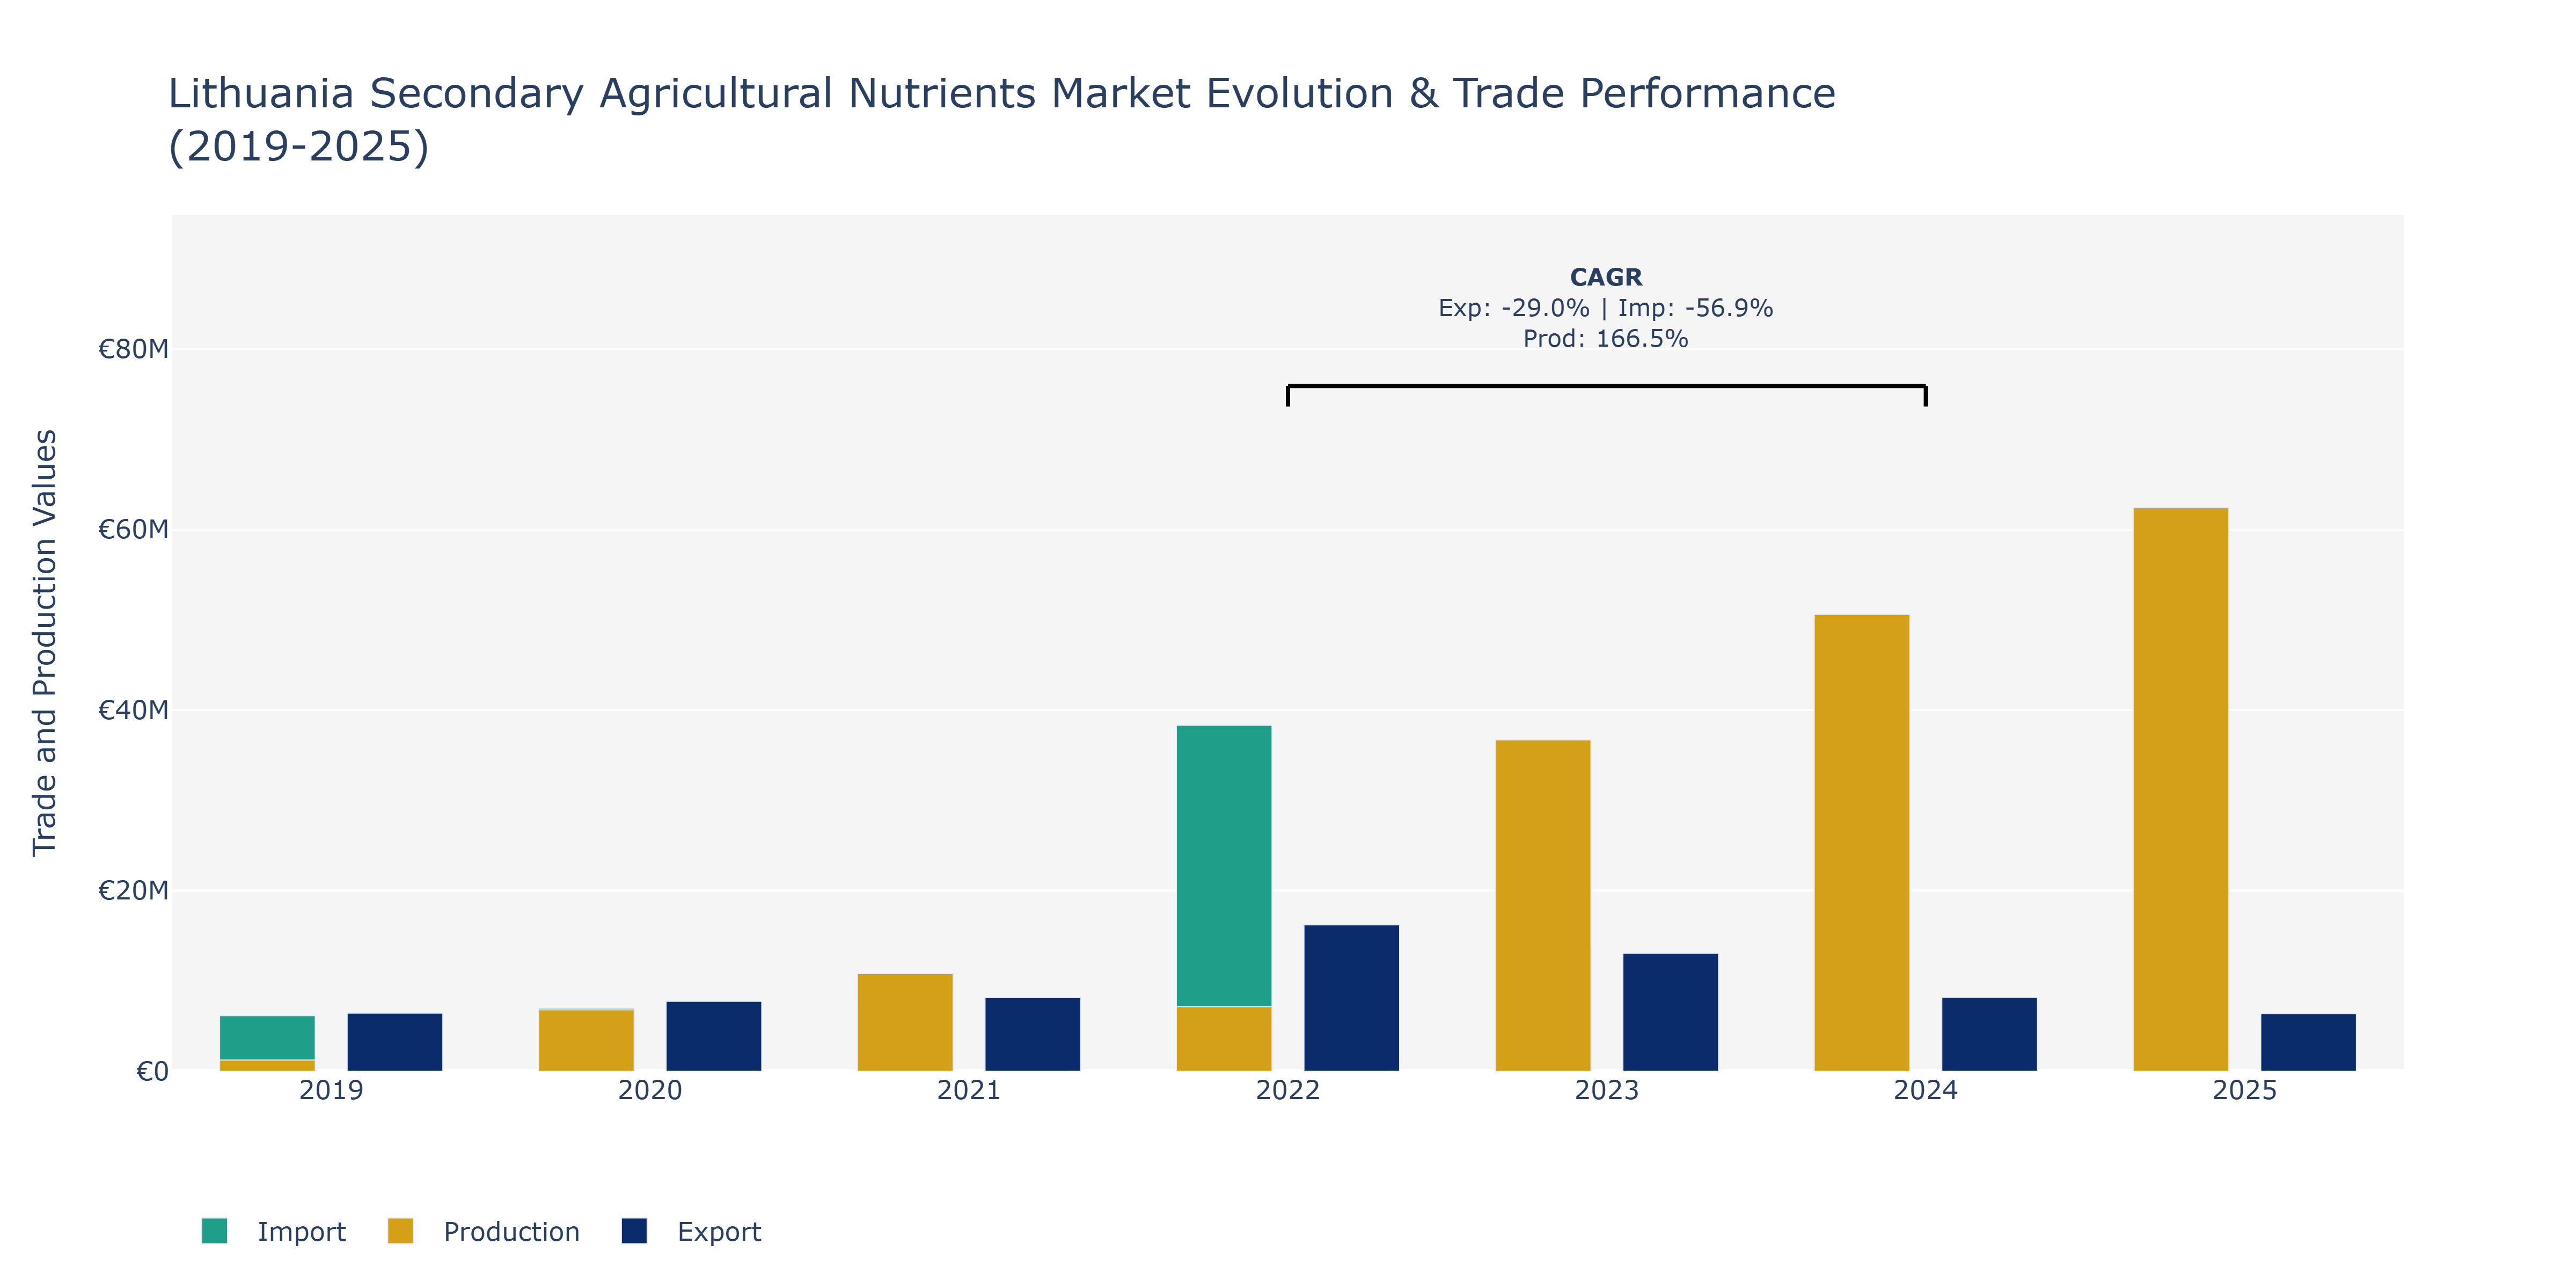
In the Lithuania Secondary Agricultural Nutrients Market, exports exhibited a fluctuating pattern over the years, starting at €6.44 million in 2019, peaking at €16.21 million in 2022, and then declining to €6.35 million in 2025. This volatility could be influenced by global demand shifts, changes in trade agreements, or variations in local production affecting export availability. Imports, on the other hand, saw a steady increase from €6.15 million in 2019 to €13.73 million in 2023 before decreasing slightly to €5.35 million in 2025. This rise followed by a dip may be attributed to changes in domestic consumption, currency fluctuations impacting import costs, and evolving regulatory frameworks affecting trade dynamics. Production in the market experienced a substantial growth from €1.24 million in 2019 to a peak of €62.42 million in 2025. This remarkable surge could be a result of technological advancements improving efficiency, increased investments in agricultural infrastructure, and government initiatives promoting agricultural productivity. Such developments indicate a dynamic market landscape where both domestic and international factors play a crucial role in shaping trade patterns and production outputs in the agricultural nutrients sector in Lithuania.
Key Highlights of the Report:
- Lithuania Secondary Agricultural Nutrients Market Outlook
- Market Size of Lithuania Secondary Agricultural Nutrients Market, 2025
- Forecast of Lithuania Secondary Agricultural Nutrients Market, 2032
- Historical Data and Forecast of Lithuania Secondary Agricultural Nutrients Revenues & Volume for the Period 2022 - 2032
- Lithuania Secondary Agricultural Nutrients Market Trend Evolution
- Lithuania Secondary Agricultural Nutrients Market Drivers and Challenges
- Lithuania Secondary Agricultural Nutrients Price Trends
- Lithuania Secondary Agricultural Nutrients Porter's Five Forces
- Lithuania Secondary Agricultural Nutrients Industry Life Cycle
- Historical Data and Forecast of Lithuania Secondary Agricultural Nutrients Market Revenues & Volume By Nutrient Type for the Period 2022 - 2032
- Historical Data and Forecast of Lithuania Secondary Agricultural Nutrients Market Revenues & Volume By Sulphur for the Period 2022 - 2032
- Historical Data and Forecast of Lithuania Secondary Agricultural Nutrients Market Revenues & Volume By Calcium for the Period 2022 - 2032
- Historical Data and Forecast of Lithuania Secondary Agricultural Nutrients Market Revenues & Volume By Magnesium for the Period 2022 - 2032
- Historical Data and Forecast of Lithuania Secondary Agricultural Nutrients Market Revenues & Volume By Application Method for the Period 2022 - 2032
- Historical Data and Forecast of Lithuania Secondary Agricultural Nutrients Market Revenues & Volume By Solid for the Period 2022 - 2032
- Historical Data and Forecast of Lithuania Secondary Agricultural Nutrients Market Revenues & Volume By Liquid for the Period 2022 - 2032
- Historical Data and Forecast of Lithuania Secondary Agricultural Nutrients Market Revenues & Volume By Crop type for the Period 2022 - 2032
- Historical Data and Forecast of Lithuania Secondary Agricultural Nutrients Market Revenues & Volume By Cereals and Grains for the Period 2022 - 2032
- Historical Data and Forecast of Lithuania Secondary Agricultural Nutrients Market Revenues & Volume By Oilseeds and Pulses for the Period 2022 - 2032
- Historical Data and Forecast of Lithuania Secondary Agricultural Nutrients Market Revenues & Volume By Fruits and Vegetables for the Period 2022 - 2032
- Historical Data and Forecast of Lithuania Secondary Agricultural Nutrients Market Revenues & Volume By Turfs and Ornamentals for the Period 2022 - 2032
- Historical Data and Forecast of Lithuania Secondary Agricultural Nutrients Market Revenues & Volume By Others for the Period 2022 - 2032
- Lithuania Secondary Agricultural Nutrients Import Export Trade Statistics
- Market Opportunity Assessment By Nutrient Type
- Market Opportunity Assessment By Application Method
- Market Opportunity Assessment By Crop type
- Lithuania Secondary Agricultural Nutrients Top Companies Market Share
- Lithuania Secondary Agricultural Nutrients Competitive Benchmarking By Technical and Operational Parameters
- Lithuania Secondary Agricultural Nutrients Company Profiles
- Lithuania Secondary Agricultural Nutrients Key Strategic Recommendations
Frequently Asked Questions About the Market Study (FAQs):
6Wresearch actively monitors the Lithuania Secondary Agricultural Nutrients Market and publishes its comprehensive annual report, highlighting emerging trends, growth drivers, revenue analysis, and forecast outlook. Our insights help businesses to make data-backed strategic decisions with ongoing market dynamics. Our analysts track relevent industries related to the Lithuania Secondary Agricultural Nutrients Market, allowing our clients with actionable intelligence and reliable forecasts tailored to emerging regional needs.
Yes, we provide customisation as per your requirements. To learn more, feel free to contact us on sales@6wresearch.com
1 Executive Summary |
2 Introduction |
2.1 Key Highlights of the Report |
2.2 Report Description |
2.3 Market Scope & Segmentation |
2.4 Research Methodology |
2.5 Assumptions |
3 Lithuania Secondary Agricultural Nutrients Market Overview |
3.1 Lithuania Country Macro Economic Indicators |
3.2 Lithuania Secondary Agricultural Nutrients Market Revenues & Volume, 2022 & 2032F |
3.3 Lithuania Secondary Agricultural Nutrients Market - Industry Life Cycle |
3.4 Lithuania Secondary Agricultural Nutrients Market - Porter's Five Forces |
3.5 Lithuania Secondary Agricultural Nutrients Market Revenues & Volume Share, By Nutrient Type, 2022 & 2032F |
3.6 Lithuania Secondary Agricultural Nutrients Market Revenues & Volume Share, By Application Method, 2022 & 2032F |
3.7 Lithuania Secondary Agricultural Nutrients Market Revenues & Volume Share, By Crop type, 2022 & 2032F |
4 Lithuania Secondary Agricultural Nutrients Market Dynamics |
4.1 Impact Analysis |
4.2 Market Drivers |
4.2.1 Increasing awareness about sustainable agriculture practices |
4.2.2 Government initiatives promoting the use of secondary agricultural nutrients |
4.2.3 Growing focus on improving soil health and fertility |
4.3 Market Restraints |
4.3.1 Limited availability and access to advanced agricultural technologies |
4.3.2 Fluctuating prices of raw materials for secondary agricultural nutrients |
4.3.3 Lack of standardized regulations in the secondary agricultural nutrients market |
5 Lithuania Secondary Agricultural Nutrients Market Trends |
6 Lithuania Secondary Agricultural Nutrients Market, By Types |
6.1 Lithuania Secondary Agricultural Nutrients Market, By Nutrient Type |
6.1.1 Overview and Analysis |
6.1.2 Lithuania Secondary Agricultural Nutrients Market Revenues & Volume, By Nutrient Type, 2022 - 2032F |
6.1.3 Lithuania Secondary Agricultural Nutrients Market Revenues & Volume, By Sulphur, 2022 - 2032F |
6.1.4 Lithuania Secondary Agricultural Nutrients Market Revenues & Volume, By Calcium, 2022 - 2032F |
6.1.5 Lithuania Secondary Agricultural Nutrients Market Revenues & Volume, By Magnesium, 2022 - 2032F |
6.2 Lithuania Secondary Agricultural Nutrients Market, By Application Method |
6.2.1 Overview and Analysis |
6.2.2 Lithuania Secondary Agricultural Nutrients Market Revenues & Volume, By Solid, 2022 - 2032F |
6.2.3 Lithuania Secondary Agricultural Nutrients Market Revenues & Volume, By Liquid, 2022 - 2032F |
6.3 Lithuania Secondary Agricultural Nutrients Market, By Crop type |
6.3.1 Overview and Analysis |
6.3.2 Lithuania Secondary Agricultural Nutrients Market Revenues & Volume, By Cereals and Grains, 2022 - 2032F |
6.3.3 Lithuania Secondary Agricultural Nutrients Market Revenues & Volume, By Oilseeds and Pulses, 2022 - 2032F |
6.3.4 Lithuania Secondary Agricultural Nutrients Market Revenues & Volume, By Fruits and Vegetables, 2022 - 2032F |
6.3.5 Lithuania Secondary Agricultural Nutrients Market Revenues & Volume, By Turfs and Ornamentals, 2022 - 2032F |
6.3.6 Lithuania Secondary Agricultural Nutrients Market Revenues & Volume, By Others, 2022 - 2032F |
7 Lithuania Secondary Agricultural Nutrients Market Import-Export Trade Statistics |
7.1 Lithuania Secondary Agricultural Nutrients Market Export to Major Countries |
7.2 Lithuania Secondary Agricultural Nutrients Market Imports from Major Countries |
8 Lithuania Secondary Agricultural Nutrients Market Key Performance Indicators |
8.1 Soil pH levels in agricultural lands |
8.2 Adoption rate of secondary agricultural nutrients among farmers |
8.3 Percentage of agricultural land using sustainable farming practices |
9 Lithuania Secondary Agricultural Nutrients Market - Opportunity Assessment |
9.1 Lithuania Secondary Agricultural Nutrients Market Opportunity Assessment, By Nutrient Type, 2022 & 2032F |
9.2 Lithuania Secondary Agricultural Nutrients Market Opportunity Assessment, By Application Method, 2022 & 2032F |
9.3 Lithuania Secondary Agricultural Nutrients Market Opportunity Assessment, By Crop type, 2022 & 2032F |
10 Lithuania Secondary Agricultural Nutrients Market - Competitive Landscape |
10.1 Lithuania Secondary Agricultural Nutrients Market Revenue Share, By Companies, 2025 |
10.2 Lithuania Secondary Agricultural Nutrients Market Competitive Benchmarking, By Operating and Technical Parameters |
11 Company Profiles |
12 Recommendations |
13 Disclaimer |
Export potential assessment - trade Analytics for 2030
Export potential enables firms to identify high-growth global markets with greater confidence by combining advanced trade intelligence with a structured quantitative methodology. The framework analyzes emerging demand trends and country-level import patterns while integrating macroeconomic and trade datasets such as GDP and population forecasts, bilateral import–export flows, tariff structures, elasticity differentials between developed and developing economies, geographic distance, and import demand projections. Using weighted trade values from 2020–2024 as the base period to project country-to-country export potential for 2030, these inputs are operationalized through calculated drivers such as gravity model parameters, tariff impact factors, and projected GDP per-capita growth. Through an analysis of hidden potentials, demand hotspots, and market conditions that are most favorable to success, this method enables firms to focus on target countries, maximize returns, and global expansion with data, backed by accuracy.
By factoring in the projected importer demand gap that is currently unmet and could be potential opportunity, it identifies the potential for the Exporter (Country) among 190 countries, against the general trade analysis, which identifies the biggest importer or exporter.
To discover high-growth global markets and optimize your business strategy:
Click Here
Pricing
- Single User License$ 1,995
- Department License$ 2,400
- Site License$ 3,120
- Global License$ 3,795

Search
Thought Leadership and Analyst Meet


Our Clients
Latest Reports
- France Thermally Conductive Filler Dispersants Market (2026-2032) | Challenges, Restraints, Value, Share, Size, segmentation, Analysis, Trends, Investment Opportunities, Outlook, Pricing, Demand, Forecast, Revenue, Companies, Growth, Drivers, Strategy, Insights, Competition
- Egypt Thermally Conductive Filler Dispersants Market (2026-2032) | Competition, Forecast, Strategy, Value, Insights, Outlook, Investment Opportunities, Pricing, Demand, Share, segmentation, Drivers, Size, Companies, Restraints, Growth, Trends, Revenue, Challenges, Analysis
- Czech Republic Thermally Conductive Filler Dispersants Market (2026-2032) | Forecast, Pricing, Analysis, Drivers, Insights, Size, Demand, Growth, Challenges, segmentation, Competition, Outlook, Trends, Investment Opportunities, Companies, Strategy, Revenue, Share, Value, Restraints
- Colombia Thermally Conductive Filler Dispersants Market (2026-2032) | segmentation, Trends, Share, Drivers, Strategy, Companies, Demand, Insights, Size, Challenges, Value, Competition, Analysis, Growth, Revenue, Restraints, Forecast, Pricing, Outlook, Investment Opportunities
- China Thermally Conductive Filler Dispersants Market (2026-2032) | Restraints, Investment Opportunities, Pricing, Companies, Share, Size, Challenges, Trends, Outlook, Value, Analysis, Competition, Revenue, Drivers, Forecast, Demand, Insights, Growth, Strategy, segmentation
- Chile Thermally Conductive Filler Dispersants Market (2026-2032) | Investment Opportunities, Trends, Value, Restraints, Share, Companies, Forecast, segmentation, Pricing, Challenges, Demand, Size, Analysis, Drivers, Outlook, Growth, Competition, Strategy, Revenue, Insights
- Cambodia Thermally Conductive Filler Dispersants Market (2026-2032) | Analysis, Share, Outlook, Strategy, Pricing, Demand, Size, Growth, segmentation, Insights, Revenue, Forecast, Challenges, Competition, Companies, Investment Opportunities, Trends, Restraints, Value, Drivers
- Brazil Thermally Conductive Filler Dispersants Market (2026-2032) | Restraints, Forecast, Competition, Size, Revenue, Value, Investment Opportunities, Trends, Insights, Outlook, Growth, Analysis, Drivers, segmentation, Pricing, Challenges, Strategy, Share, Companies, Demand
- Bangladesh Thermally Conductive Filler Dispersants Market (2026-2032) | Restraints, Trends, Analysis, Competition, Insights, Forecast, Value, Investment Opportunities, Pricing, Share, Demand, Outlook, Revenue, segmentation, Companies, Drivers, Growth, Size, Challenges, Strategy
- Bahrain Thermally Conductive Filler Dispersants Market (2026-2032) | Trends, Outlook, Pricing, Demand, Value, Competition, Forecast, Growth, segmentation, Revenue, Companies, Analysis, Insights, Size, Drivers, Challenges, Strategy, Investment Opportunities, Share, Restraints
Industry Events and Analyst Meet

HIMTEX 2026

India Refining Summit 2026

India EV Show 2026

EV tech India Expo 2026

Auto Tech Asia 2026
Whitepaper
- Middle East & Africa Commercial Security Market Click here to view more.
- Middle East & Africa Fire Safety Systems & Equipment Market Click here to view more.
- GCC Drone Market Click here to view more.
- Middle East Lighting Fixture Market Click here to view more.
- GCC Physical & Perimeter Security Market Click here to view more.
6WResearch In News
- Doha a strategic location for EV manufacturing hub: IPA Qatar
- Demand for luxury TVs surging in the GCC, says Samsung
- Empowering Growth: The Thriving Journey of Bangladesh’s Cable Industry
- Demand for luxury TVs surging in the GCC, says Samsung
- Video call with a traditional healer? Once unthinkable, it’s now common in South Africa
- Intelligent Buildings To Smooth GCC’s Path To Net Zero