Lithuania Shaving Cream Market (2026-2032) | Trends, Segmentation, Analysis, Share, Revenue, Growth, Value, Forecast, Companies, Industry, Outlook & Size
Market Forecast By Product Types (Aftershave, Pre-shave, ), By Applications (Household, Hotel, Commercial, ), By Distribution Channels ( Supermarkets, Specialty Stores, Drug Stores, Convenience Stores, Online Retail) And Competitive Landscape
| Product Code: ETC5318330 | Publication Date: Nov 2023 | Updated Date: Apr 2026 | Product Type: Market Research Report | |
| Publisher: 6Wresearch | Author: Ravi Bhandari | No. of Pages: 60 | No. of Figures: 30 | No. of Tables: 5 |
Lithuania Shaving Cream Market Size (2020-2030)
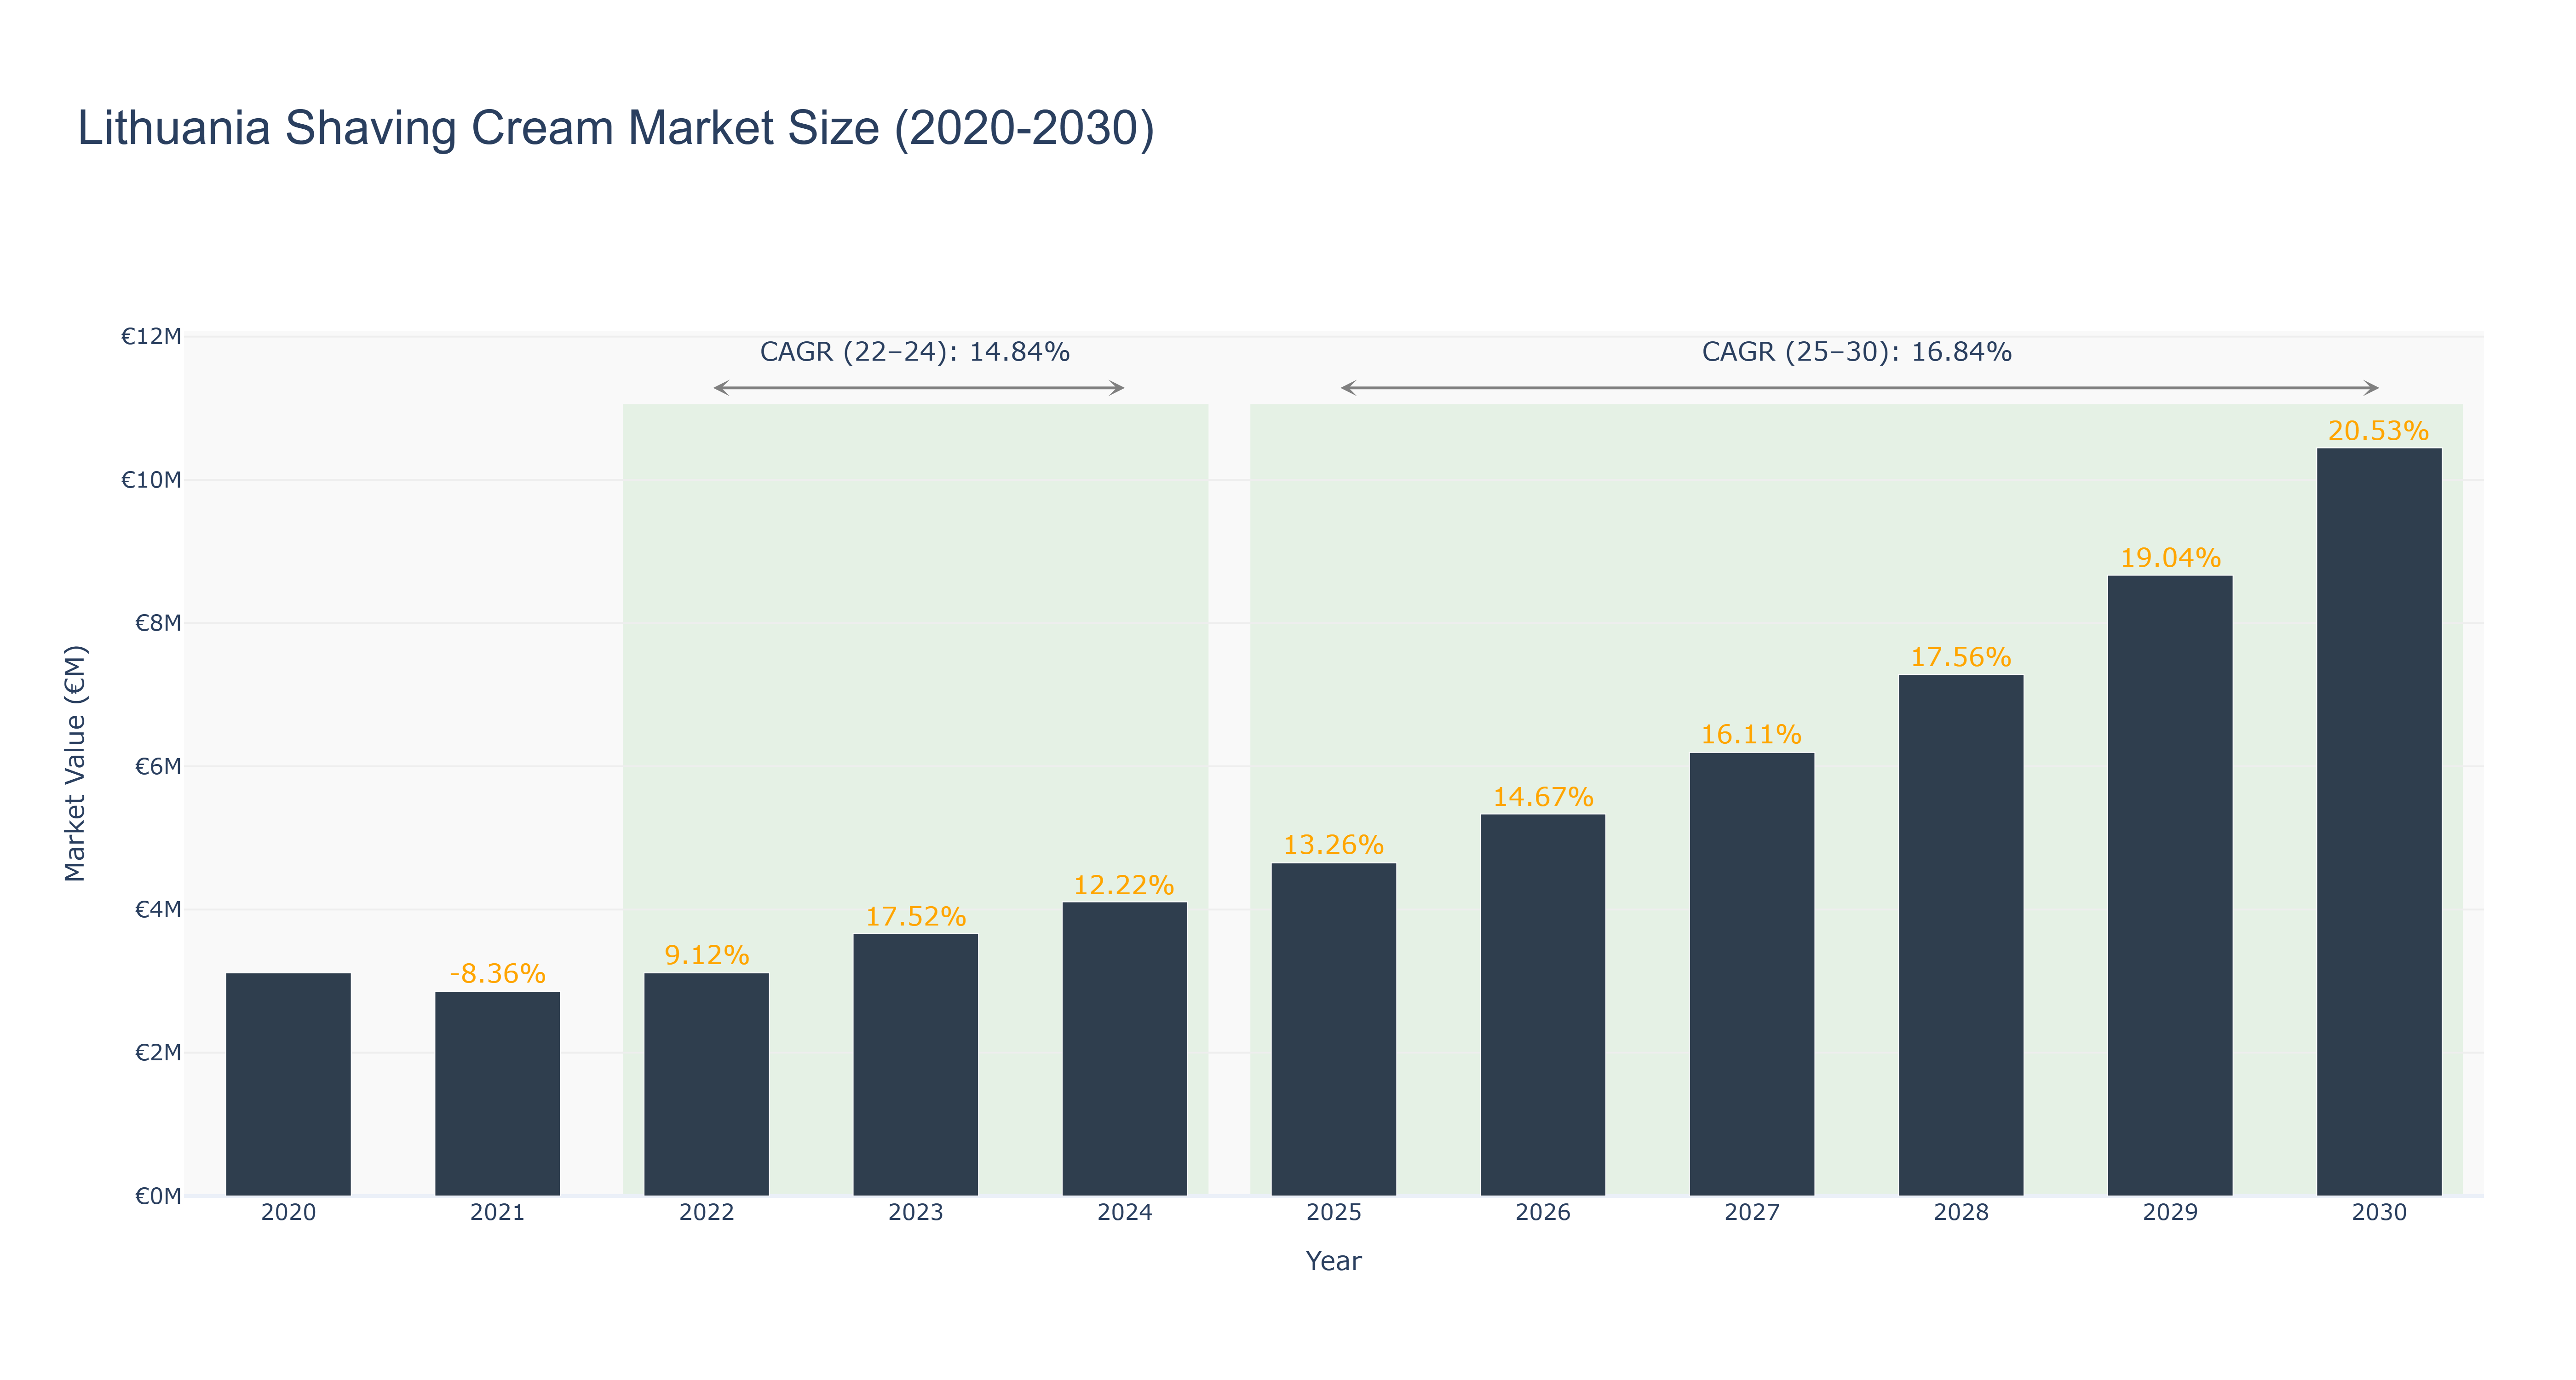
The Lithuania Shaving Cream Market has shown a steady growth trajectory over the years. The market peaked at €10.45 million in 2030, with a notable increase in size from €3.11 million in 2020 to €4.11 million in 2024. The forecasted market size is expected to continue growing from €4.65 million in 2025 to €10.45 million in 2030, with a CAGR of 16.83% from 2025 to 2030. The market experienced a significant growth rate due to changing consumer preferences towards grooming products and an increasing focus on personal care. Recent developments in the Lithuanian market include the introduction of eco-friendly shaving cream products and collaborations with local influencers to promote sustainable grooming practices. Moving forward, investments in innovative product formulations and expanding distribution networks are expected to drive further growth in the Lithuania Shaving Cream Market.
Lithuania Shaving Cream Market: Production & Trade Performance (2019-2025)
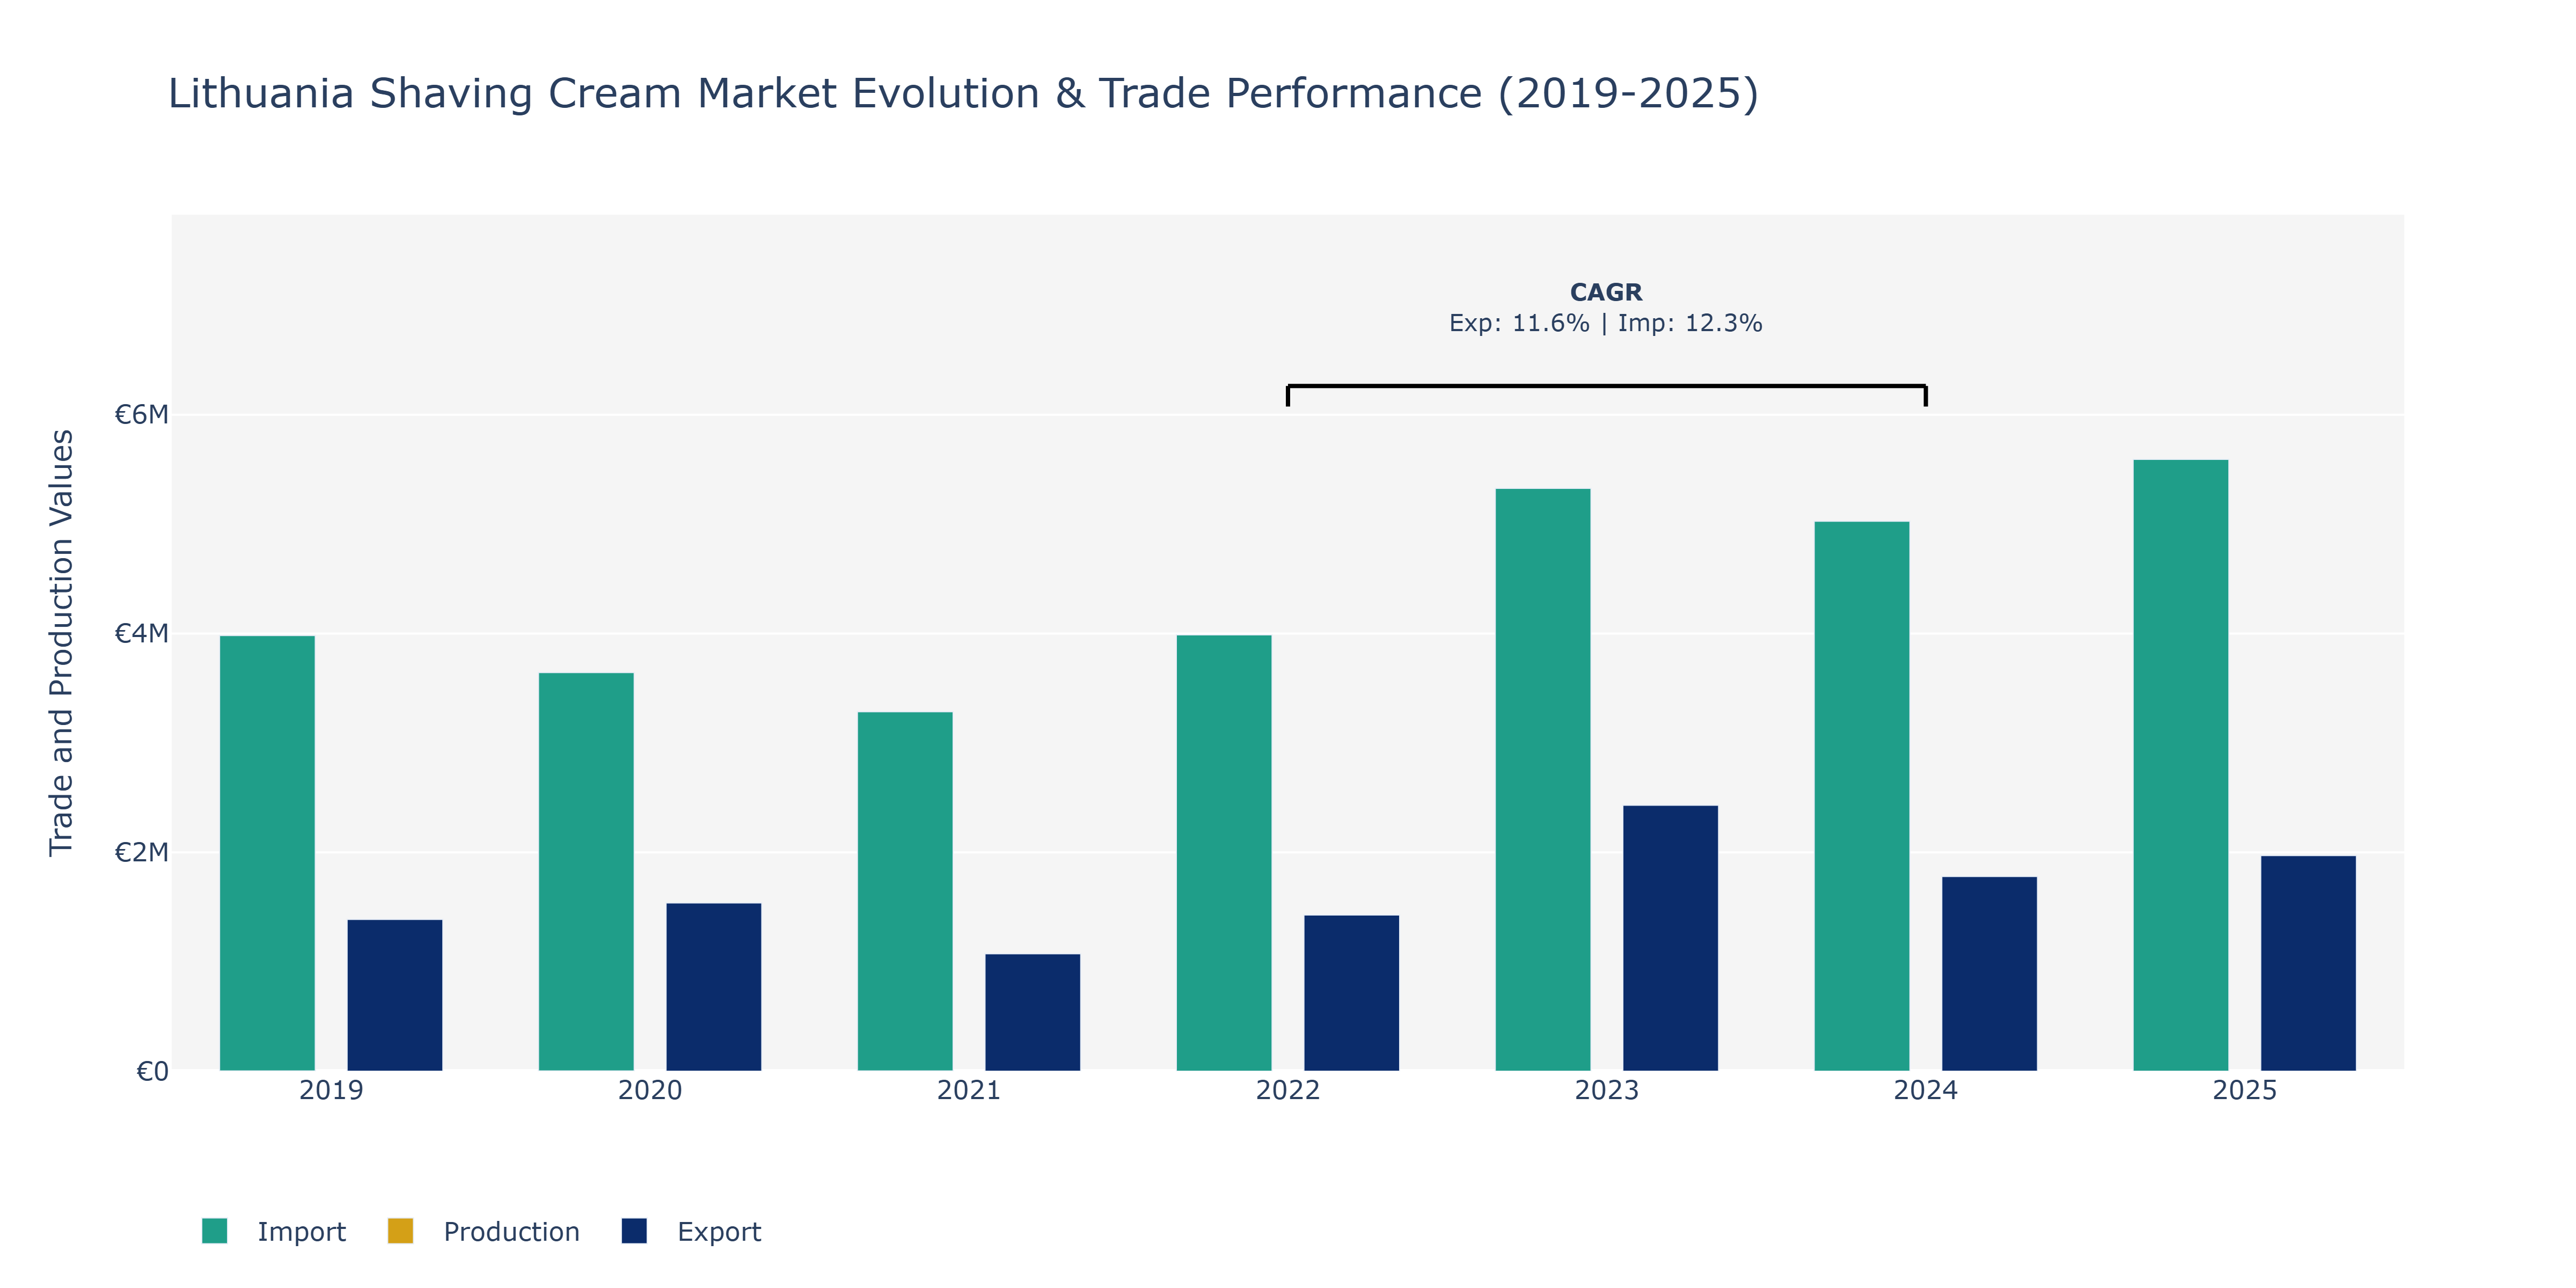
In the Lithuania Shaving Cream Market, exports experienced fluctuations over the years, starting at €1.39 million in 2019, peaking at €2.43 million in 2023, and then stabilizing around €1.98 million in 2025. Imports followed a similar pattern, beginning at €3.98 million in 2019, reaching a peak of €5.60 million in 2025. Production remained relatively constant at around €2.74 million in 2019 and 2020, with a slight decrease to €3.00 million in 2021 and 2022. The observed increase in exports and imports can be attributed to growing demand for personal grooming products in Lithuania, influenced by changing consumer preferences towards grooming routines and an increase in disposable income. The stability in production levels may indicate consistent manufacturing capabilities and supply chain efficiency within the market, ensuring a steady flow of shaving cream products to meet domestic and international demand.
Key Highlights of the Report:
- Lithuania Shaving Cream Market Outlook
- Market Size of Lithuania Shaving Cream Market, 2025
- Forecast of Lithuania Shaving Cream Market, 2032
- Historical Data and Forecast of Lithuania Shaving Cream Revenues & Volume for the Period 2022 - 2032F
- Lithuania Shaving Cream Market Trend Evolution
- Lithuania Shaving Cream Market Drivers and Challenges
- Lithuania Shaving Cream Price Trends
- Lithuania Shaving Cream Porter`s Five Forces
- Lithuania Shaving Cream Industry Life Cycle
- Historical Data and Forecast of Lithuania Shaving Cream Market Revenues & Volume By Product Types for the Period 2022 - 2032F
- Historical Data and Forecast of Lithuania Shaving Cream Market Revenues & Volume By Aftershave for the Period 2022 - 2032F
- Historical Data and Forecast of Lithuania Shaving Cream Market Revenues & Volume By Pre-shave for the Period 2022 - 2032F
- Historical Data and Forecast of Lithuania Shaving Cream Market Revenues & Volume By for the Period 2022 - 2032F
- Historical Data and Forecast of Lithuania Shaving Cream Market Revenues & Volume By Applications for the Period 2022 - 2032F
- Historical Data and Forecast of Lithuania Shaving Cream Market Revenues & Volume By Household for the Period 2022 - 2032F
- Historical Data and Forecast of Lithuania Shaving Cream Market Revenues & Volume By Hotel for the Period 2022 - 2032F
- Historical Data and Forecast of Lithuania Shaving Cream Market Revenues & Volume By Commercial for the Period 2022 - 2032F
- Historical Data and Forecast of Lithuania Shaving Cream Market Revenues & Volume By for the Period 2022 - 2032F
- Historical Data and Forecast of Lithuania Shaving Cream Market Revenues & Volume By Distribution Channels for the Period 2022 - 2032F
- Historical Data and Forecast of Lithuania Shaving Cream Market Revenues & Volume By Supermarkets for the Period 2022 - 2032F
- Historical Data and Forecast of Lithuania Shaving Cream Market Revenues & Volume By Specialty Stores for the Period 2022 - 2032F
- Historical Data and Forecast of Lithuania Shaving Cream Market Revenues & Volume By Drug Stores for the Period 2022 - 2032F
- Historical Data and Forecast of Lithuania Shaving Cream Market Revenues & Volume By Convenience Stores for the Period 2022 - 2032F
- Historical Data and Forecast of Lithuania Shaving Cream Market Revenues & Volume By Online Retail for the Period 2022 - 2032F
- Lithuania Shaving Cream Import Export Trade Statistics
- Market Opportunity Assessment By Product Types
- Market Opportunity Assessment By Applications
- Market Opportunity Assessment By Distribution Channels
- Lithuania Shaving Cream Top Companies Market Share
- Lithuania Shaving Cream Competitive Benchmarking By Technical and Operational Parameters
- Lithuania Shaving Cream Company Profiles
- Lithuania Shaving Cream Key Strategic Recommendations
Frequently Asked Questions About the Market Study (FAQs):
6Wresearch actively monitors the Lithuania Shaving Cream Market and publishes its comprehensive annual report, highlighting emerging trends, growth drivers, revenue analysis, and forecast outlook. Our insights help businesses to make data-backed strategic decisions with ongoing market dynamics. Our analysts track relevent industries related to the Lithuania Shaving Cream Market, allowing our clients with actionable intelligence and reliable forecasts tailored to emerging regional needs.
Yes, we provide customisation as per your requirements. To learn more, feel free to contact us on sales@6wresearch.com
1 Executive Summary |
2 Introduction |
2.1 Key Highlights of the Report |
2.2 Report Description |
2.3 Market Scope & Segmentation |
2.4 Research Methodology |
2.5 Assumptions |
3 Lithuania Shaving Cream Market Overview |
3.1 Lithuania Country Macro Economic Indicators |
3.2 Lithuania Shaving Cream Market Revenues & Volume, 2022 & 2032F |
3.3 Lithuania Shaving Cream Market - Industry Life Cycle |
3.4 Lithuania Shaving Cream Market - Porter's Five Forces |
3.5 Lithuania Shaving Cream Market Revenues & Volume Share, By Product Types, 2022 & 2032F |
3.6 Lithuania Shaving Cream Market Revenues & Volume Share, By Applications , 2022 & 2032F |
3.7 Lithuania Shaving Cream Market Revenues & Volume Share, By Distribution Channels, 2022 & 2032F |
4 Lithuania Shaving Cream Market Dynamics |
4.1 Impact Analysis |
4.2 Market Drivers |
4.2.1 Increasing focus on personal grooming and hygiene |
4.2.2 Growing disposable income levels among consumers |
4.2.3 Rising awareness about skincare and grooming products |
4.3 Market Restraints |
4.3.1 Competition from alternative grooming products such as shaving gels and foams |
4.3.2 Price sensitivity among consumers |
4.3.3 Limited availability of premium shaving cream brands in the market |
5 Lithuania Shaving Cream Market Trends |
6 Lithuania Shaving Cream Market Segmentations |
6.1 Lithuania Shaving Cream Market, By Product Types |
6.1.1 Overview and Analysis |
6.1.2 Lithuania Shaving Cream Market Revenues & Volume, By Aftershave, 2022 - 2032F |
6.1.3 Lithuania Shaving Cream Market Revenues & Volume, By Pre-shave, 2022 - 2032F |
6.1.4 Lithuania Shaving Cream Market Revenues & Volume, By ? , 2022 - 2032F |
6.2 Lithuania Shaving Cream Market, By Applications |
6.2.1 Overview and Analysis |
6.2.2 Lithuania Shaving Cream Market Revenues & Volume, By Household, 2022 - 2032F |
6.2.3 Lithuania Shaving Cream Market Revenues & Volume, By Hotel, 2022 - 2032F |
6.2.4 Lithuania Shaving Cream Market Revenues & Volume, By Commercial, 2022 - 2032F |
6.2.5 Lithuania Shaving Cream Market Revenues & Volume, By ? , 2022 - 2032F |
6.3 Lithuania Shaving Cream Market, By Distribution Channels |
6.3.1 Overview and Analysis |
6.3.2 Lithuania Shaving Cream Market Revenues & Volume, By Supermarkets, 2022 - 2032F |
6.3.3 Lithuania Shaving Cream Market Revenues & Volume, By Specialty Stores, 2022 - 2032F |
6.3.4 Lithuania Shaving Cream Market Revenues & Volume, By Drug Stores, 2022 - 2032F |
6.3.5 Lithuania Shaving Cream Market Revenues & Volume, By Convenience Stores, 2022 - 2032F |
6.3.6 Lithuania Shaving Cream Market Revenues & Volume, By Online Retail, 2022 - 2032F |
7 Lithuania Shaving Cream Market Import-Export Trade Statistics |
7.1 Lithuania Shaving Cream Market Export to Major Countries |
7.2 Lithuania Shaving Cream Market Imports from Major Countries |
8 Lithuania Shaving Cream Market Key Performance Indicators |
8.1 Average customer rating and feedback on the quality and effectiveness of shaving creams |
8.2 Number of new product launches and innovations in the shaving cream segment |
8.3 Frequency of promotional activities and marketing campaigns by key players in the market |
9 Lithuania Shaving Cream Market - Opportunity Assessment |
9.1 Lithuania Shaving Cream Market Opportunity Assessment, By Product Types, 2022 & 2032F |
9.2 Lithuania Shaving Cream Market Opportunity Assessment, By Applications , 2022 & 2032F |
9.3 Lithuania Shaving Cream Market Opportunity Assessment, By Distribution Channels, 2022 & 2032F |
10 Lithuania Shaving Cream Market - Competitive Landscape |
10.1 Lithuania Shaving Cream Market Revenue Share, By Companies, 2025 |
10.2 Lithuania Shaving Cream Market Competitive Benchmarking, By Operating and Technical Parameters |
11 Company Profiles |
12 Recommendations | 13 Disclaimer |
Global Go To Market Strategy - 2030
Export potential enables firms to identify high-growth global markets with greater confidence by combining advanced trade intelligence with a structured quantitative methodology. The framework analyzes emerging demand trends and country-level import patterns while integrating macroeconomic and trade datasets such as GDP and population forecasts, bilateral import–export flows, tariff structures, elasticity differentials between developed and developing economies, geographic distance, and import demand projections. Using weighted trade values from 2020–2024 as the base period to project country-to-country export potential for 2030, these inputs are operationalized through calculated drivers such as gravity model parameters, tariff impact factors, and projected GDP per-capita growth. Through an analysis of hidden potentials, demand hotspots, and market conditions that are most favorable to success, this method enables firms to focus on target countries, maximize returns, and global expansion with data, backed by accuracy.
By factoring in the projected importer demand gap that is currently unmet and could be potential opportunity, it identifies the potential for the Exporter (Country) among 190 countries, against the general trade analysis, which identifies the biggest importer or exporter.
To discover high-growth global markets and optimize your business strategy:
Click Here
Pricing
- Single User License$ 1,995
- Department License$ 2,400
- Site License$ 3,120
- Global License$ 3,795

Leadership Perspectives from Industry Events
Search
Thought Leadership and Analyst Meet


Our Clients
6WResearch In News
- Doha a strategic location for EV manufacturing hub: IPA Qatar
- Demand for luxury TVs surging in the GCC, says Samsung
- Empowering Growth: The Thriving Journey of Bangladesh’s Cable Industry
- Demand for luxury TVs surging in the GCC, says Samsung
- Video call with a traditional healer? Once unthinkable, it’s now common in South Africa
- Intelligent Buildings To Smooth GCC’s Path To Net Zero
Latest Reports
- New Zealand Aseptic Manufacturing Market (2026-2032)
- Netherlands Aseptic Manufacturing Market (2026-2032)
- Nauru Aseptic Manufacturing Market (2026-2032)
- Namibia Aseptic Manufacturing Market (2026-2032)
- Mozambique Aseptic Manufacturing Market (2026-2032)
- Montenegro Aseptic Manufacturing Market (2026-2032)
- Mongolia Aseptic Manufacturing Market (2026-2032)
- Monaco Aseptic Manufacturing Market (2026-2032)
- Micronesia Aseptic Manufacturing Market (2026-2032)
- Mauritius Aseptic Manufacturing Market (2026-2032)
Industry Events and Analyst Meet

HIMTEX 2026

India Refining Summit 2026

India EV Show 2026

EV tech India Expo 2026

Auto Tech Asia 2026
Whitepaper
- Middle East & Africa Commercial Security Market Click here to view more.
- Middle East & Africa Fire Safety Systems & Equipment Market Click here to view more.
- GCC Drone Market Click here to view more.
- Middle East Lighting Fixture Market Click here to view more.
- GCC Physical & Perimeter Security Market Click here to view more.