Lithuania Sour Cream Powder Market (2026-2032) | Segmentation, Strategic Insights, Competition, Segments, Size, Analysis, Trends, Investment Trends, Supply, Consumer Insights, Restraints, Industry, Growth, Share, Pricing Analysis, Challenges, Drivers, Outlook, Opportunities, Strategy, Revenue, Forecast, Value, Companies, Demand, Competitive
Market Forecast By Type (Instant, Flavored, Plain, Organic), By Packaging (Pouch, Box, Can, Jar), By Application (Culinary, Dairy based Products, Snack Foods, Beverage), By Distribution Channel (Online, Retail, Supermarkets, Hypermarkets), By End Use (Household, Foodservice, Restaurants, Catering) And Competitive Landscape
| Product Code: ETC10296954 | Publication Date: Apr 2025 | Updated Date: Apr 2026 | Product Type: Market Research Report | |
| Publisher: 6Wresearch | No. of Pages: 65 | No. of Figures: 34 | No. of Tables: 19 | |
Lithuania Sour Cream Powder Market Size (2020-2030)
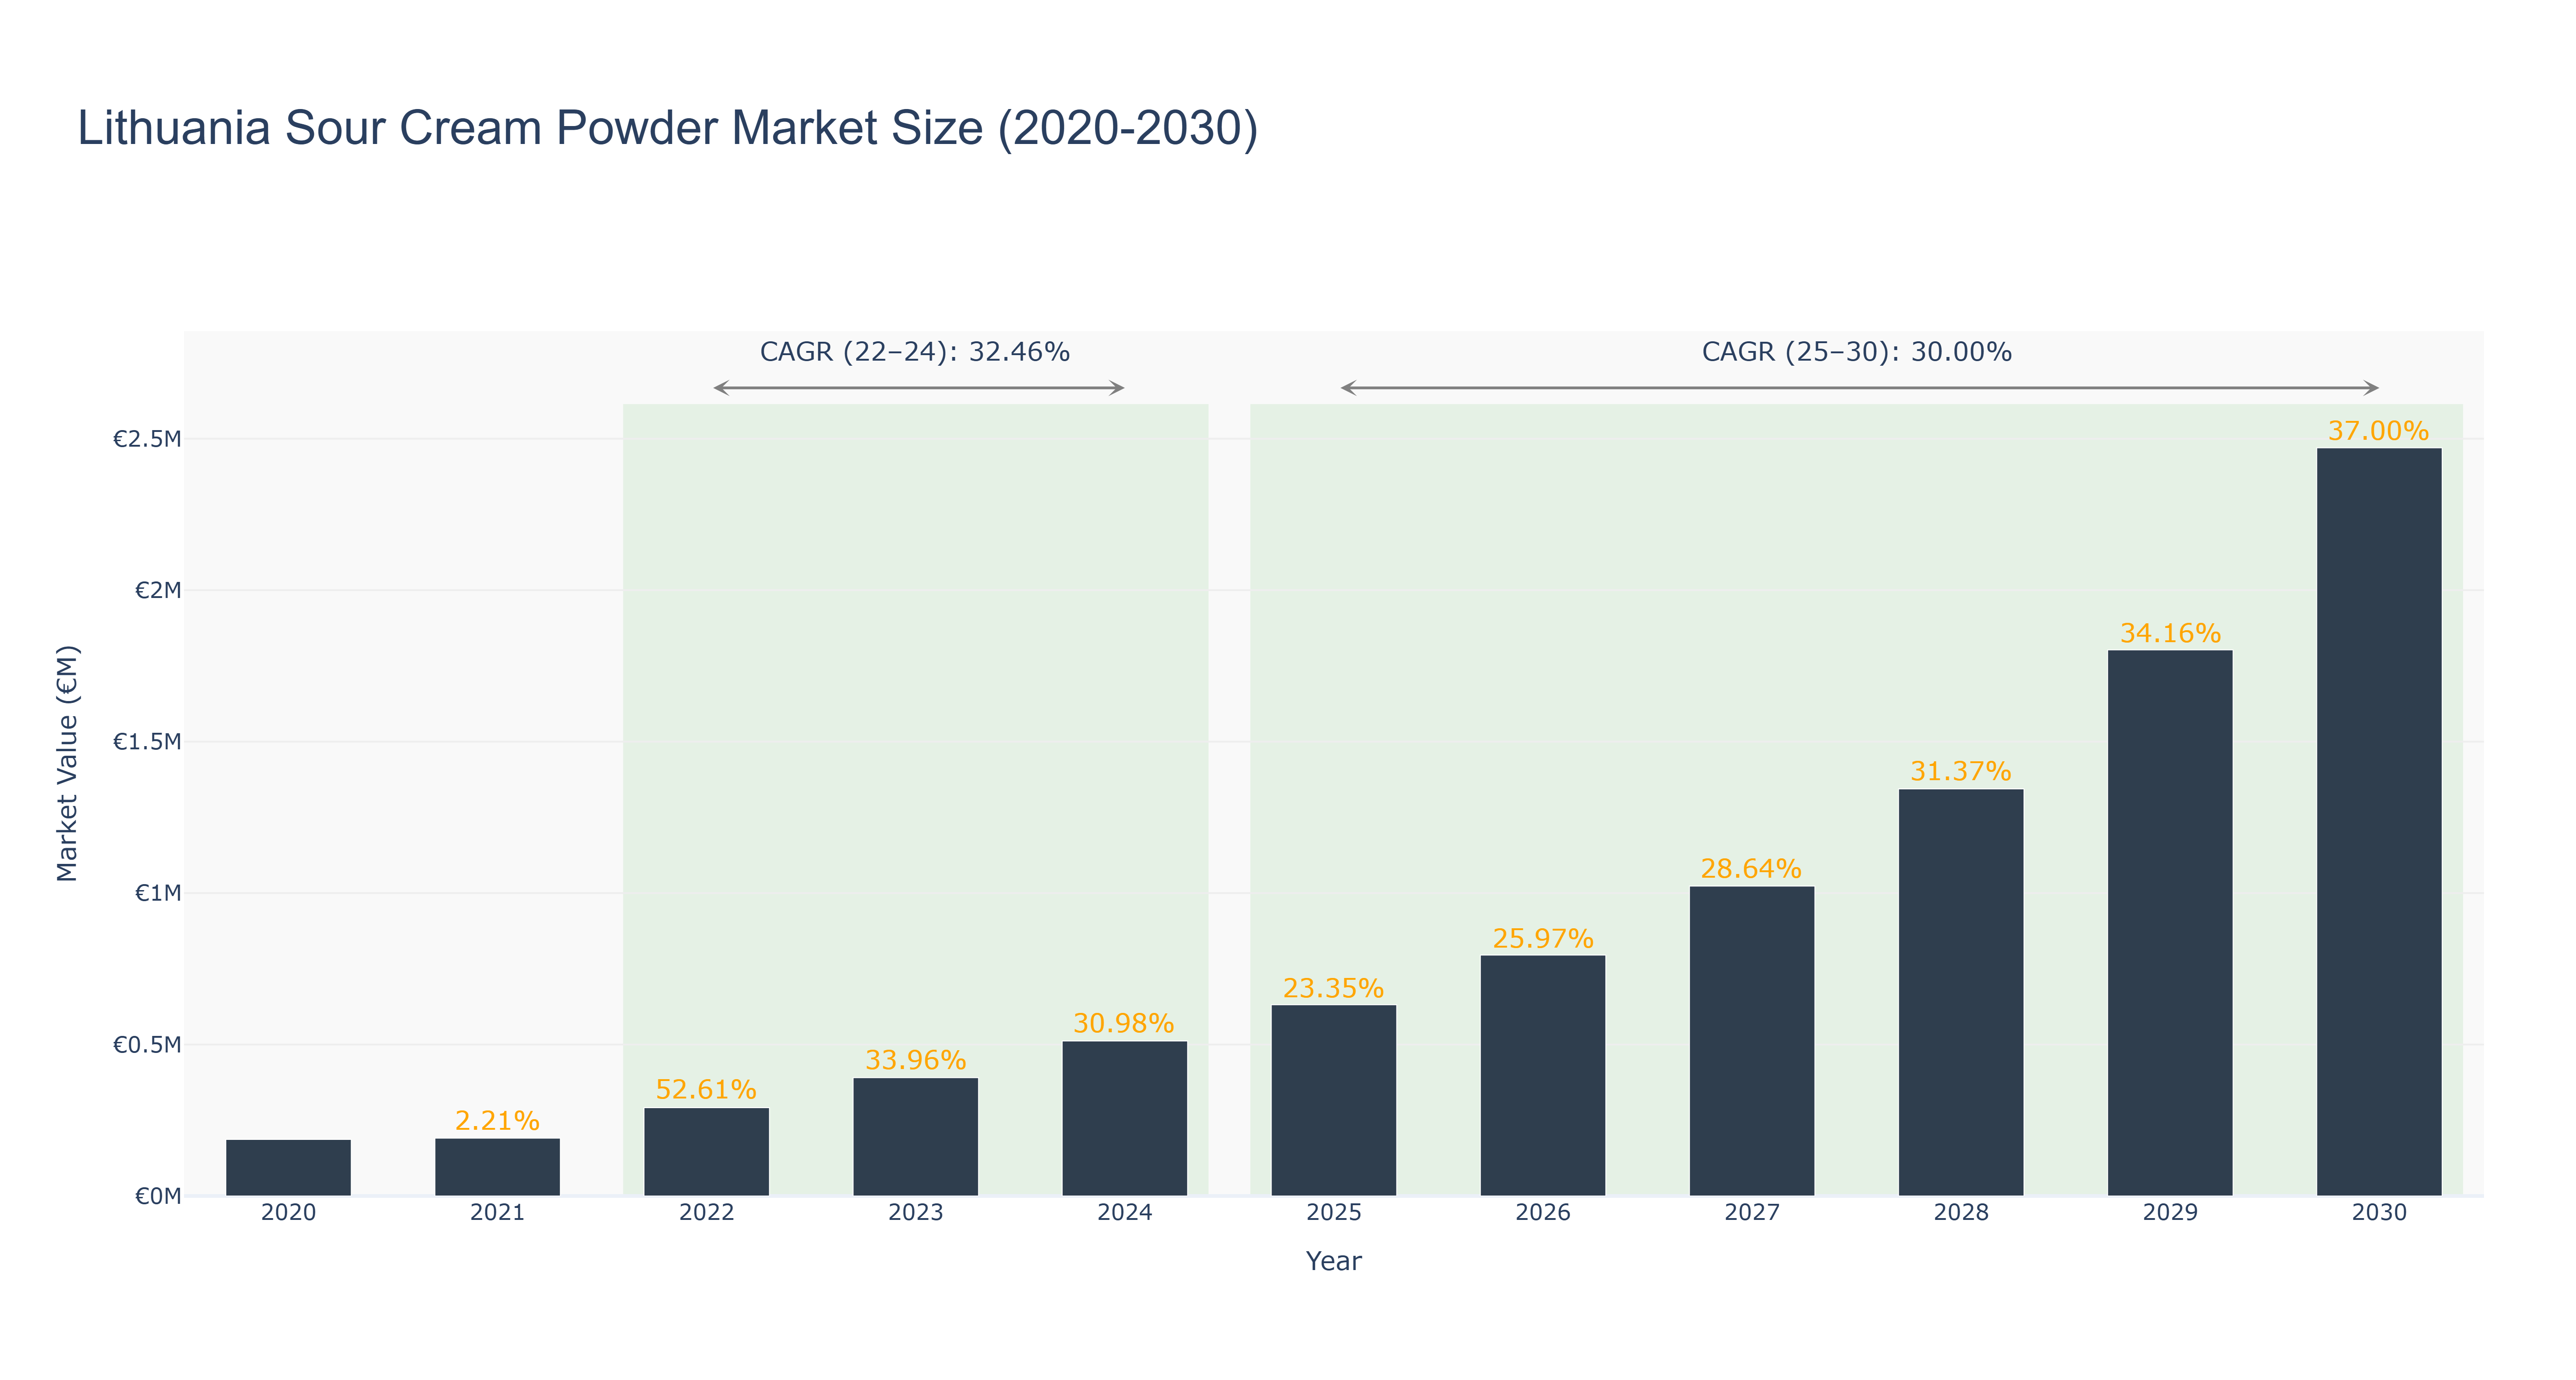
The Lithuania Sour Cream Powder Market has experienced significant growth in recent years, with the market size peaking at €511.75 thousand in 2024, reflecting a robust CAGR of 32.46% from 2022 to 2024. The actual market size saw substantial increases, particularly in 2022 and 2023, due to rising consumer demand for versatile dairy products and a growing trend towards convenience in food preparation. Looking ahead, the forecasted values from 2025 to 2030 suggest continued expansion, with an anticipated market size of €2.47 million by 2030, representing a CAGR of 30.00%. This growth is supported by ongoing innovations in product formulations and increased distribution channels. Additionally, the demand for clean-label and health-oriented food products is expected to drive future market developments, enhancing the appeal of sour cream powder as a culinary staple in both domestic and international markets.
Lithuania Sour Cream Powder Market: Production & Trade Performance (2019-2025)
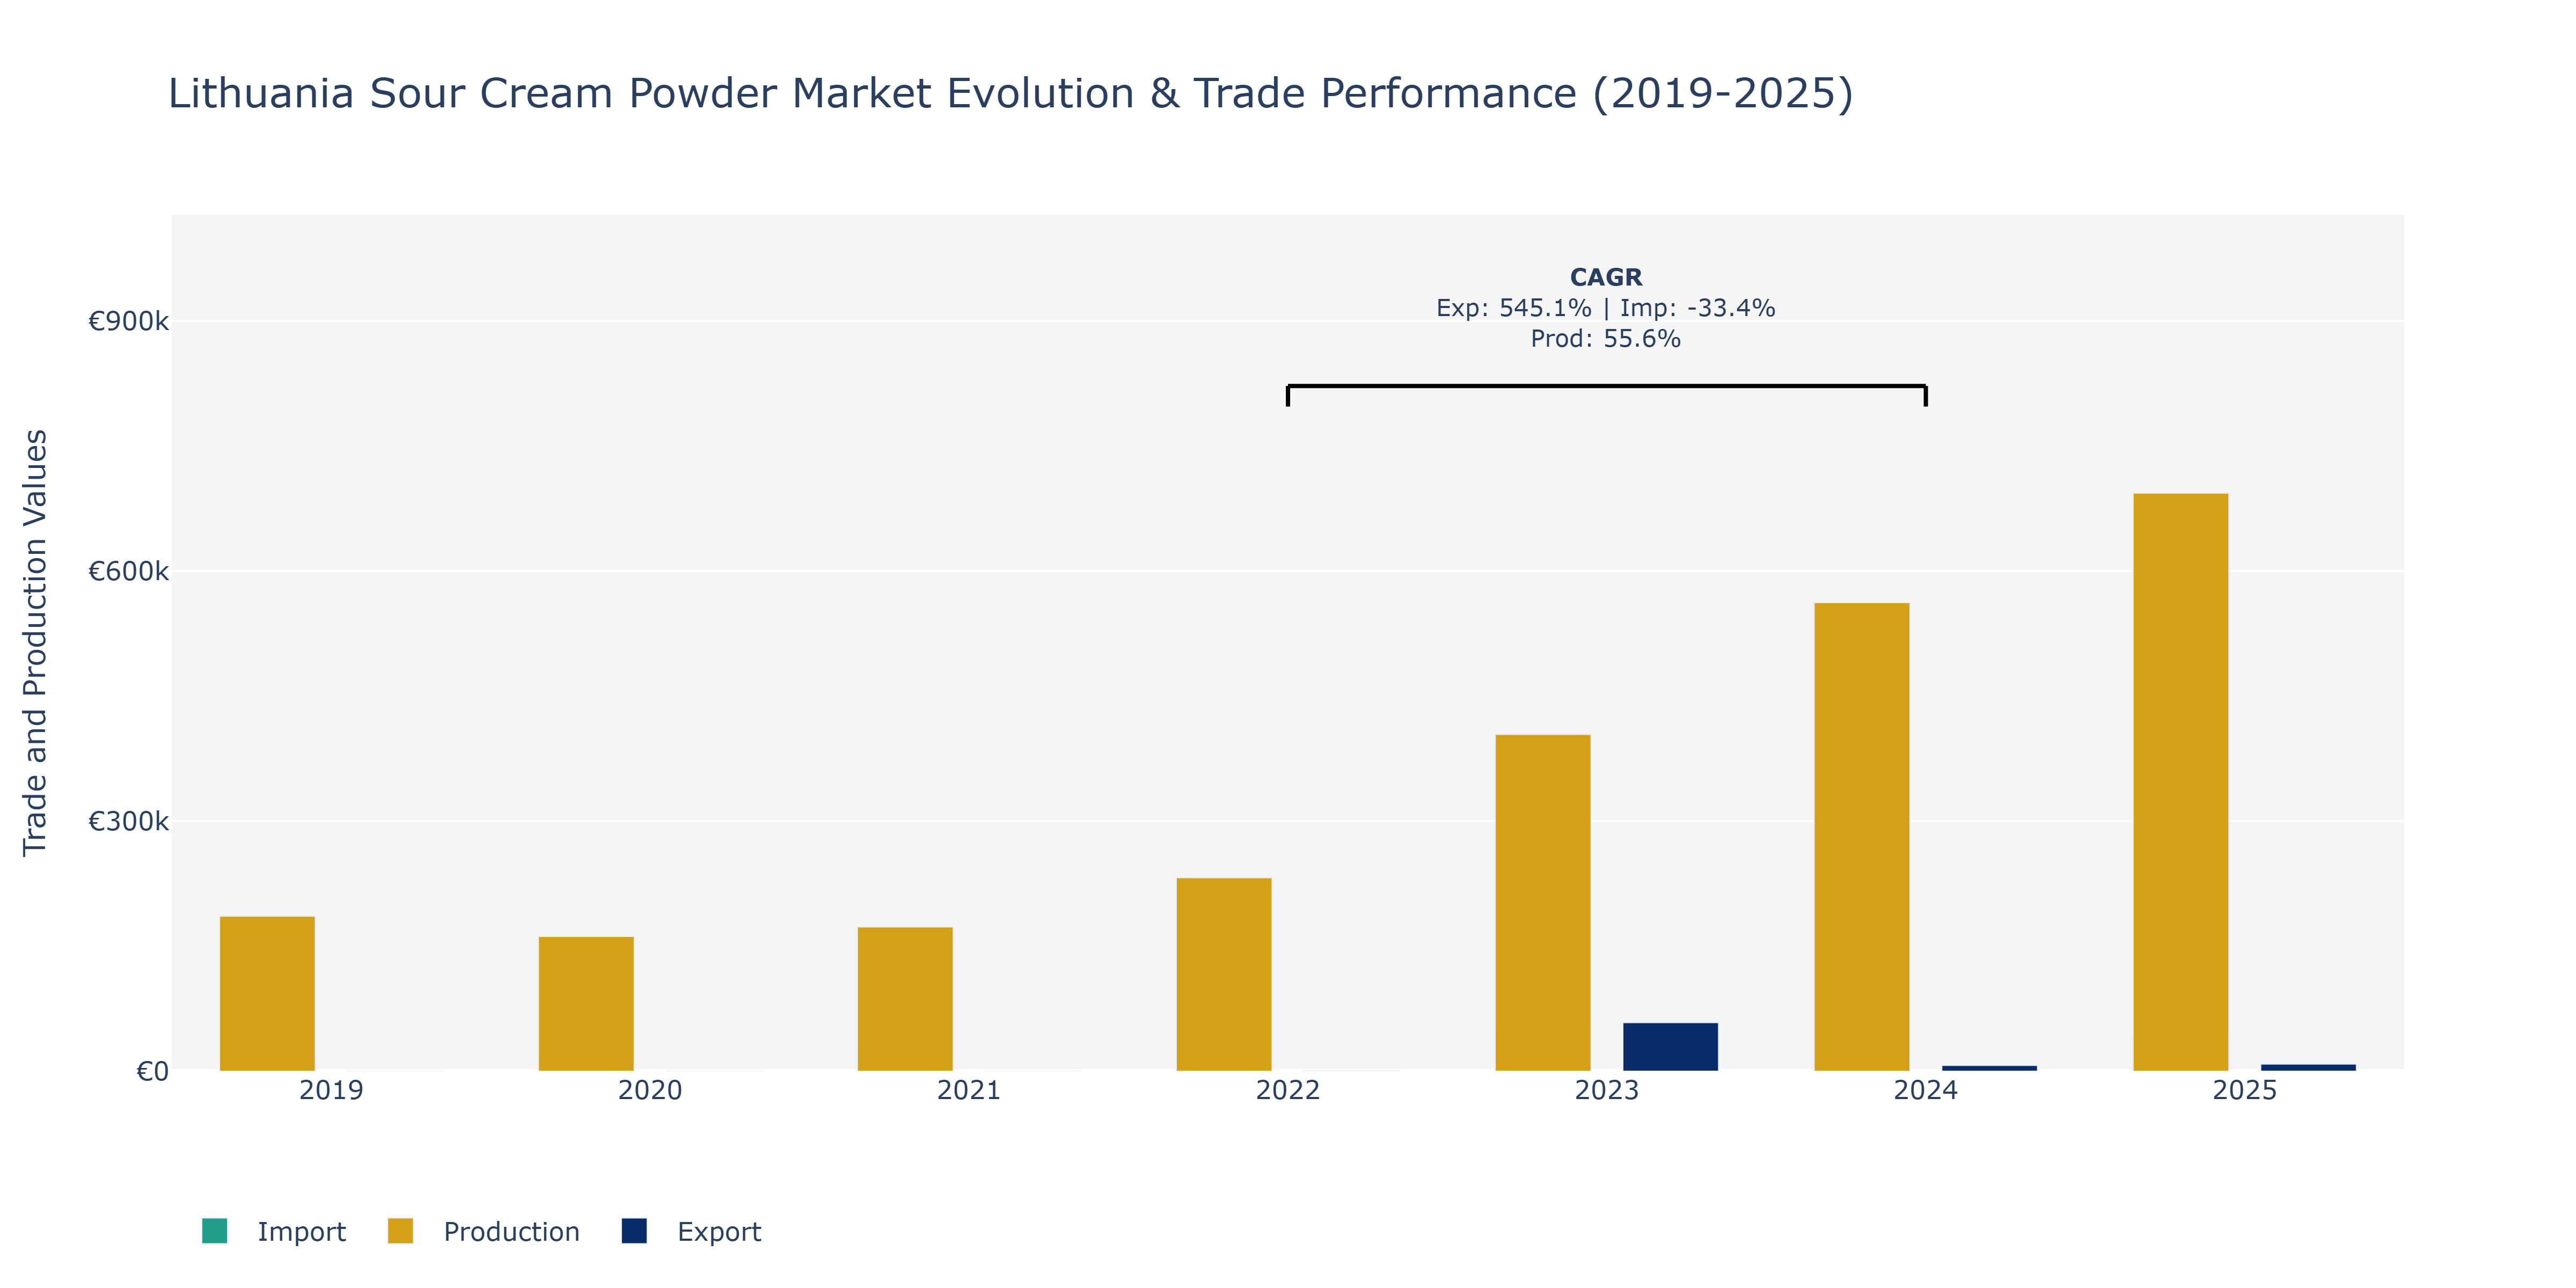
In the Lithuania Sour Cream Powder Market, exports demonstrated a fluctuating pattern, reaching a peak in 2023 at €58.26 thousand before declining in 2024 to €6.91 thousand. Imports showed a steady increase from €9.44 thousand in 2019 to €54.02 thousand in 2024, with a noticeable peak in 2023. Production consistently rose from €185.9 million in 2019 to €693.3 million in 2025, reflecting a positive trend. The surge in production can be attributed to growing consumer demand for dairy-based products globally, including sour cream powder, driven by its longer shelf life and convenience. The fluctuations in exports and imports could be influenced by international trade agreements and economic conditions affecting demand and supply dynamics in the market. The market's steady growth trajectory indicates a maturing industry with strong potential for further expansion through strategic partnerships and product innovation to meet evolving consumer preferences for dairy products.
Key Highlights of the Report:
- Lithuania Sour Cream Powder Market Outlook
- Market Size of Lithuania Sour Cream Powder Market, 2025
- Forecast of Lithuania Sour Cream Powder Market, 2032
- Historical Data and Forecast of Lithuania Sour Cream Powder Revenues & Volume for the Period 2022 - 2032F
- Lithuania Sour Cream Powder Market Trend Evolution
- Lithuania Sour Cream Powder Market Drivers and Challenges
- Lithuania Sour Cream Powder Price Trends
- Lithuania Sour Cream Powder Porter's Five Forces
- Lithuania Sour Cream Powder Industry Life Cycle
- Historical Data and Forecast of Lithuania Sour Cream Powder Market Revenues & Volume By Type for the Period 2022 - 2032F
- Historical Data and Forecast of Lithuania Sour Cream Powder Market Revenues & Volume By Instant for the Period 2022 - 2032F
- Historical Data and Forecast of Lithuania Sour Cream Powder Market Revenues & Volume By Flavored for the Period 2022 - 2032F
- Historical Data and Forecast of Lithuania Sour Cream Powder Market Revenues & Volume By Plain for the Period 2022 - 2032F
- Historical Data and Forecast of Lithuania Sour Cream Powder Market Revenues & Volume By Organic for the Period 2022 - 2032F
- Historical Data and Forecast of Lithuania Sour Cream Powder Market Revenues & Volume By Packaging for the Period 2022 - 2032F
- Historical Data and Forecast of Lithuania Sour Cream Powder Market Revenues & Volume By Pouch for the Period 2022 - 2032F
- Historical Data and Forecast of Lithuania Sour Cream Powder Market Revenues & Volume By Box for the Period 2022 - 2032F
- Historical Data and Forecast of Lithuania Sour Cream Powder Market Revenues & Volume By Can for the Period 2022 - 2032F
- Historical Data and Forecast of Lithuania Sour Cream Powder Market Revenues & Volume By Jar for the Period 2022 - 2032F
- Historical Data and Forecast of Lithuania Sour Cream Powder Market Revenues & Volume By Application for the Period 2022 - 2032F
- Historical Data and Forecast of Lithuania Sour Cream Powder Market Revenues & Volume By Culinary for the Period 2022 - 2032F
- Historical Data and Forecast of Lithuania Sour Cream Powder Market Revenues & Volume By Dairy based Products for the Period 2022 - 2032F
- Historical Data and Forecast of Lithuania Sour Cream Powder Market Revenues & Volume By Snack Foods for the Period 2022 - 2032F
- Historical Data and Forecast of Lithuania Sour Cream Powder Market Revenues & Volume By Beverage for the Period 2022 - 2032F
- Historical Data and Forecast of Lithuania Sour Cream Powder Market Revenues & Volume By Distribution Channel for the Period 2022 - 2032F
- Historical Data and Forecast of Lithuania Sour Cream Powder Market Revenues & Volume By Online for the Period 2022 - 2032F
- Historical Data and Forecast of Lithuania Sour Cream Powder Market Revenues & Volume By Retail for the Period 2022 - 2032F
- Historical Data and Forecast of Lithuania Sour Cream Powder Market Revenues & Volume By Supermarkets for the Period 2022 - 2032F
- Historical Data and Forecast of Lithuania Sour Cream Powder Market Revenues & Volume By Hypermarkets for the Period 2022 - 2032F
- Historical Data and Forecast of Lithuania Sour Cream Powder Market Revenues & Volume By End Use for the Period 2022 - 2032F
- Historical Data and Forecast of Lithuania Sour Cream Powder Market Revenues & Volume By Household for the Period 2022 - 2032F
- Historical Data and Forecast of Lithuania Sour Cream Powder Market Revenues & Volume By Foodservice for the Period 2022 - 2032F
- Historical Data and Forecast of Lithuania Sour Cream Powder Market Revenues & Volume By Restaurants for the Period 2022 - 2032F
- Historical Data and Forecast of Lithuania Sour Cream Powder Market Revenues & Volume By Catering for the Period 2022 - 2032F
- Lithuania Sour Cream Powder Import Export Trade Statistics
- Market Opportunity Assessment By Type
- Market Opportunity Assessment By Packaging
- Market Opportunity Assessment By Application
- Market Opportunity Assessment By Distribution Channel
- Market Opportunity Assessment By End Use
- Lithuania Sour Cream Powder Top Companies Market Share
- Lithuania Sour Cream Powder Competitive Benchmarking By Technical and Operational Parameters
- Lithuania Sour Cream Powder Company Profiles
- Lithuania Sour Cream Powder Key Strategic Recommendations
Frequently Asked Questions About the Market Study (FAQs):
6Wresearch actively monitors the Lithuania Sour Cream Powder Market and publishes its comprehensive annual report, highlighting emerging trends, growth drivers, revenue analysis, and forecast outlook. Our insights help businesses to make data-backed strategic decisions with ongoing market dynamics. Our analysts track relevent industries related to the Lithuania Sour Cream Powder Market, allowing our clients with actionable intelligence and reliable forecasts tailored to emerging regional needs.
Yes, we provide customisation as per your requirements. To learn more, feel free to contact us on sales@6wresearch.com
1 Executive Summary |
2 Introduction |
2.1 Key Highlights of the Report |
2.2 Report Description |
2.3 Market Scope & Segmentation |
2.4 Research Methodology |
2.5 Assumptions |
3 Lithuania Sour Cream Powder Market Overview |
3.1 Lithuania Country Macro Economic Indicators |
3.2 Lithuania Sour Cream Powder Market Revenues & Volume, 2022 & 2032F |
3.3 Lithuania Sour Cream Powder Market - Industry Life Cycle |
3.4 Lithuania Sour Cream Powder Market - Porter's Five Forces |
3.5 Lithuania Sour Cream Powder Market Revenues & Volume Share, By Type, 2022 & 2032F |
3.6 Lithuania Sour Cream Powder Market Revenues & Volume Share, By Packaging, 2022 & 2032F |
3.7 Lithuania Sour Cream Powder Market Revenues & Volume Share, By Application, 2022 & 2032F |
3.8 Lithuania Sour Cream Powder Market Revenues & Volume Share, By Distribution Channel, 2022 & 2032F |
3.9 Lithuania Sour Cream Powder Market Revenues & Volume Share, By End Use, 2022 & 2032F |
4 Lithuania Sour Cream Powder Market Dynamics |
4.1 Impact Analysis |
4.2 Market Drivers |
4.3 Market Restraints |
5 Lithuania Sour Cream Powder Market Trends |
6 Lithuania Sour Cream Powder Market, By Types |
6.1 Lithuania Sour Cream Powder Market, By Type |
6.1.1 Overview and Analysis |
6.1.2 Lithuania Sour Cream Powder Market Revenues & Volume, By Type, 2022 - 2032F |
6.1.3 Lithuania Sour Cream Powder Market Revenues & Volume, By Instant, 2022 - 2032F |
6.1.4 Lithuania Sour Cream Powder Market Revenues & Volume, By Flavored, 2022 - 2032F |
6.1.5 Lithuania Sour Cream Powder Market Revenues & Volume, By Plain, 2022 - 2032F |
6.1.6 Lithuania Sour Cream Powder Market Revenues & Volume, By Organic, 2022 - 2032F |
6.2 Lithuania Sour Cream Powder Market, By Packaging |
6.2.1 Overview and Analysis |
6.2.2 Lithuania Sour Cream Powder Market Revenues & Volume, By Pouch, 2022 - 2032F |
6.2.3 Lithuania Sour Cream Powder Market Revenues & Volume, By Box, 2022 - 2032F |
6.2.4 Lithuania Sour Cream Powder Market Revenues & Volume, By Can, 2022 - 2032F |
6.2.5 Lithuania Sour Cream Powder Market Revenues & Volume, By Jar, 2022 - 2032F |
6.2.6 Lithuania Sour Cream Powder Market Revenues & Volume, By Bulk, 2022 - 2032F |
6.3 Lithuania Sour Cream Powder Market, By Application |
6.3.1 Overview and Analysis |
6.3.2 Lithuania Sour Cream Powder Market Revenues & Volume, By Culinary, 2022 - 2032F |
6.3.3 Lithuania Sour Cream Powder Market Revenues & Volume, By Dairy based Products, 2022 - 2032F |
6.3.4 Lithuania Sour Cream Powder Market Revenues & Volume, By Snack Foods, 2022 - 2032F |
6.3.5 Lithuania Sour Cream Powder Market Revenues & Volume, By Beverage, 2022 - 2032F |
6.3.6 Lithuania Sour Cream Powder Market Revenues & Volume, By Confectionery, 2022 - 2032F |
6.4 Lithuania Sour Cream Powder Market, By Distribution Channel |
6.4.1 Overview and Analysis |
6.4.2 Lithuania Sour Cream Powder Market Revenues & Volume, By Online, 2022 - 2032F |
6.4.3 Lithuania Sour Cream Powder Market Revenues & Volume, By Retail, 2022 - 2032F |
6.4.4 Lithuania Sour Cream Powder Market Revenues & Volume, By Supermarkets, 2022 - 2032F |
6.4.5 Lithuania Sour Cream Powder Market Revenues & Volume, By Hypermarkets, 2022 - 2032F |
6.4.6 Lithuania Sour Cream Powder Market Revenues & Volume, By Convenience Stores, 2022 - 2032F |
6.5 Lithuania Sour Cream Powder Market, By End Use |
6.5.1 Overview and Analysis |
6.5.2 Lithuania Sour Cream Powder Market Revenues & Volume, By Household, 2022 - 2032F |
6.5.3 Lithuania Sour Cream Powder Market Revenues & Volume, By Foodservice, 2022 - 2032F |
6.5.4 Lithuania Sour Cream Powder Market Revenues & Volume, By Restaurants, 2022 - 2032F |
6.5.5 Lithuania Sour Cream Powder Market Revenues & Volume, By Catering, 2022 - 2032F |
7 Lithuania Sour Cream Powder Market Import-Export Trade Statistics |
7.1 Lithuania Sour Cream Powder Market Export to Major Countries |
7.2 Lithuania Sour Cream Powder Market Imports from Major Countries |
8 Lithuania Sour Cream Powder Market Key Performance Indicators |
9 Lithuania Sour Cream Powder Market - Opportunity Assessment |
9.1 Lithuania Sour Cream Powder Market Opportunity Assessment, By Type, 2022 & 2032F |
9.2 Lithuania Sour Cream Powder Market Opportunity Assessment, By Packaging, 2022 & 2032F |
9.3 Lithuania Sour Cream Powder Market Opportunity Assessment, By Application, 2022 & 2032F |
9.4 Lithuania Sour Cream Powder Market Opportunity Assessment, By Distribution Channel, 2022 & 2032F |
9.5 Lithuania Sour Cream Powder Market Opportunity Assessment, By End Use, 2022 & 2032F |
10 Lithuania Sour Cream Powder Market - Competitive Landscape |
10.1 Lithuania Sour Cream Powder Market Revenue Share, By Companies, 2025 |
10.2 Lithuania Sour Cream Powder Market Competitive Benchmarking, By Operating and Technical Parameters |
11 Company Profiles |
12 Recommendations |
13 Disclaimer |
Export potential assessment - trade Analytics for 2030
Export potential enables firms to identify high-growth global markets with greater confidence by combining advanced trade intelligence with a structured quantitative methodology. The framework analyzes emerging demand trends and country-level import patterns while integrating macroeconomic and trade datasets such as GDP and population forecasts, bilateral import–export flows, tariff structures, elasticity differentials between developed and developing economies, geographic distance, and import demand projections. Using weighted trade values from 2020–2024 as the base period to project country-to-country export potential for 2030, these inputs are operationalized through calculated drivers such as gravity model parameters, tariff impact factors, and projected GDP per-capita growth. Through an analysis of hidden potentials, demand hotspots, and market conditions that are most favorable to success, this method enables firms to focus on target countries, maximize returns, and global expansion with data, backed by accuracy.
By factoring in the projected importer demand gap that is currently unmet and could be potential opportunity, it identifies the potential for the Exporter (Country) among 190 countries, against the general trade analysis, which identifies the biggest importer or exporter.
To discover high-growth global markets and optimize your business strategy:
Click Here
Pricing
- Single User License$ 1,995
- Department License$ 2,400
- Site License$ 3,120
- Global License$ 3,795

Search
Thought Leadership and Analyst Meet


Our Clients
Latest Reports
- China Electric Appliance Rental Market (2026-2032) | Trends, Revenue, Growth, Challenges, Size, Value, Outlook, Pricing, Strategy, Insights, Restraints, segmentation, Companies, Investment Opportunities, Analysis, Demand, Drivers, Competition, Forecast, Share
- Chile Electric Appliance Rental Market (2026-2032) | Outlook, Competition, Drivers, Strategy, Revenue, Analysis, Value, Pricing, Restraints, Size, Demand, Share, Growth, Forecast, Challenges, Insights, Investment Opportunities, Companies, Trends, segmentation
- Cambodia Electric Appliance Rental Market (2026-2032) | Companies, Analysis, Restraints, Pricing, Insights, Challenges, Outlook, Strategy, Forecast, Trends, Competition, Value, Revenue, Investment Opportunities, segmentation, Drivers, Size, Demand, Growth, Share
- Brazil Electric Appliance Rental Market (2026-2032) | Revenue, Strategy, Forecast, Companies, segmentation, Competition, Size, Investment Opportunities, Pricing, Restraints, Outlook, Challenges, Analysis, Drivers, Value, Demand, Insights, Trends, Growth, Share
- Bangladesh Electric Appliance Rental Market (2026-2032) | Drivers, Forecast, Investment Opportunities, Strategy, Insights, Demand, Challenges, Outlook, Trends, Competition, Value, Revenue, Size, Pricing, Analysis, Companies, Restraints, segmentation, Share, Growth
- Bahrain Electric Appliance Rental Market (2026-2032) | Outlook, Size, Competition, Restraints, Drivers, Value, Trends, Investment Opportunities, Insights, Forecast, Revenue, Strategy, Growth, Share, Demand, Analysis, Challenges, Companies, segmentation, Pricing
- Azerbaijan Electric Appliance Rental Market (2026-2032) | Trends, Investment Opportunities, Restraints, Insights, Strategy, Competition, Value, Growth, Demand, Drivers, Analysis, Forecast, Size, Share, Outlook, segmentation, Pricing, Challenges, Revenue, Companies
- Australia Electric Appliance Rental Market (2026-2032) | Challenges, Restraints, Forecast, Demand, Size, Competition, Pricing, Investment Opportunities, Revenue, Trends, Drivers, Growth, Outlook, Analysis, Strategy, Value, segmentation, Insights, Companies, Share
- Argentina Electric Appliance Rental Market (2026-2032) | Growth, Trends, Insights, Outlook, Forecast, Size, Drivers, Analysis, Restraints, Challenges, Share, Revenue, Investment Opportunities, Strategy, Demand, Value, Companies, segmentation, Competition, Pricing
- Algeria Electric Appliance Rental Market (2026-2032) | Share, Size, Value, Strategy, Competition, Outlook, Challenges, Companies, Trends, Pricing, Insights, Forecast, Investment Opportunities, Revenue, Growth, Restraints, segmentation, Analysis, Demand, Drivers
Industry Events and Analyst Meet

HIMTEX 2026

India Refining Summit 2026

India EV Show 2026

EV tech India Expo 2026

Auto Tech Asia 2026
Whitepaper
- Middle East & Africa Commercial Security Market Click here to view more.
- Middle East & Africa Fire Safety Systems & Equipment Market Click here to view more.
- GCC Drone Market Click here to view more.
- Middle East Lighting Fixture Market Click here to view more.
- GCC Physical & Perimeter Security Market Click here to view more.
6WResearch In News
- Doha a strategic location for EV manufacturing hub: IPA Qatar
- Demand for luxury TVs surging in the GCC, says Samsung
- Empowering Growth: The Thriving Journey of Bangladesh’s Cable Industry
- Demand for luxury TVs surging in the GCC, says Samsung
- Video call with a traditional healer? Once unthinkable, it’s now common in South Africa
- Intelligent Buildings To Smooth GCC’s Path To Net Zero