Lithuania Spectacle Lens Market (2026-2032) | Trends, Size & Revenue, Industry, Growth, Companies, Forecast, Competitive Landscape, Outlook, Analysis, Segmentation, Share, Value
Market Forecast By Type (Single Vision, Bifocal, Trifocal, Progressive), By Coating Type (Anti-reflective Coating, Scratch-Resistant Coating, Anti-Fog Coating, UV Protection, Other), By Usage (Prescription Glass, OTC Reading Glass) And Competitive Landscape
| Product Code: ETC8051892 | Publication Date: Sep 2024 | Updated Date: Apr 2026 | Product Type: Market Research Report | |
| Publisher: 6Wresearch | Author: Summon Dutta | No. of Pages: 75 | No. of Figures: 35 | No. of Tables: 20 |
Lithuania Spectacle Lens Market Size (2020-2030)
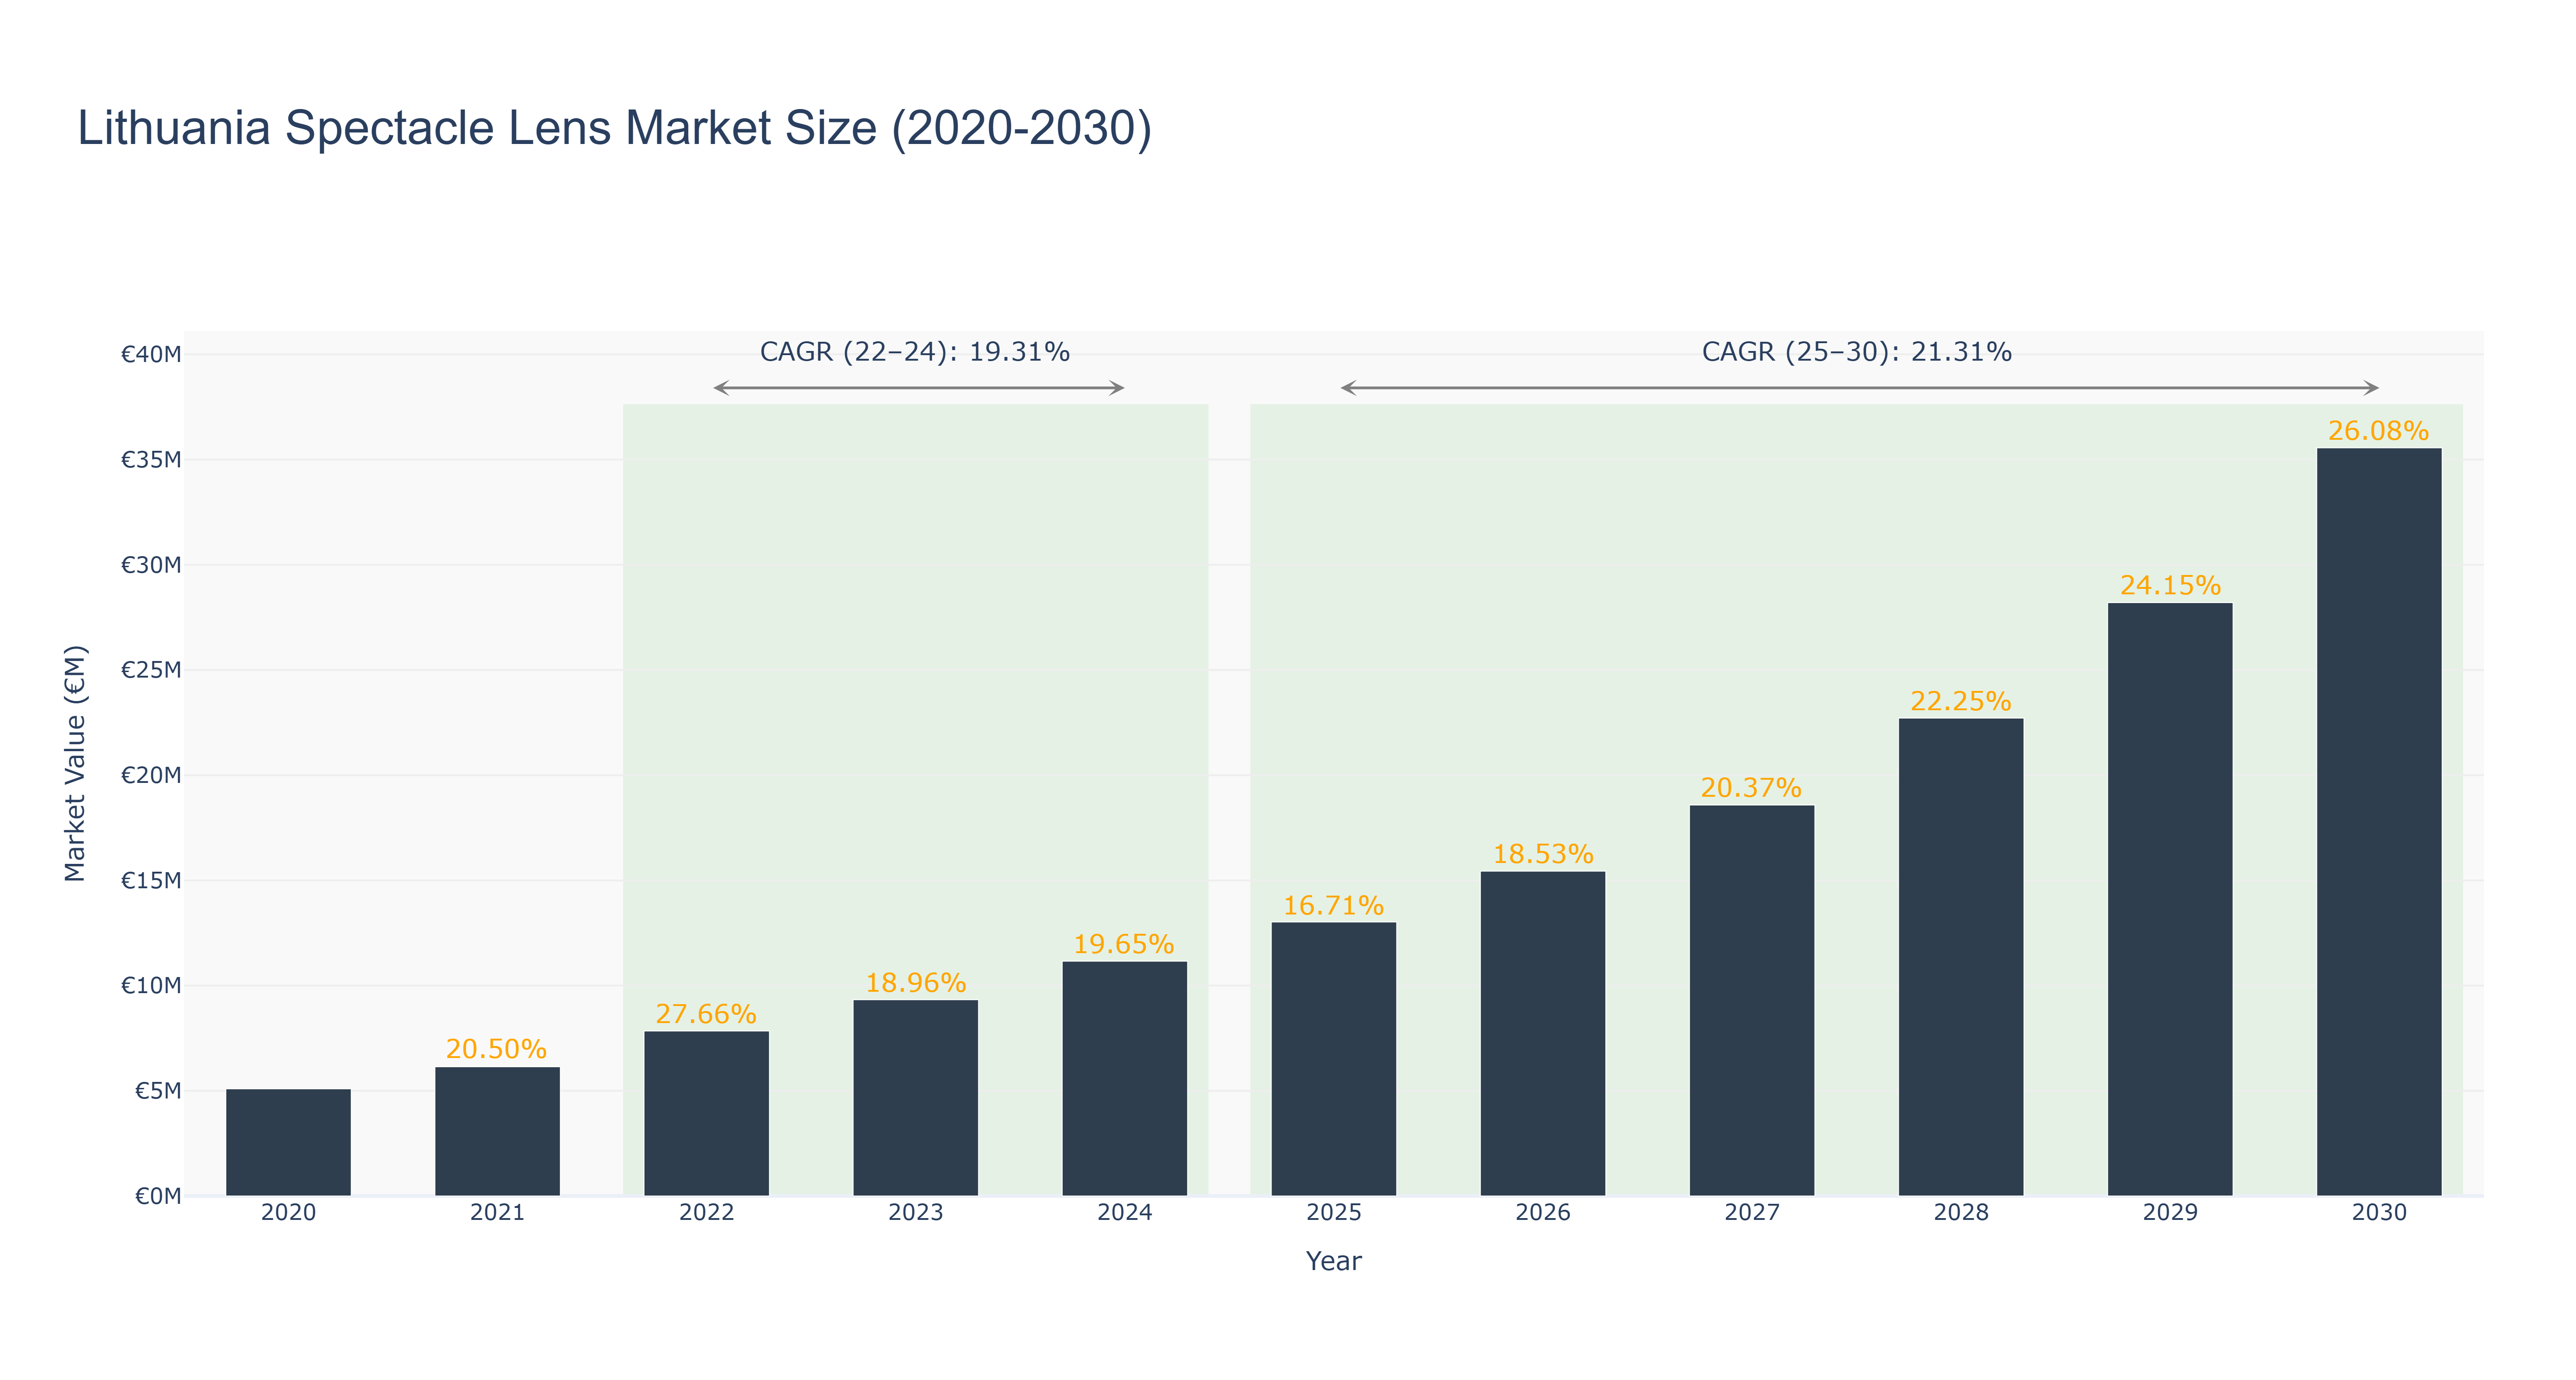
The Lithuania Spectacle Lens Market has demonstrated robust growth from 2020 to 2024, with the market size increasing from €5.10 million in 2020 to €11.16 million in 2024, reflecting a compound annual growth rate (CAGR) of 19.31% during this actual period. The peak market size was achieved in 2023 at €9.33 million, driven by factors such as an aging population, increasing screen time, and rising awareness of eye health. Looking ahead to the forecasted period from 2025 to 2030, the market is projected to expand further, reaching €35.56 million by 2030, with a CAGR of 21.31%. This anticipated growth will be fueled by advancements in lens technology, an expanding middle class, and increased accessibility to eye care services. Overall, the Lithuania Spectacle Lens Market is poised for significant development as consumer demand continues to rise.
Lithuania Spectacle Lens Market: Production & Trade Performance (2019-2025)
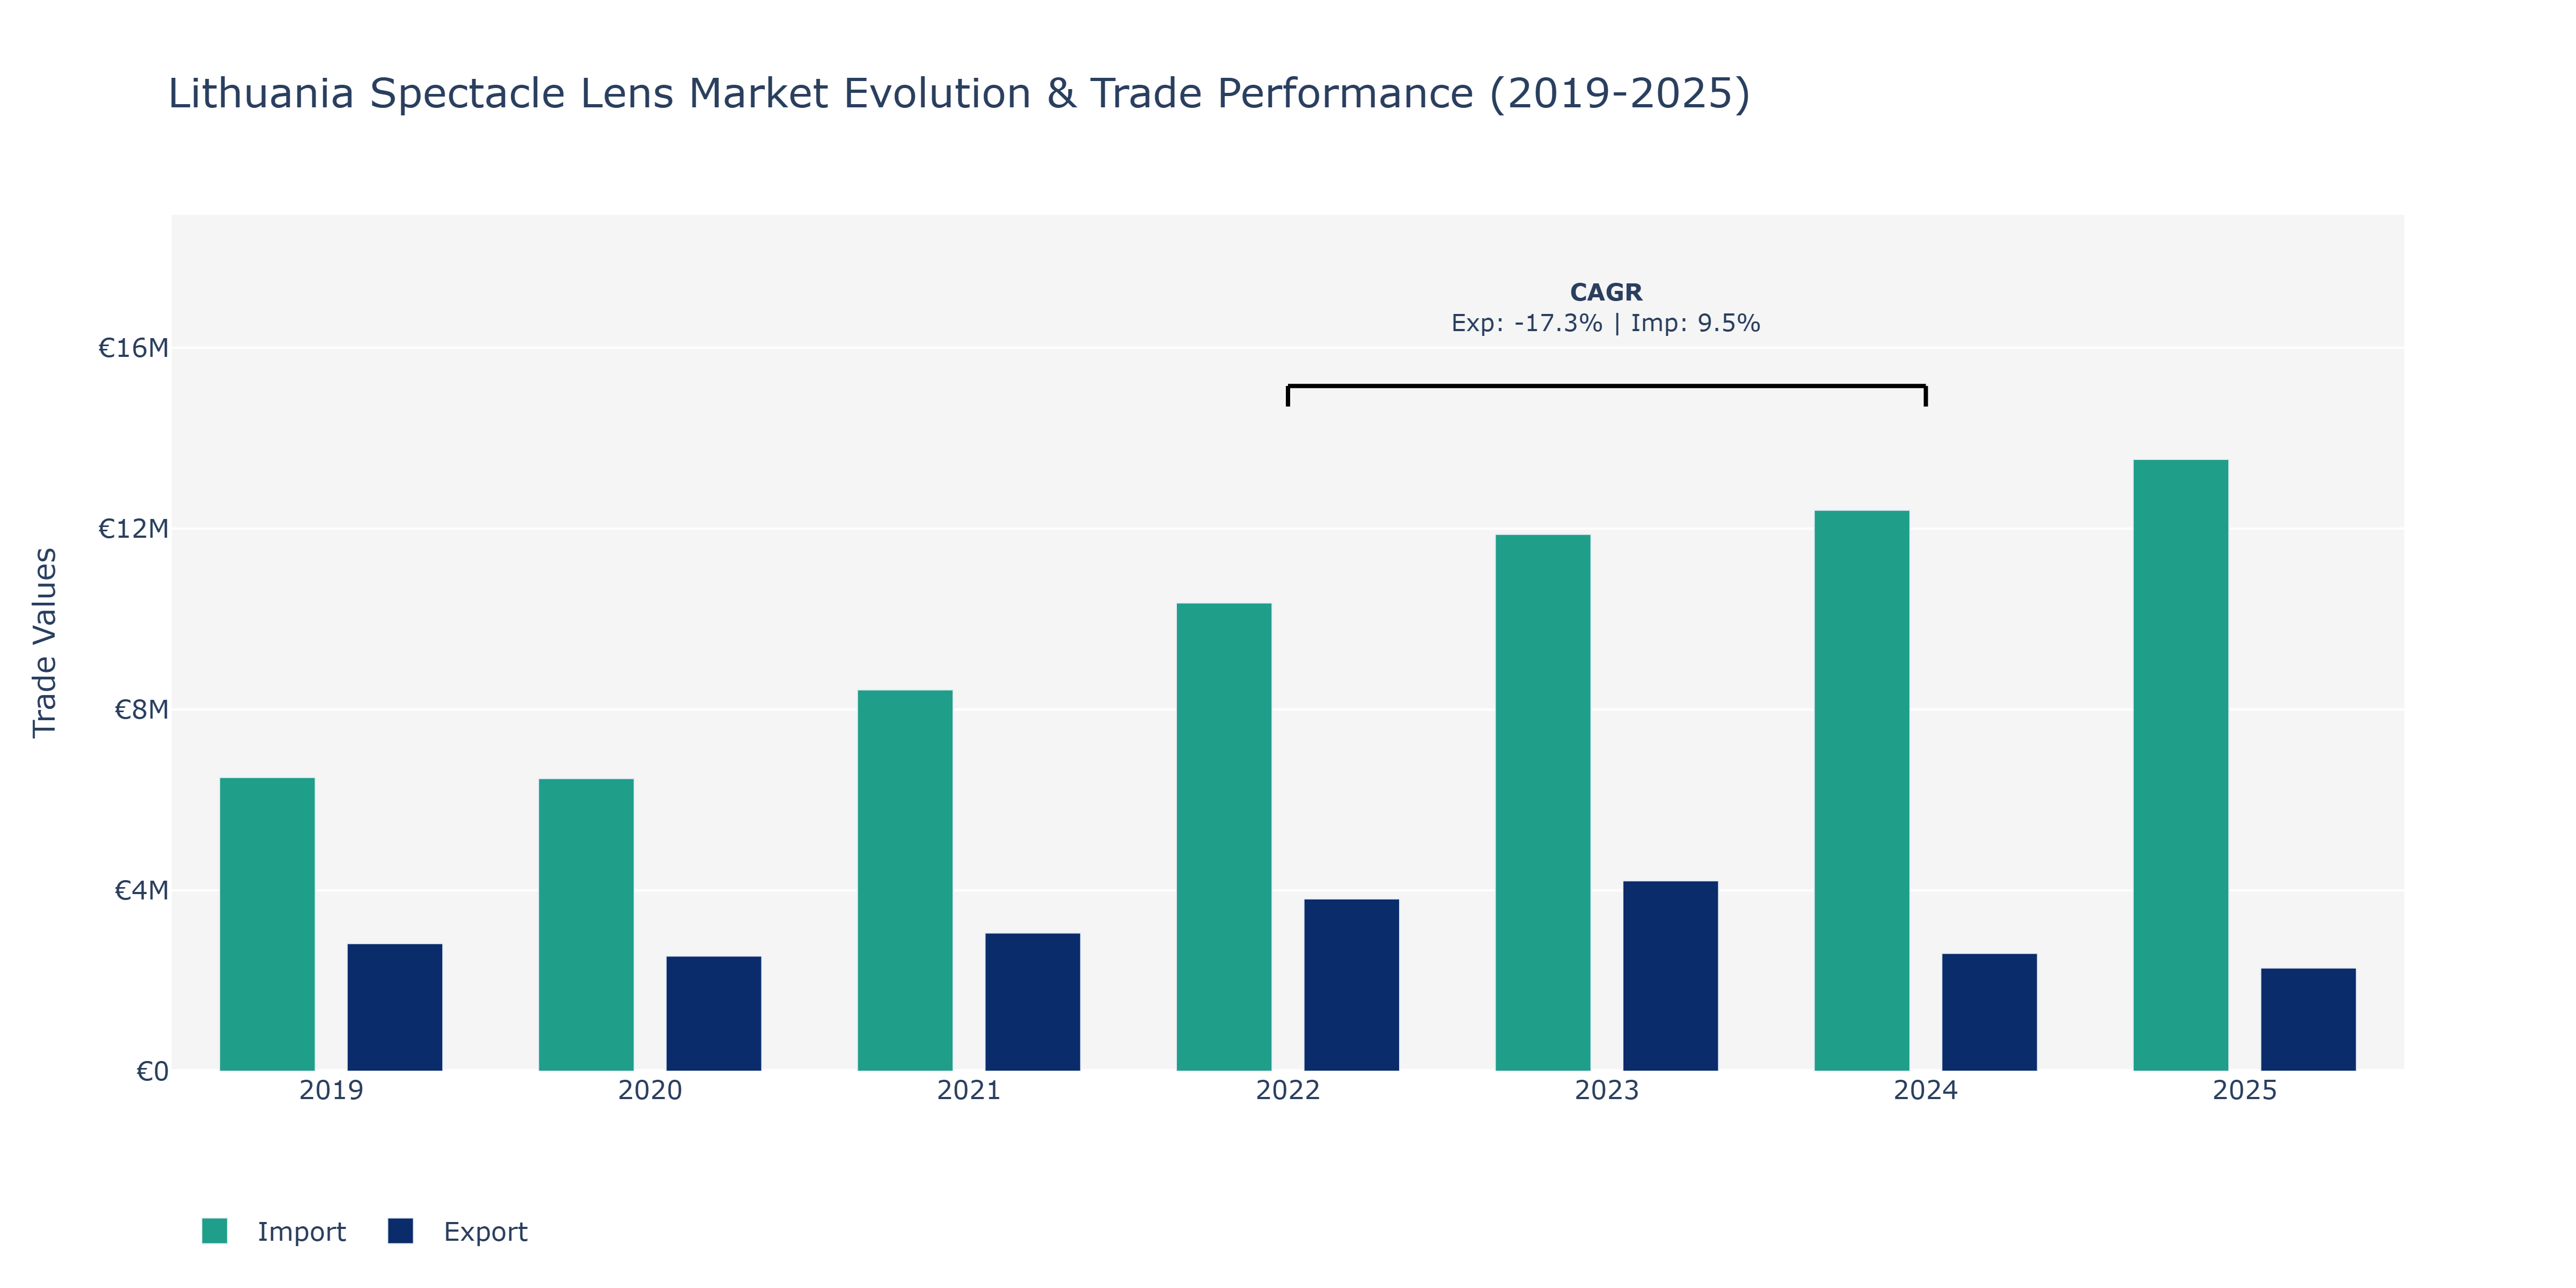
In the Lithuania Spectacle Lens Market, exports experienced fluctuations over the years, reaching a peak in 2023 at €4.21 million before decreasing to €2.61 million in 2024 and further dropping to €2.28 million in 2025. On the other hand, imports consistently increased from €6.5 million in 2019 to peak at €13.53 million in 2025. The growth in imports can be attributed to increasing demand for specialized lenses and advancements in lens technologies, driving the need for foreign suppliers. The fluctuations in exports could be influenced by market competition, changes in consumer preferences, or global economic conditions affecting demand. The contrasting trends between exports and imports highlight the evolving landscape of the spectacle lens market in Lithuania, emphasizing the importance of strategic market positioning and product innovation to maintain competitiveness amidst changing market dynamics.
Key Highlights of the Report:
- Lithuania Spectacle Lens Market Outlook
- Market Size of Lithuania Spectacle Lens Market, 2025
- Forecast of Lithuania Spectacle Lens Market, 2032
- Historical Data and Forecast of Lithuania Spectacle Lens Revenues & Volume for the Period 2022 - 2032
- Lithuania Spectacle Lens Market Trend Evolution
- Lithuania Spectacle Lens Market Drivers and Challenges
- Lithuania Spectacle Lens Price Trends
- Lithuania Spectacle Lens Porter's Five Forces
- Lithuania Spectacle Lens Industry Life Cycle
- Historical Data and Forecast of Lithuania Spectacle Lens Market Revenues & Volume By Type for the Period 2022 - 2032
- Historical Data and Forecast of Lithuania Spectacle Lens Market Revenues & Volume By Single Vision for the Period 2022 - 2032
- Historical Data and Forecast of Lithuania Spectacle Lens Market Revenues & Volume By Bifocal for the Period 2022 - 2032
- Historical Data and Forecast of Lithuania Spectacle Lens Market Revenues & Volume By Trifocal for the Period 2022 - 2032
- Historical Data and Forecast of Lithuania Spectacle Lens Market Revenues & Volume By Progressive for the Period 2022 - 2032
- Historical Data and Forecast of Lithuania Spectacle Lens Market Revenues & Volume By Coating Type for the Period 2022 - 2032
- Historical Data and Forecast of Lithuania Spectacle Lens Market Revenues & Volume By Anti-reflective Coating for the Period 2022 - 2032
- Historical Data and Forecast of Lithuania Spectacle Lens Market Revenues & Volume By Scratch-Resistant Coating for the Period 2022 - 2032
- Historical Data and Forecast of Lithuania Spectacle Lens Market Revenues & Volume By Anti-Fog Coating for the Period 2022 - 2032
- Historical Data and Forecast of Lithuania Spectacle Lens Market Revenues & Volume By UV Protection for the Period 2022 - 2032
- Historical Data and Forecast of Lithuania Spectacle Lens Market Revenues & Volume By Other for the Period 2022 - 2032
- Historical Data and Forecast of Lithuania Spectacle Lens Market Revenues & Volume By Usage for the Period 2022 - 2032
- Historical Data and Forecast of Lithuania Spectacle Lens Market Revenues & Volume By Prescription Glass for the Period 2022 - 2032
- Historical Data and Forecast of Lithuania Spectacle Lens Market Revenues & Volume By OTC Reading Glass for the Period 2022 - 2032
- Lithuania Spectacle Lens Import Export Trade Statistics
- Market Opportunity Assessment By Type
- Market Opportunity Assessment By Coating Type
- Market Opportunity Assessment By Usage
- Lithuania Spectacle Lens Top Companies Market Share
- Lithuania Spectacle Lens Competitive Benchmarking By Technical and Operational Parameters
- Lithuania Spectacle Lens Company Profiles
- Lithuania Spectacle Lens Key Strategic Recommendations
Frequently Asked Questions About the Market Study (FAQs):
6Wresearch actively monitors the Lithuania Spectacle Lens Market and publishes its comprehensive annual report, highlighting emerging trends, growth drivers, revenue analysis, and forecast outlook. Our insights help businesses to make data-backed strategic decisions with ongoing market dynamics. Our analysts track relevent industries related to the Lithuania Spectacle Lens Market, allowing our clients with actionable intelligence and reliable forecasts tailored to emerging regional needs.
Yes, we provide customisation as per your requirements. To learn more, feel free to contact us on sales@6wresearch.com
1 Executive Summary |
2 Introduction |
2.1 Key Highlights of the Report |
2.2 Report Description |
2.3 Market Scope & Segmentation |
2.4 Research Methodology |
2.5 Assumptions |
3 Lithuania Spectacle Lens Market Overview |
3.1 Lithuania Country Macro Economic Indicators |
3.2 Lithuania Spectacle Lens Market Revenues & Volume, 2022 & 2032F |
3.3 Lithuania Spectacle Lens Market - Industry Life Cycle |
3.4 Lithuania Spectacle Lens Market - Porter's Five Forces |
3.5 Lithuania Spectacle Lens Market Revenues & Volume Share, By Type, 2022 & 2032F |
3.6 Lithuania Spectacle Lens Market Revenues & Volume Share, By Coating Type, 2022 & 2032F |
3.7 Lithuania Spectacle Lens Market Revenues & Volume Share, By Usage, 2022 & 2032F |
4 Lithuania Spectacle Lens Market Dynamics |
4.1 Impact Analysis |
4.2 Market Drivers |
4.3 Market Restraints |
5 Lithuania Spectacle Lens Market Trends |
6 Lithuania Spectacle Lens Market, By Types |
6.1 Lithuania Spectacle Lens Market, By Type |
6.1.1 Overview and Analysis |
6.1.2 Lithuania Spectacle Lens Market Revenues & Volume, By Type, 2022 - 2032F |
6.1.3 Lithuania Spectacle Lens Market Revenues & Volume, By Single Vision, 2022 - 2032F |
6.1.4 Lithuania Spectacle Lens Market Revenues & Volume, By Bifocal, 2022 - 2032F |
6.1.5 Lithuania Spectacle Lens Market Revenues & Volume, By Trifocal, 2022 - 2032F |
6.1.6 Lithuania Spectacle Lens Market Revenues & Volume, By Progressive, 2022 - 2032F |
6.2 Lithuania Spectacle Lens Market, By Coating Type |
6.2.1 Overview and Analysis |
6.2.2 Lithuania Spectacle Lens Market Revenues & Volume, By Anti-reflective Coating, 2022 - 2032F |
6.2.3 Lithuania Spectacle Lens Market Revenues & Volume, By Scratch-Resistant Coating, 2022 - 2032F |
6.2.4 Lithuania Spectacle Lens Market Revenues & Volume, By Anti-Fog Coating, 2022 - 2032F |
6.2.5 Lithuania Spectacle Lens Market Revenues & Volume, By UV Protection, 2022 - 2032F |
6.2.6 Lithuania Spectacle Lens Market Revenues & Volume, By Other, 2022 - 2032F |
6.3 Lithuania Spectacle Lens Market, By Usage |
6.3.1 Overview and Analysis |
6.3.2 Lithuania Spectacle Lens Market Revenues & Volume, By Prescription Glass, 2022 - 2032F |
6.3.3 Lithuania Spectacle Lens Market Revenues & Volume, By OTC Reading Glass, 2022 - 2032F |
7 Lithuania Spectacle Lens Market Import-Export Trade Statistics |
7.1 Lithuania Spectacle Lens Market Export to Major Countries |
7.2 Lithuania Spectacle Lens Market Imports from Major Countries |
8 Lithuania Spectacle Lens Market Key Performance Indicators |
9 Lithuania Spectacle Lens Market - Opportunity Assessment |
9.1 Lithuania Spectacle Lens Market Opportunity Assessment, By Type, 2022 & 2032F |
9.2 Lithuania Spectacle Lens Market Opportunity Assessment, By Coating Type, 2022 & 2032F |
9.3 Lithuania Spectacle Lens Market Opportunity Assessment, By Usage, 2022 & 2032F |
10 Lithuania Spectacle Lens Market - Competitive Landscape |
10.1 Lithuania Spectacle Lens Market Revenue Share, By Companies, 2025 |
10.2 Lithuania Spectacle Lens Market Competitive Benchmarking, By Operating and Technical Parameters |
11 Company Profiles |
12 Recommendations |
13 Disclaimer |
Global Go To Market Strategy - 2030
Export potential enables firms to identify high-growth global markets with greater confidence by combining advanced trade intelligence with a structured quantitative methodology. The framework analyzes emerging demand trends and country-level import patterns while integrating macroeconomic and trade datasets such as GDP and population forecasts, bilateral import–export flows, tariff structures, elasticity differentials between developed and developing economies, geographic distance, and import demand projections. Using weighted trade values from 2020–2024 as the base period to project country-to-country export potential for 2030, these inputs are operationalized through calculated drivers such as gravity model parameters, tariff impact factors, and projected GDP per-capita growth. Through an analysis of hidden potentials, demand hotspots, and market conditions that are most favorable to success, this method enables firms to focus on target countries, maximize returns, and global expansion with data, backed by accuracy.
By factoring in the projected importer demand gap that is currently unmet and could be potential opportunity, it identifies the potential for the Exporter (Country) among 190 countries, against the general trade analysis, which identifies the biggest importer or exporter.
To discover high-growth global markets and optimize your business strategy:
Click Here
Pricing
- Single User License$ 1,995
- Department License$ 2,400
- Site License$ 3,120
- Global License$ 3,795

Leadership Perspectives from Industry Events
Search
Thought Leadership and Analyst Meet


Our Clients
6WResearch In News
- India Air Conditioner Market Set for Strong Rebound in 2026 After Weather-Led Correction and GST-Driven Recovery: 6Wresearch
- ADAS in India: How Automatic Emergency Braking, Blind Spot Detection & Driver Monitoring are Transforming Road Safety
- Doha a strategic location for EV manufacturing hub: IPA Qatar
- Demand for luxury TVs surging in the GCC, says Samsung
- Empowering Growth: The Thriving Journey of Bangladesh’s Cable Industry
- Demand for luxury TVs surging in the GCC, says Samsung
Latest Reports
- Poland Fire Protection Systems Market (2026-2032)
- Cape Verde Portable Hand-Thrown Extinguisher Market (2026-2032)
- Canada Portable Hand-Thrown Extinguisher Market (2026-2032)
- Cameroon Portable Hand-Thrown Extinguisher Market (2026-2032)
- Burundi Portable Hand-Thrown Extinguisher Market (2026-2032)
- Burkina Faso Portable Hand-Thrown Extinguisher Market (2026-2032)
- Bulgaria Portable Hand-Thrown Extinguisher Market (2026-2032)
- Brunei Portable Hand-Thrown Extinguisher Market (2026-2032)
- Botswana Portable Hand-Thrown Extinguisher Market (2026-2032)
- Bosnia and Herzegovina Portable Hand-Thrown Extinguisher Market (2026-2032)
Industry Events and Analyst Meet

HIMTEX 2026

India Refining Summit 2026

India EV Show 2026

EV tech India Expo 2026

Auto Tech Asia 2026
Whitepaper
- Middle East & Africa Commercial Security Market Click here to view more.
- Middle East & Africa Fire Safety Systems & Equipment Market Click here to view more.
- GCC Drone Market Click here to view more.
- Middle East Lighting Fixture Market Click here to view more.
- GCC Physical & Perimeter Security Market Click here to view more.