Lithuania Temporary Power Market (2026-2032) | Value, Growth, Industry, Share, Revenue, Companies, Forecast, Segmentation, Size, Trends, Outlook & Analysis
Market Forecast By Generator Rating (Less than 80 kW, 81-280kW, 281-600 kW), By End Use (Events, Utilities, Oil & Gas, Construction, Mining, Manufacturing, Shipping), By Fuel Type (Diesel, Gas, Others Duel Fuel & HFO) And Competitive Landscape
| Product Code: ETC5784077 | Publication Date: Nov 2023 | Updated Date: Mar 2026 | Product Type: Market Research Report | |
| Publisher: 6Wresearch | Author: Ravi Bhandari | No. of Pages: 60 | No. of Figures: 30 | No. of Tables: 5 |
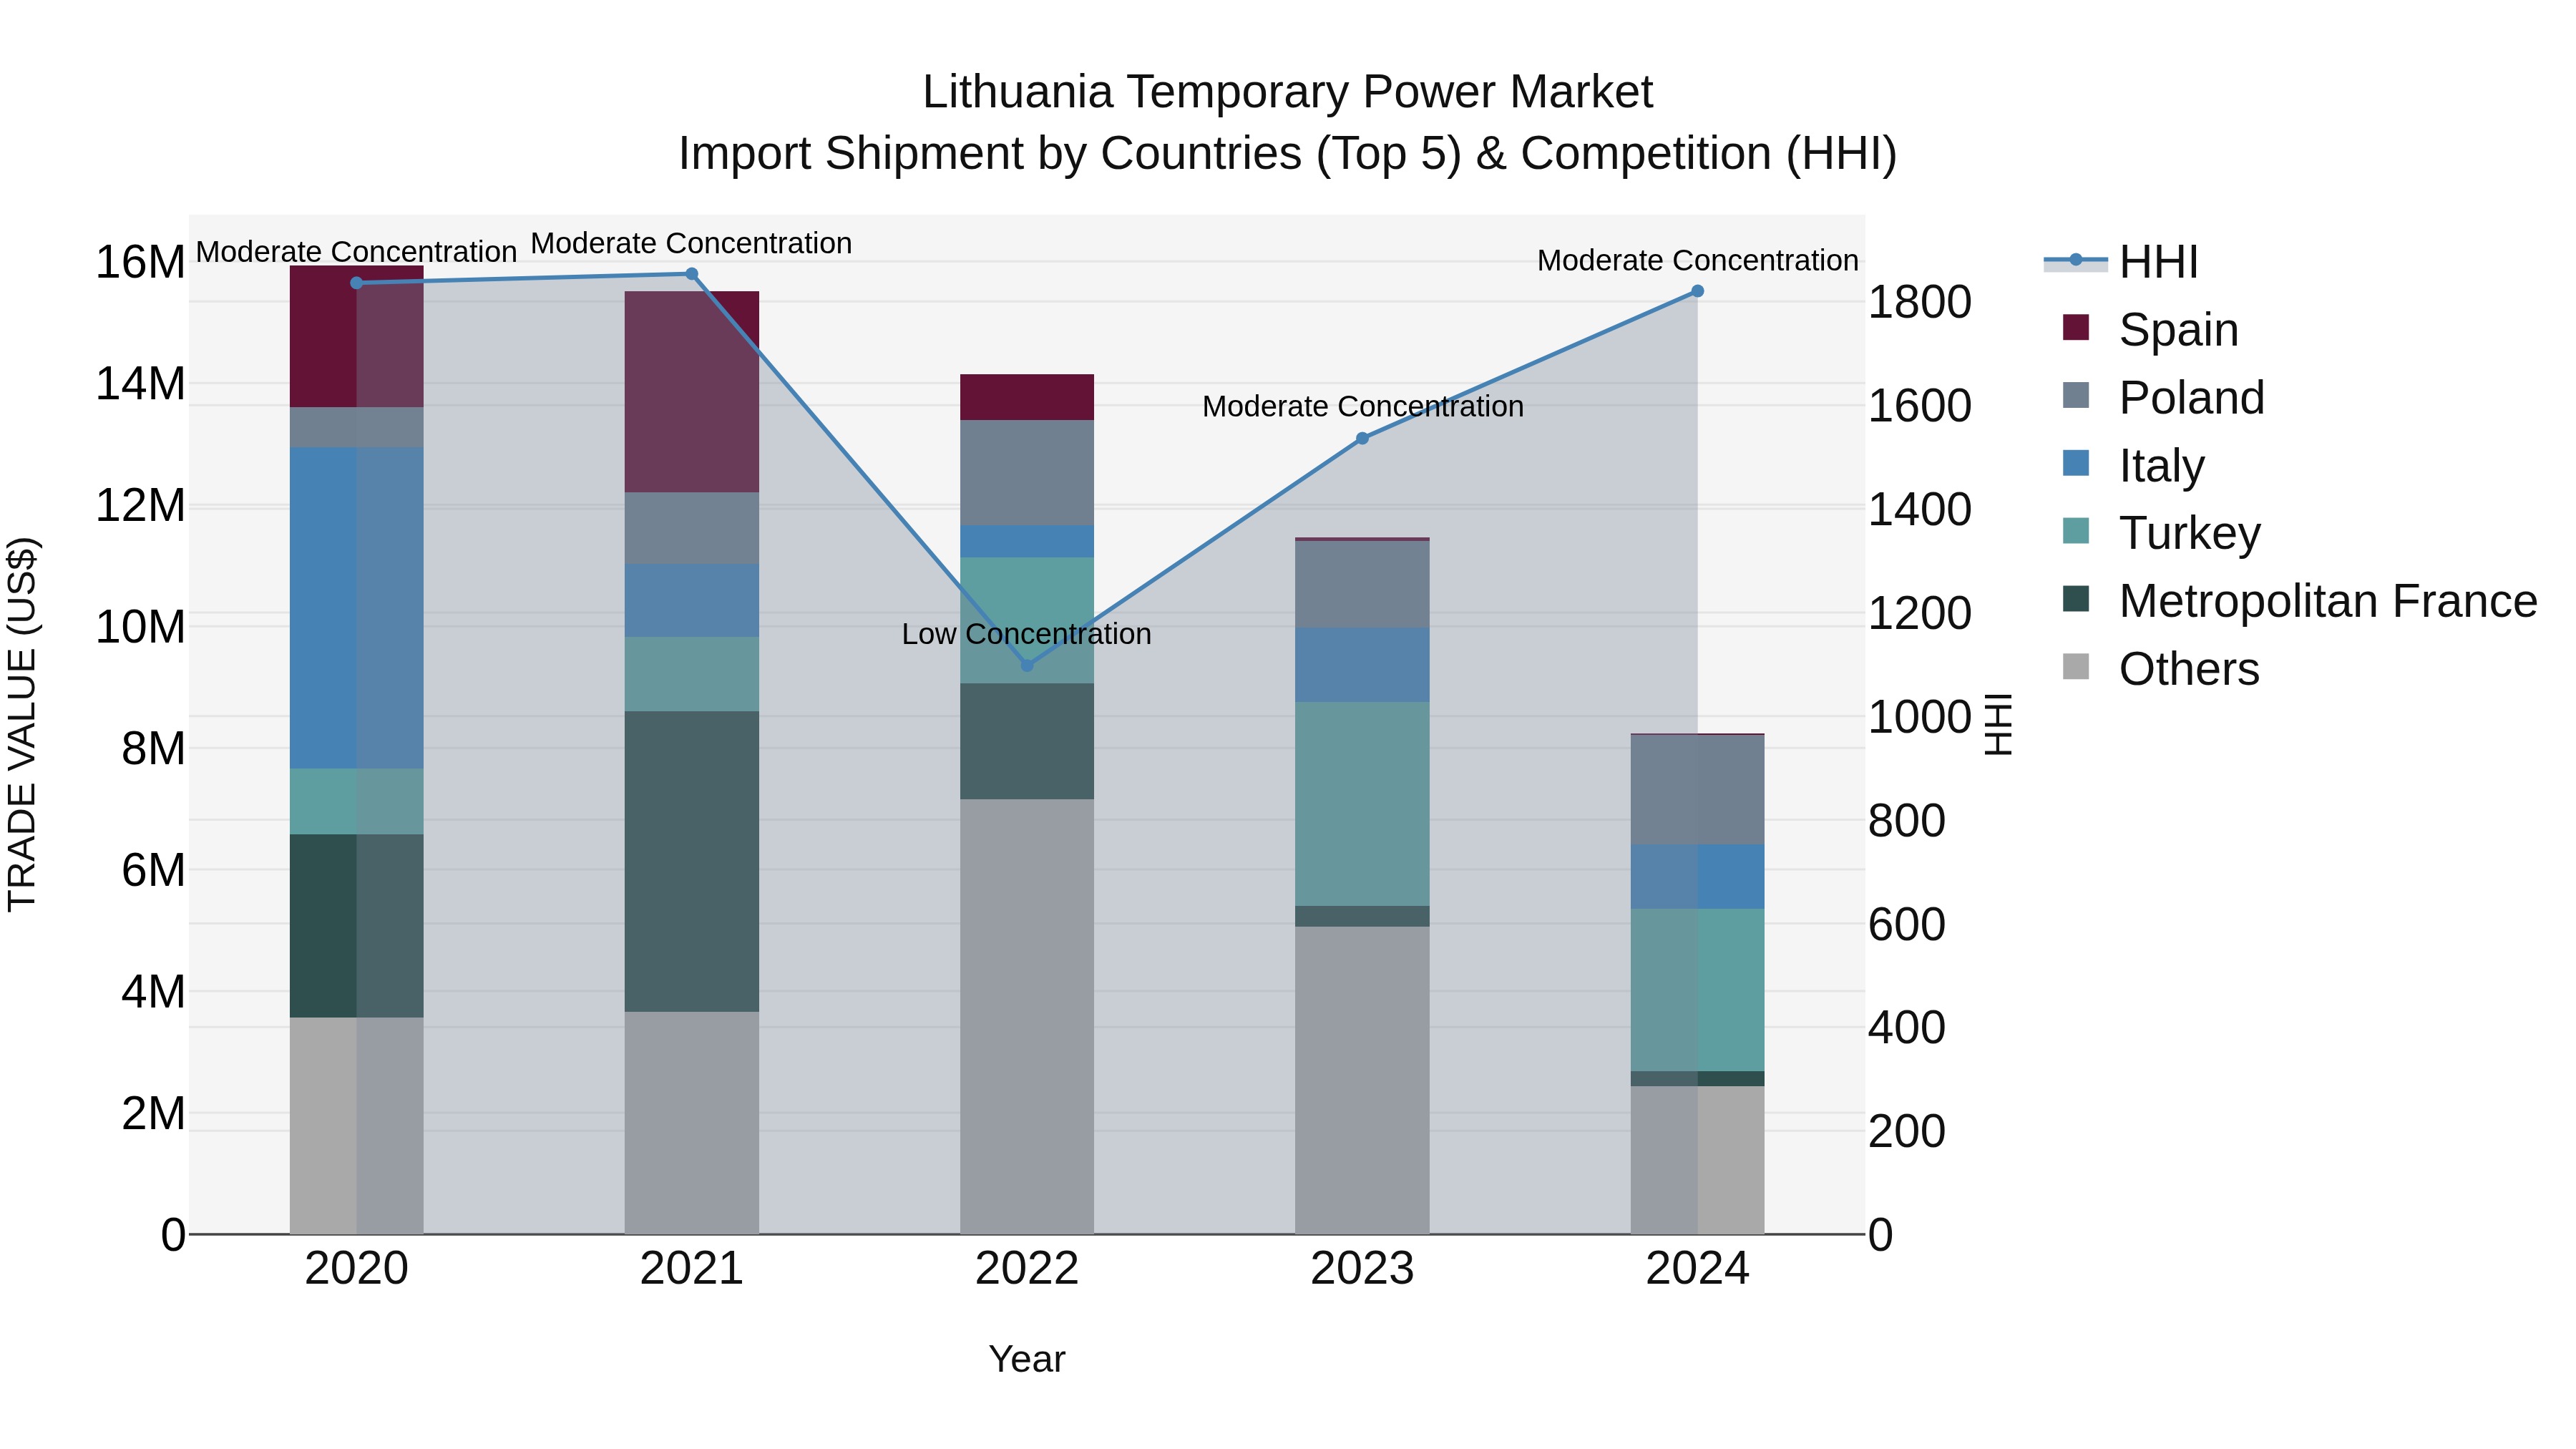
Lithuania Temporary Power Market Top 5 Importing Countries and Market Competition (HHI) Analysis
In 2024, Lithuania continued to rely on temporary power import shipments, with top exporters being Turkey, Poland, Italy, China, and Belgium. Despite a moderate concentration level according to the HHI index, the market experienced a significant decline with a CAGR of -15.19% from 2020 to 2024. The growth rate in 2024 dropped even further by -28.1% compared to the previous year, reflecting ongoing challenges in the temporary power sector in Lithuania. Market participants should closely monitor these trends to adapt their strategies accordingly.
Key Highlights of the Report:
- Lithuania Temporary Power Market Outlook
- Market Size of Lithuania Temporary Power Market, 2025
- Forecast of Lithuania Temporary Power Market, 2032
- Historical Data and Forecast of Lithuania Temporary Power Revenues & Volume for the Period 2022 - 2032F
- Lithuania Temporary Power Market Trend Evolution
- Lithuania Temporary Power Market Drivers and Challenges
- Lithuania Temporary Power Price Trends
- Lithuania Temporary Power Porter`s Five Forces
- Lithuania Temporary Power Industry Life Cycle
- Historical Data and Forecast of Lithuania Temporary Power Market Revenues & Volume By Generator Rating for the Period 2022 - 2032F
- Historical Data and Forecast of Lithuania Temporary Power Market Revenues & Volume By Less than 80 kW for the Period 2022 - 2032F
- Historical Data and Forecast of Lithuania Temporary Power Market Revenues & Volume By 81-280kW for the Period 2022 - 2032F
- Historical Data and Forecast of Lithuania Temporary Power Market Revenues & Volume By 281-600 kW for the Period 2022 - 2032F
- Historical Data and Forecast of Lithuania Temporary Power Market Revenues & Volume By End Use for the Period 2022 - 2032F
- Historical Data and Forecast of Lithuania Temporary Power Market Revenues & Volume By Events for the Period 2022 - 2032F
- Historical Data and Forecast of Lithuania Temporary Power Market Revenues & Volume By Utilities for the Period 2022 - 2032F
- Historical Data and Forecast of Lithuania Temporary Power Market Revenues & Volume By Oil & Gas for the Period 2022 - 2032F
- Historical Data and Forecast of Lithuania Temporary Power Market Revenues & Volume By Construction for the Period 2022 - 2032F
- Historical Data and Forecast of Lithuania Temporary Power Market Revenues & Volume By Mining for the Period 2022 - 2032F
- Historical Data and Forecast of Lithuania Temporary Power Market Revenues & Volume By Manufacturing for the Period 2022 - 2032F
- Historical Data and Forecast of Lithuania Temporary Power Market Revenues & Volume By Shipping for the Period 2022 - 2032F
- Historical Data and Forecast of Lithuania Temporary Power Market Revenues & Volume By Fuel Type for the Period 2022 - 2032F
- Historical Data and Forecast of Lithuania Temporary Power Market Revenues & Volume By Diesel for the Period 2022 - 2032F
- Historical Data and Forecast of Lithuania Temporary Power Market Revenues & Volume By Gas for the Period 2022 - 2032F
- Historical Data and Forecast of Lithuania Temporary Power Market Revenues & Volume By Others Duel Fuel & HFO for the Period 2022 - 2032F
- Lithuania Temporary Power Import Export Trade Statistics
- Market Opportunity Assessment By Generator Rating
- Market Opportunity Assessment By End Use
- Market Opportunity Assessment By Fuel Type
- Lithuania Temporary Power Top Companies Market Share
- Lithuania Temporary Power Competitive Benchmarking By Technical and Operational Parameters
- Lithuania Temporary Power Company Profiles
- Lithuania Temporary Power Key Strategic Recommendations
Frequently Asked Questions About the Market Study (FAQs):
6Wresearch actively monitors the Lithuania Temporary Power Market and publishes its comprehensive annual report, highlighting emerging trends, growth drivers, revenue analysis, and forecast outlook. Our insights help businesses to make data-backed strategic decisions with ongoing market dynamics. Our analysts track relevent industries related to the Lithuania Temporary Power Market, allowing our clients with actionable intelligence and reliable forecasts tailored to emerging regional needs.
Yes, we provide customisation as per your requirements. To learn more, feel free to contact us on sales@6wresearch.com
1 Executive Summary |
2 Introduction |
2.1 Key Highlights of the Report |
2.2 Report Description |
2.3 Market Scope & Segmentation |
2.4 Research Methodology |
2.5 Assumptions |
3 Lithuania Temporary Power Market Overview |
3.1 Lithuania Country Macro Economic Indicators |
3.2 Lithuania Temporary Power Market Revenues & Volume, 2022 & 2032F |
3.3 Lithuania Temporary Power Market - Industry Life Cycle |
3.4 Lithuania Temporary Power Market - Porter's Five Forces |
3.5 Lithuania Temporary Power Market Revenues & Volume Share, By Generator Rating, 2022 & 2032F |
3.6 Lithuania Temporary Power Market Revenues & Volume Share, By End Use, 2022 & 2032F |
3.7 Lithuania Temporary Power Market Revenues & Volume Share, By Fuel Type, 2022 & 2032F |
4 Lithuania Temporary Power Market Dynamics |
4.1 Impact Analysis |
4.2 Market Drivers |
4.2.1 Increasing demand for temporary power solutions due to growing construction activities in Lithuania. |
4.2.2 Rise in the number of outdoor events and festivals requiring temporary power supply. |
4.2.3 Government initiatives promoting renewable energy sources leading to the need for temporary power solutions. |
4.2.4 Growing awareness among businesses about the benefits of utilizing temporary power to ensure uninterrupted operations during power outages. |
4.3 Market Restraints |
4.3.1 Stringent regulations and permits required for setting up temporary power solutions in Lithuania. |
4.3.2 Fluctuating fuel prices impacting the operational costs of temporary power providers. |
4.3.3 Limited availability of skilled labor and technical expertise in the temporary power sector in Lithuania. |
4.3.4 Competition from traditional power sources and grid electricity providers. |
5 Lithuania Temporary Power Market Trends |
6 Lithuania Temporary Power Market Segmentations |
6.1 Lithuania Temporary Power Market, By Generator Rating |
6.1.1 Overview and Analysis |
6.1.2 Lithuania Temporary Power Market Revenues & Volume, By Less than 80 kW, 2022 - 2032F |
6.1.3 Lithuania Temporary Power Market Revenues & Volume, By 81-280kW, 2022 - 2032F |
6.1.4 Lithuania Temporary Power Market Revenues & Volume, By 281-600 kW, 2022 - 2032F |
6.2 Lithuania Temporary Power Market, By End Use |
6.2.1 Overview and Analysis |
6.2.2 Lithuania Temporary Power Market Revenues & Volume, By Events, 2022 - 2032F |
6.2.3 Lithuania Temporary Power Market Revenues & Volume, By Utilities, 2022 - 2032F |
6.2.4 Lithuania Temporary Power Market Revenues & Volume, By Oil & Gas, 2022 - 2032F |
6.2.5 Lithuania Temporary Power Market Revenues & Volume, By Construction, 2022 - 2032F |
6.2.6 Lithuania Temporary Power Market Revenues & Volume, By Mining, 2022 - 2032F |
6.2.7 Lithuania Temporary Power Market Revenues & Volume, By Manufacturing, 2022 - 2032F |
6.3 Lithuania Temporary Power Market, By Fuel Type |
6.3.1 Overview and Analysis |
6.3.2 Lithuania Temporary Power Market Revenues & Volume, By Diesel, 2022 - 2032F |
6.3.3 Lithuania Temporary Power Market Revenues & Volume, By Gas, 2022 - 2032F |
6.3.4 Lithuania Temporary Power Market Revenues & Volume, By Others Duel Fuel & HFO, 2022 - 2032F |
7 Lithuania Temporary Power Market Import-Export Trade Statistics |
7.1 Lithuania Temporary Power Market Export to Major Countries |
7.2 Lithuania Temporary Power Market Imports from Major Countries |
8 Lithuania Temporary Power Market Key Performance Indicators |
8.1 Average response time for providing temporary power solutions to clients. |
8.2 Percentage of revenue generated from renewable energy-based temporary power solutions. |
8.3 Customer satisfaction score based on feedback and reviews. |
8.4 Number of new contracts or projects secured in a given period. |
8.5 Rate of equipment utilization to ensure efficient resource allocation. |
9 Lithuania Temporary Power Market - Opportunity Assessment |
9.1 Lithuania Temporary Power Market Opportunity Assessment, By Generator Rating, 2022 & 2032F |
9.2 Lithuania Temporary Power Market Opportunity Assessment, By End Use, 2022 & 2032F |
9.3 Lithuania Temporary Power Market Opportunity Assessment, By Fuel Type, 2022 & 2032F |
10 Lithuania Temporary Power Market - Competitive Landscape |
10.1 Lithuania Temporary Power Market Revenue Share, By Companies, 2025 |
10.2 Lithuania Temporary Power Market Competitive Benchmarking, By Operating and Technical Parameters |
11 Company Profiles |
12 Recommendations | 13 Disclaimer |
Export potential assessment - trade Analytics for 2030
Export potential enables firms to identify high-growth global markets with greater confidence by combining advanced trade intelligence with a structured quantitative methodology. The framework analyzes emerging demand trends and country-level import patterns while integrating macroeconomic and trade datasets such as GDP and population forecasts, bilateral import–export flows, tariff structures, elasticity differentials between developed and developing economies, geographic distance, and import demand projections. Using weighted trade values from 2020–2024 as the base period to project country-to-country export potential for 2030, these inputs are operationalized through calculated drivers such as gravity model parameters, tariff impact factors, and projected GDP per-capita growth. Through an analysis of hidden potentials, demand hotspots, and market conditions that are most favorable to success, this method enables firms to focus on target countries, maximize returns, and global expansion with data, backed by accuracy.
By factoring in the projected importer demand gap that is currently unmet and could be potential opportunity, it identifies the potential for the Exporter (Country) among 190 countries, against the general trade analysis, which identifies the biggest importer or exporter.
To discover high-growth global markets and optimize your business strategy:
Click Here
Pricing
- Single User License$ 1,995
- Department License$ 2,400
- Site License$ 3,120
- Global License$ 3,795

Search
Thought Leadership and Analyst Meet


Our Clients
Latest Reports
- Philippines Polyhydroxybutyrate-co-Hydroxyvalerate Market (2026-2032) | Trends, Insights, Challenges, Restraints, Competition, Size, Value, Forecast, Pricing, Share, Outlook, Revenue, Investment Opportunities, Strategy, Drivers, Demand, Growth, segmentation, Analysis, Companies
- Peru Polyhydroxybutyrate-co-Hydroxyvalerate Market (2026-2032) | Growth, Demand, Challenges, Share, Trends, Analysis, Pricing, Investment Opportunities, Drivers, Value, Forecast, Competition, Size, Companies, Insights, Outlook, Restraints, segmentation, Revenue, Strategy
- Pakistan Polyhydroxybutyrate-co-Hydroxyvalerate Market (2026-2032) | Restraints, segmentation, Pricing, Forecast, Share, Strategy, Competition, Trends, Insights, Drivers, Challenges, Growth, Revenue, Outlook, Value, Investment Opportunities, Companies, Size, Analysis, Demand
- Oman Polyhydroxybutyrate-co-Hydroxyvalerate Market (2026-2032) | Drivers, segmentation, Insights, Competition, Pricing, Outlook, Size, Revenue, Challenges, Forecast, Analysis, Growth, Value, Share, Trends, Investment Opportunities, Strategy, Restraints, Companies, Demand
- Nigeria Polyhydroxybutyrate-co-Hydroxyvalerate Market (2026-2032) | Value, Investment Opportunities, Analysis, Revenue, Restraints, Pricing, Outlook, Competition, Demand, Growth, Forecast, Companies, Trends, Challenges, segmentation, Drivers, Insights, Share, Size, Strategy
- Nepal Polyhydroxybutyrate-co-Hydroxyvalerate Market (2026-2032) | Insights, Analysis, Drivers, Share, Revenue, Demand, segmentation, Investment Opportunities, Competition, Forecast, Growth, Pricing, Companies, Strategy, Trends, Restraints, Challenges, Outlook, Size, Value
- Myanmar Polyhydroxybutyrate-co-Hydroxyvalerate Market (2026-2032) | Outlook, Revenue, Strategy, Restraints, Drivers, segmentation, Share, Forecast, Competition, Insights, Growth, Pricing, Size, Demand, Value, Companies, Trends, Challenges, Investment Opportunities, Analysis
- Morocco Polyhydroxybutyrate-co-Hydroxyvalerate Market (2026-2032) | Outlook, Investment Opportunities, Restraints, Strategy, Forecast, Challenges, Drivers, Growth, Companies, segmentation, Trends, Size, Competition, Revenue, Demand, Insights, Share, Analysis, Value, Pricing
- Mexico Polyhydroxybutyrate-co-Hydroxyvalerate Market (2026-2032) | Size, Drivers, Outlook, Share, Strategy, Growth, Pricing, Challenges, Companies, Demand, Value, Investment Opportunities, Restraints, Trends, Forecast, segmentation, Analysis, Insights, Competition, Revenue
- Malaysia Polyhydroxybutyrate-co-Hydroxyvalerate Market (2026-2032) | Share, segmentation, Size, Companies, Analysis, Insights, Forecast, Value, Revenue, Drivers, Restraints, Challenges, Investment Opportunities, Trends, Competition, Strategy, Demand, Growth, Outlook, Pricing
Industry Events and Analyst Meet

HIMTEX 2026

India Refining Summit 2026

India EV Show 2026

EV tech India Expo 2026

Auto Tech Asia 2026
Whitepaper
- Middle East & Africa Commercial Security Market Click here to view more.
- Middle East & Africa Fire Safety Systems & Equipment Market Click here to view more.
- GCC Drone Market Click here to view more.
- Middle East Lighting Fixture Market Click here to view more.
- GCC Physical & Perimeter Security Market Click here to view more.
6WResearch In News
- Doha a strategic location for EV manufacturing hub: IPA Qatar
- Demand for luxury TVs surging in the GCC, says Samsung
- Empowering Growth: The Thriving Journey of Bangladesh’s Cable Industry
- Demand for luxury TVs surging in the GCC, says Samsung
- Video call with a traditional healer? Once unthinkable, it’s now common in South Africa
- Intelligent Buildings To Smooth GCC’s Path To Net Zero