Lithuania Urea Market (2026-2032) | Analysis, Industry, Revenue, Outlook, Size, Trends, Segmentation, Share, Companies, Growth, Forecast & Value
Market Forecast By Grade (Fertilizer, Feed, Technical), By End-user Industry (Agriculture, Chemical, Automotive, Medical, Others) And Competitive Landscape
| Product Code: ETC4901109 | Publication Date: Nov 2023 | Updated Date: Apr 2026 | Product Type: Market Research Report | |
| Publisher: 6Wresearch | Author: Shubham Padhi | No. of Pages: 60 | No. of Figures: 30 | No. of Tables: 5 |
Lithuania Urea Market Size (2020-2030)
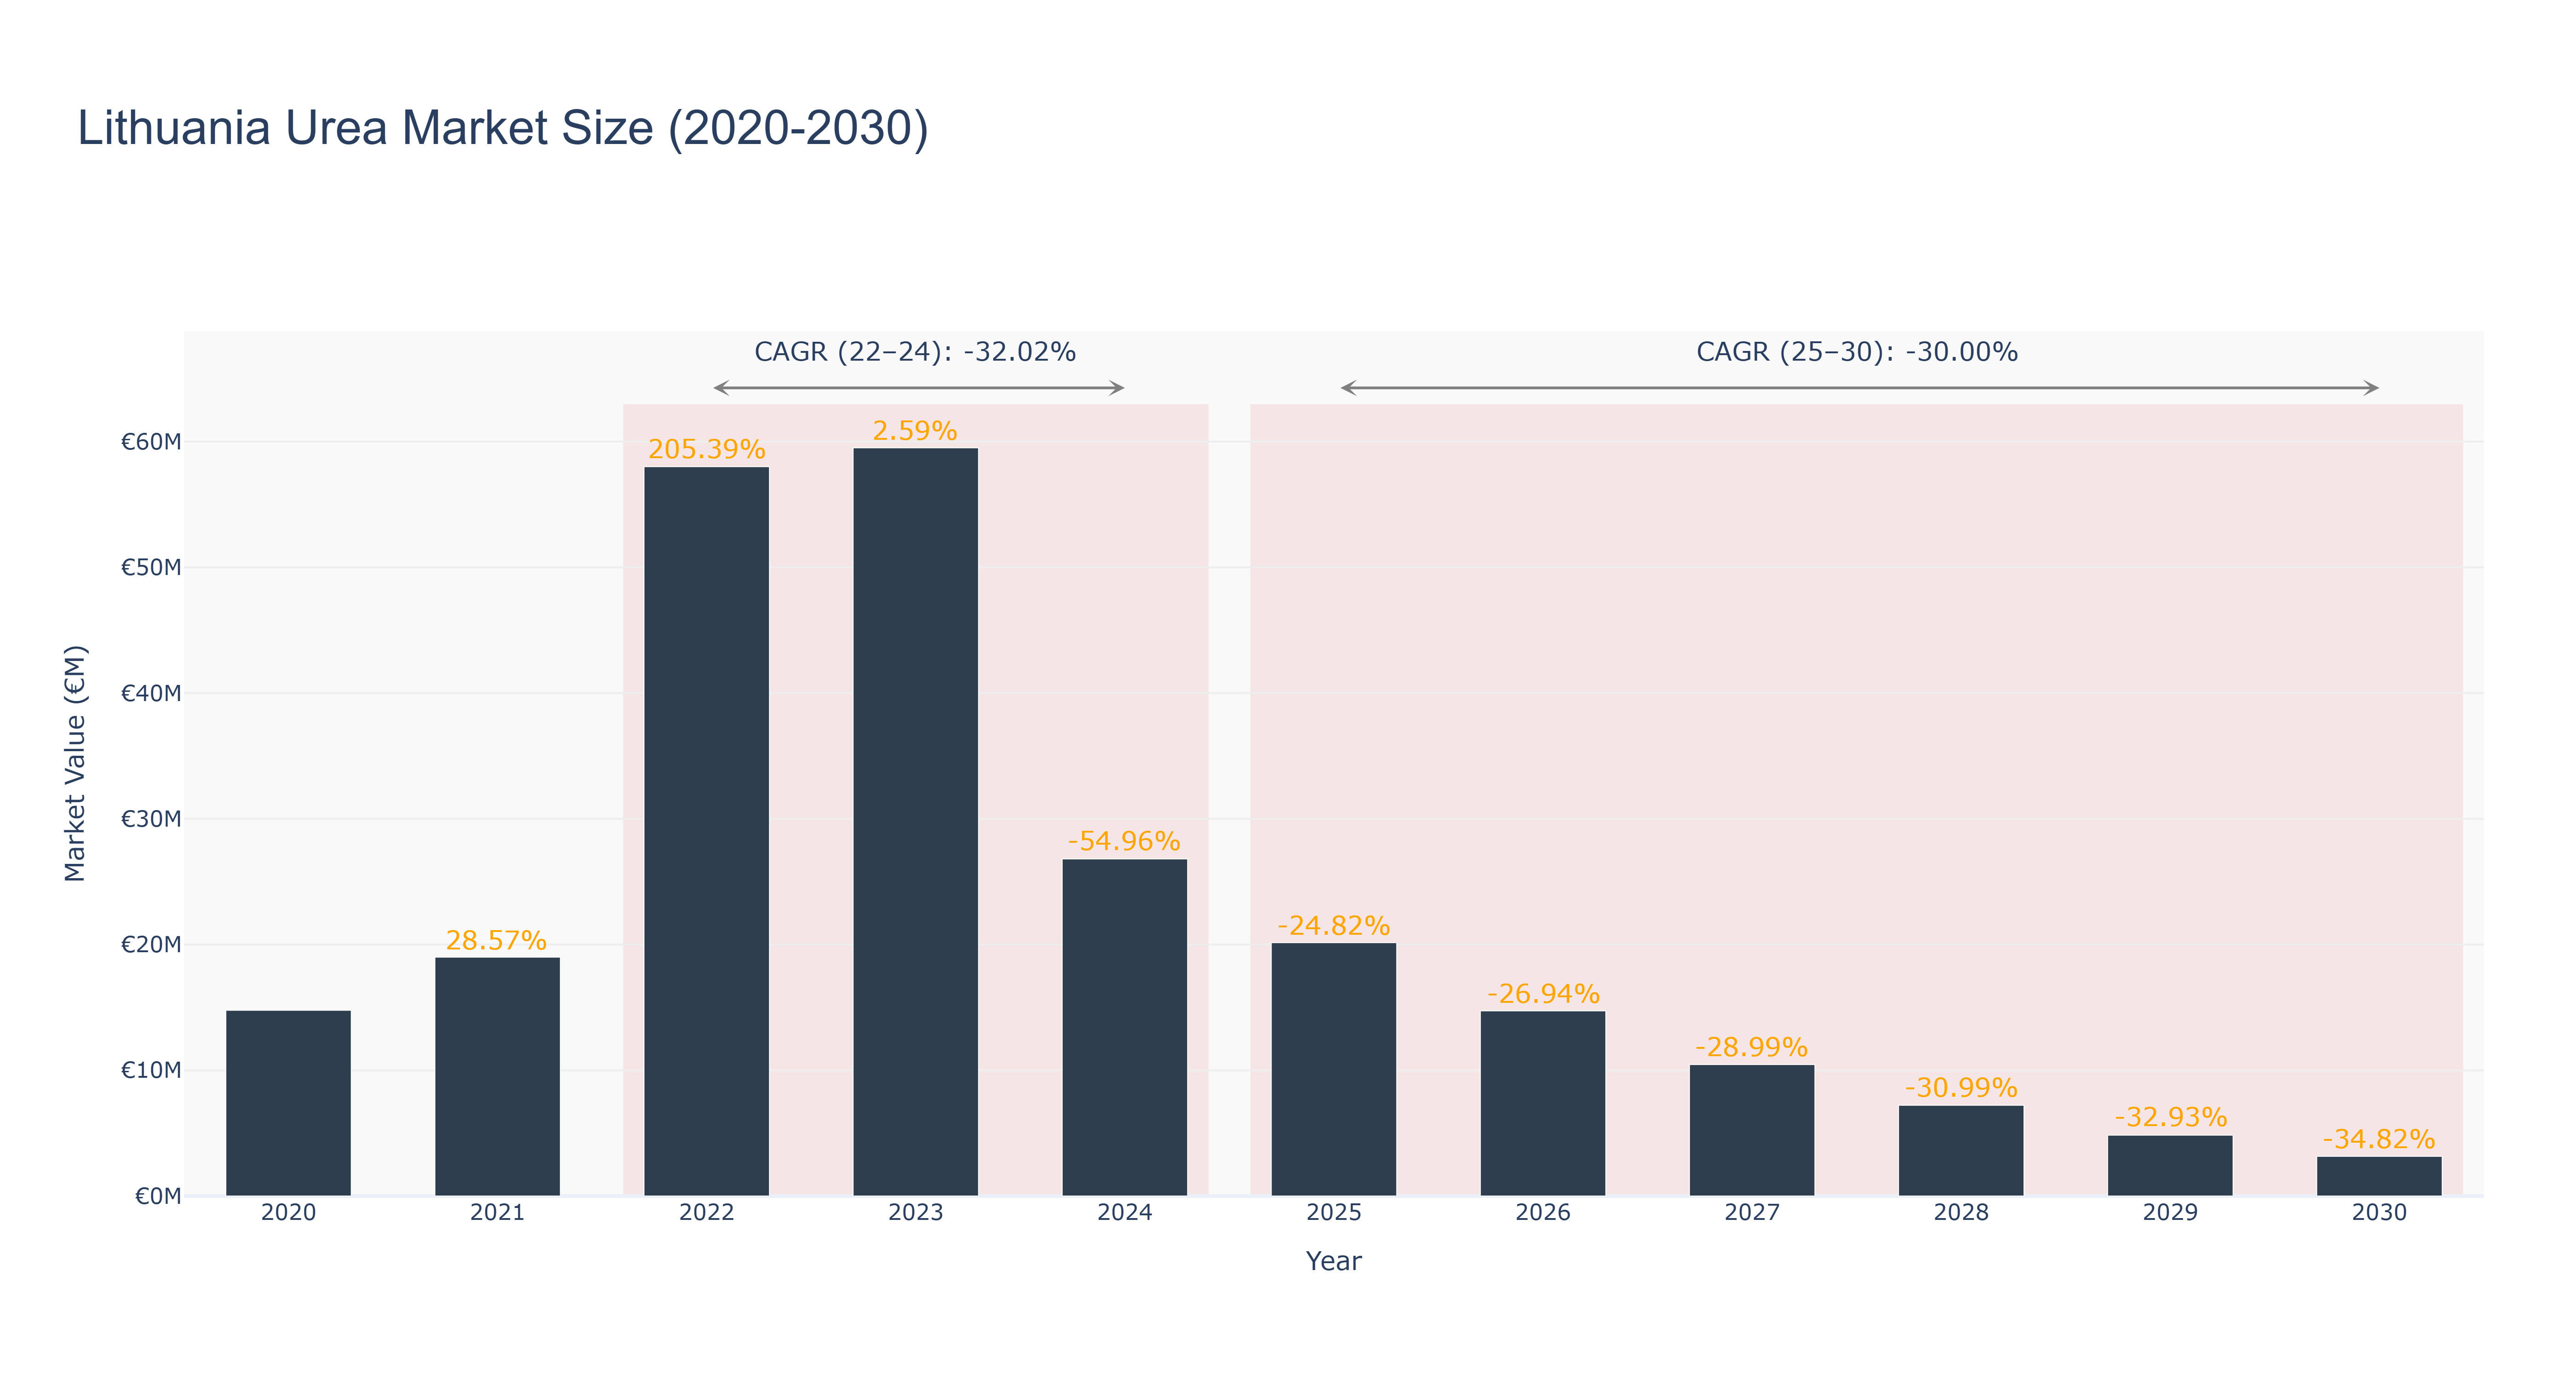
The Lithuania Urea Market, once at its peak in 2023 with a market size of €59.51 million, has seen a significant decline in recent years. The market size decreased to €20.15 million in 2025 and further dropped to €14.72 million in 2026. The CAGR from 2022-24 was -32.02%, while from 2025-30 it is projected to be -30.0%. The downward trend can be attributed to factors such as changing consumer preferences, economic fluctuations, and increased competition in the market. Looking ahead, the market is expected to stabilize with upcoming investments in sustainable farming practices and technological advancements in urea production processes. These developments aim to enhance product quality and reduce environmental impact, positioning Lithuania as a key player in the global urea market.
Lithuania Urea Market: Production & Trade Performance (2019-2025)
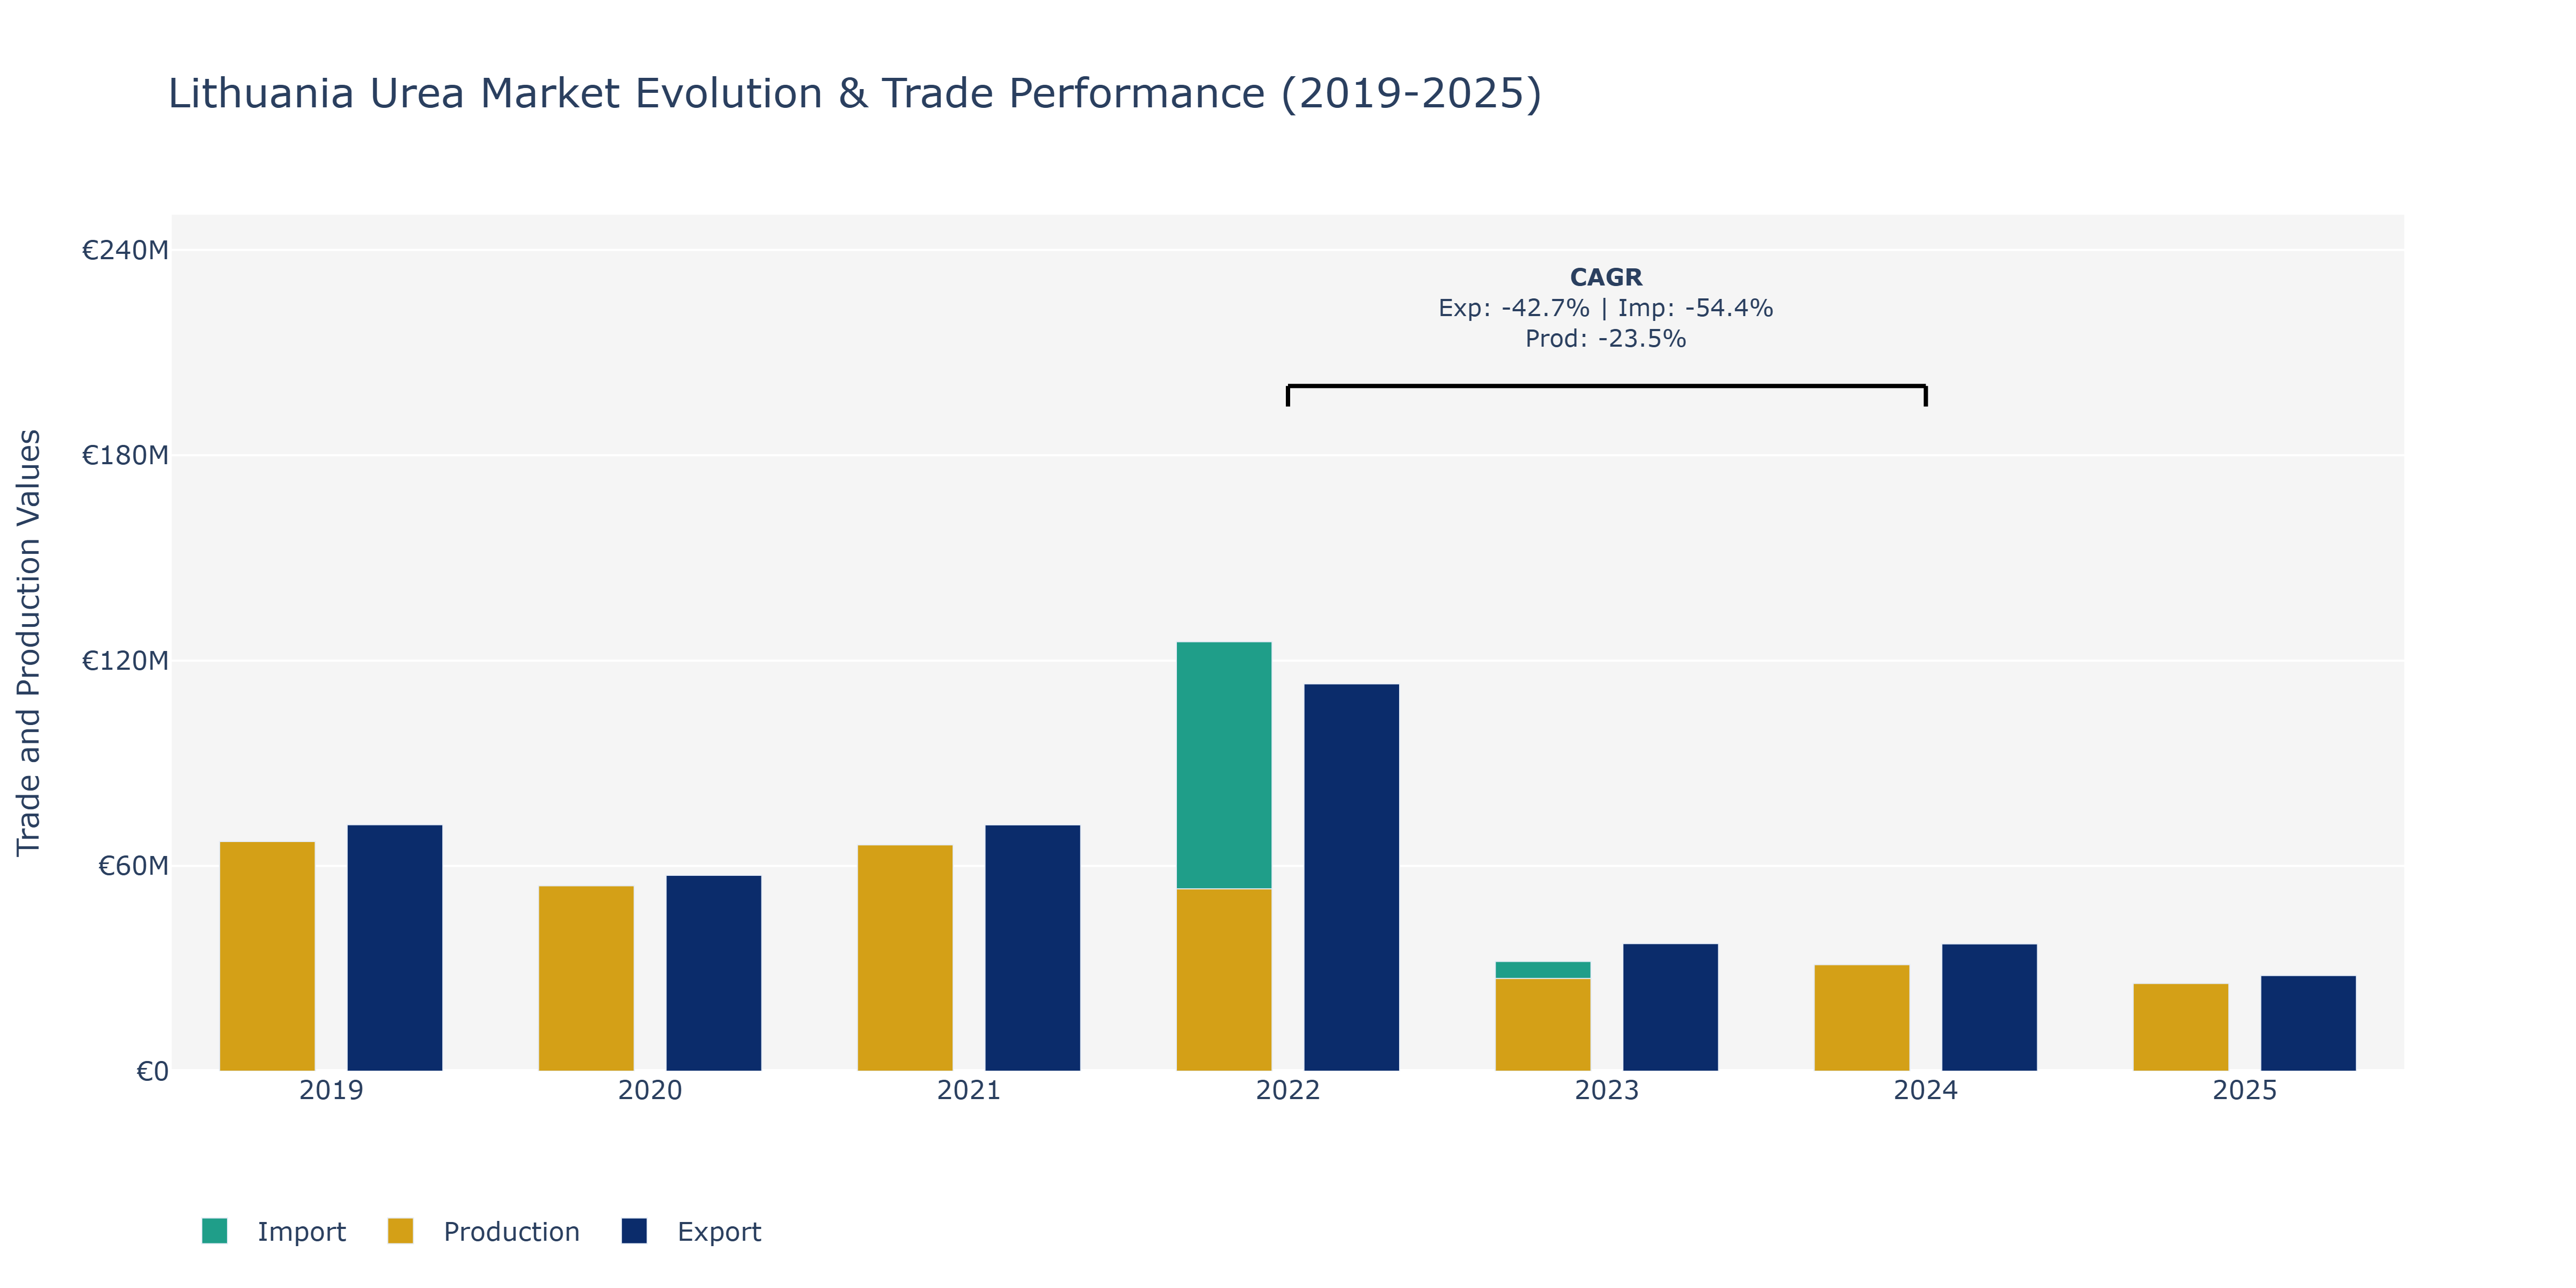
Between 2019 and 2025, the Lithuania Urea Market exhibited diverse trends in Exports, Imports, and Production. Exports peaked in 2022 at approximately €113.18 million before sharply declining in subsequent years, reaching around €27.97 million in 2025. In contrast, Imports fluctuated, with the highest value in 2022 at €125.53 million, followed by a decrease to about €19.65 million in 2025. Production, which stood at €67.14 million in 2019, experienced a notable drop to €25.66 million by 2025. These fluctuations can be attributed to various factors such as changes in global demand for urea, price fluctuations in the fertilizer market, and possibly shifts in local production capacity. The declining trend in Exports and Production could be influenced by competitive pressures from other markets or changes in domestic consumption patterns. To ensure market stability, stakeholders could focus on enhancing production efficiency, exploring new export markets, and strategic pricing strategies aligned with market demands.
Key Highlights of the Report:
- Lithuania Urea Market Outlook
- Market Size of Lithuania Urea Market, 2025
- Forecast of Lithuania Urea Market, 2032
- Historical Data and Forecast of Lithuania Urea Revenues & Volume for the Period 2022 - 2032F
- Lithuania Urea Market Trend Evolution
- Lithuania Urea Market Drivers and Challenges
- Lithuania Urea Price Trends
- Lithuania Urea Porter`s Five Forces
- Lithuania Urea Industry Life Cycle
- Historical Data and Forecast of Lithuania Urea Market Revenues & Volume By Grade for the Period 2022 - 2032F
- Historical Data and Forecast of Lithuania Urea Market Revenues & Volume By Fertilizer for the Period 2022 - 2032F
- Historical Data and Forecast of Lithuania Urea Market Revenues & Volume By Feed for the Period 2022 - 2032F
- Historical Data and Forecast of Lithuania Urea Market Revenues & Volume By Technical for the Period 2022 - 2032F
- Historical Data and Forecast of Lithuania Urea Market Revenues & Volume By End-user Industry for the Period 2022 - 2032F
- Historical Data and Forecast of Lithuania Urea Market Revenues & Volume By Agriculture for the Period 2022 - 2032F
- Historical Data and Forecast of Lithuania Urea Market Revenues & Volume By Chemical for the Period 2022 - 2032F
- Historical Data and Forecast of Lithuania Urea Market Revenues & Volume By Automotive for the Period 2022 - 2032F
- Historical Data and Forecast of Lithuania Urea Market Revenues & Volume By Medical for the Period 2022 - 2032F
- Historical Data and Forecast of Lithuania Urea Market Revenues & Volume By Others for the Period 2022 - 2032F
- Lithuania Urea Import Export Trade Statistics
- Market Opportunity Assessment By Grade
- Market Opportunity Assessment By End-user Industry
- Lithuania Urea Top Companies Market Share
- Lithuania Urea Competitive Benchmarking By Technical and Operational Parameters
- Lithuania Urea Company Profiles
- Lithuania Urea Key Strategic Recommendations
Frequently Asked Questions About the Market Study (FAQs):
6Wresearch actively monitors the Lithuania Urea Market and publishes its comprehensive annual report, highlighting emerging trends, growth drivers, revenue analysis, and forecast outlook. Our insights help businesses to make data-backed strategic decisions with ongoing market dynamics. Our analysts track relevent industries related to the Lithuania Urea Market, allowing our clients with actionable intelligence and reliable forecasts tailored to emerging regional needs.
Yes, we provide customisation as per your requirements. To learn more, feel free to contact us on sales@6wresearch.com
1 Executive Summary |
2 Introduction |
2.1 Key Highlights of the Report |
2.2 Report Description |
2.3 Market Scope & Segmentation |
2.4 Research Methodology |
2.5 Assumptions |
3 Lithuania Urea Market Overview |
3.1 Lithuania Country Macro Economic Indicators |
3.2 Lithuania Urea Market Revenues & Volume, 2022 & 2032F |
3.3 Lithuania Urea Market - Industry Life Cycle |
3.4 Lithuania Urea Market - Porter's Five Forces |
3.5 Lithuania Urea Market Revenues & Volume Share, By Grade, 2022 & 2032F |
3.6 Lithuania Urea Market Revenues & Volume Share, By End-user Industry, 2022 & 2032F |
4 Lithuania Urea Market Dynamics |
4.1 Impact Analysis |
4.2 Market Drivers |
4.2.1 Growing demand for urea in agriculture sector due to its high nitrogen content. |
4.2.2 Government support and subsidies for agricultural activities in Lithuania. |
4.2.3 Increasing adoption of urea as a fertilizer for crop production. |
4.3 Market Restraints |
4.3.1 Volatility in urea prices in the global market. |
4.3.2 Environmental concerns and regulations related to urea production and usage. |
4.3.3 Competition from alternative fertilizers impacting the demand for urea. |
5 Lithuania Urea Market Trends |
6 Lithuania Urea Market Segmentations |
6.1 Lithuania Urea Market, By Grade |
6.1.1 Overview and Analysis |
6.1.2 Lithuania Urea Market Revenues & Volume, By Fertilizer, 2022 - 2032F |
6.1.3 Lithuania Urea Market Revenues & Volume, By Feed, 2022 - 2032F |
6.1.4 Lithuania Urea Market Revenues & Volume, By Technical, 2022 - 2032F |
6.2 Lithuania Urea Market, By End-user Industry |
6.2.1 Overview and Analysis |
6.2.2 Lithuania Urea Market Revenues & Volume, By Agriculture, 2022 - 2032F |
6.2.3 Lithuania Urea Market Revenues & Volume, By Chemical, 2022 - 2032F |
6.2.4 Lithuania Urea Market Revenues & Volume, By Automotive, 2022 - 2032F |
6.2.5 Lithuania Urea Market Revenues & Volume, By Medical, 2022 - 2032F |
6.2.6 Lithuania Urea Market Revenues & Volume, By Others, 2022 - 2032F |
7 Lithuania Urea Market Import-Export Trade Statistics |
7.1 Lithuania Urea Market Export to Major Countries |
7.2 Lithuania Urea Market Imports from Major Countries |
8 Lithuania Urea Market Key Performance Indicators |
8.1 Average selling price of urea in Lithuania. |
8.2 Adoption rate of urea-based fertilizers among farmers. |
8.3 Investment in research and development for enhancing urea production efficiency. |
9 Lithuania Urea Market - Opportunity Assessment |
9.1 Lithuania Urea Market Opportunity Assessment, By Grade, 2022 & 2032F |
9.2 Lithuania Urea Market Opportunity Assessment, By End-user Industry, 2022 & 2032F |
10 Lithuania Urea Market - Competitive Landscape |
10.1 Lithuania Urea Market Revenue Share, By Companies, 2025 |
10.2 Lithuania Urea Market Competitive Benchmarking, By Operating and Technical Parameters |
11 Company Profiles |
12 Recommendations | 13 Disclaimer |
Export potential assessment - trade Analytics for 2030
Export potential enables firms to identify high-growth global markets with greater confidence by combining advanced trade intelligence with a structured quantitative methodology. The framework analyzes emerging demand trends and country-level import patterns while integrating macroeconomic and trade datasets such as GDP and population forecasts, bilateral import–export flows, tariff structures, elasticity differentials between developed and developing economies, geographic distance, and import demand projections. Using weighted trade values from 2020–2024 as the base period to project country-to-country export potential for 2030, these inputs are operationalized through calculated drivers such as gravity model parameters, tariff impact factors, and projected GDP per-capita growth. Through an analysis of hidden potentials, demand hotspots, and market conditions that are most favorable to success, this method enables firms to focus on target countries, maximize returns, and global expansion with data, backed by accuracy.
By factoring in the projected importer demand gap that is currently unmet and could be potential opportunity, it identifies the potential for the Exporter (Country) among 190 countries, against the general trade analysis, which identifies the biggest importer or exporter.
To discover high-growth global markets and optimize your business strategy:
Click Here
Pricing
- Single User License$ 1,995
- Department License$ 2,400
- Site License$ 3,120
- Global License$ 3,795

Search
Thought Leadership and Analyst Meet


Our Clients
Latest Reports
- Philippines Polyhydroxybutyrate-co-Hydroxyvalerate Market (2026-2032) | Trends, Insights, Challenges, Restraints, Competition, Size, Value, Forecast, Pricing, Share, Outlook, Revenue, Investment Opportunities, Strategy, Drivers, Demand, Growth, segmentation, Analysis, Companies
- Peru Polyhydroxybutyrate-co-Hydroxyvalerate Market (2026-2032) | Growth, Demand, Challenges, Share, Trends, Analysis, Pricing, Investment Opportunities, Drivers, Value, Forecast, Competition, Size, Companies, Insights, Outlook, Restraints, segmentation, Revenue, Strategy
- Pakistan Polyhydroxybutyrate-co-Hydroxyvalerate Market (2026-2032) | Restraints, segmentation, Pricing, Forecast, Share, Strategy, Competition, Trends, Insights, Drivers, Challenges, Growth, Revenue, Outlook, Value, Investment Opportunities, Companies, Size, Analysis, Demand
- Oman Polyhydroxybutyrate-co-Hydroxyvalerate Market (2026-2032) | Drivers, segmentation, Insights, Competition, Pricing, Outlook, Size, Revenue, Challenges, Forecast, Analysis, Growth, Value, Share, Trends, Investment Opportunities, Strategy, Restraints, Companies, Demand
- Nigeria Polyhydroxybutyrate-co-Hydroxyvalerate Market (2026-2032) | Value, Investment Opportunities, Analysis, Revenue, Restraints, Pricing, Outlook, Competition, Demand, Growth, Forecast, Companies, Trends, Challenges, segmentation, Drivers, Insights, Share, Size, Strategy
- Nepal Polyhydroxybutyrate-co-Hydroxyvalerate Market (2026-2032) | Insights, Analysis, Drivers, Share, Revenue, Demand, segmentation, Investment Opportunities, Competition, Forecast, Growth, Pricing, Companies, Strategy, Trends, Restraints, Challenges, Outlook, Size, Value
- Myanmar Polyhydroxybutyrate-co-Hydroxyvalerate Market (2026-2032) | Outlook, Revenue, Strategy, Restraints, Drivers, segmentation, Share, Forecast, Competition, Insights, Growth, Pricing, Size, Demand, Value, Companies, Trends, Challenges, Investment Opportunities, Analysis
- Morocco Polyhydroxybutyrate-co-Hydroxyvalerate Market (2026-2032) | Outlook, Investment Opportunities, Restraints, Strategy, Forecast, Challenges, Drivers, Growth, Companies, segmentation, Trends, Size, Competition, Revenue, Demand, Insights, Share, Analysis, Value, Pricing
- Mexico Polyhydroxybutyrate-co-Hydroxyvalerate Market (2026-2032) | Size, Drivers, Outlook, Share, Strategy, Growth, Pricing, Challenges, Companies, Demand, Value, Investment Opportunities, Restraints, Trends, Forecast, segmentation, Analysis, Insights, Competition, Revenue
- Malaysia Polyhydroxybutyrate-co-Hydroxyvalerate Market (2026-2032) | Share, segmentation, Size, Companies, Analysis, Insights, Forecast, Value, Revenue, Drivers, Restraints, Challenges, Investment Opportunities, Trends, Competition, Strategy, Demand, Growth, Outlook, Pricing
Industry Events and Analyst Meet

HIMTEX 2026

India Refining Summit 2026

India EV Show 2026

EV tech India Expo 2026

Auto Tech Asia 2026
Whitepaper
- Middle East & Africa Commercial Security Market Click here to view more.
- Middle East & Africa Fire Safety Systems & Equipment Market Click here to view more.
- GCC Drone Market Click here to view more.
- Middle East Lighting Fixture Market Click here to view more.
- GCC Physical & Perimeter Security Market Click here to view more.
6WResearch In News
- Doha a strategic location for EV manufacturing hub: IPA Qatar
- Demand for luxury TVs surging in the GCC, says Samsung
- Empowering Growth: The Thriving Journey of Bangladesh’s Cable Industry
- Demand for luxury TVs surging in the GCC, says Samsung
- Video call with a traditional healer? Once unthinkable, it’s now common in South Africa
- Intelligent Buildings To Smooth GCC’s Path To Net Zero