Lithuania UV Curable Inks Market (2025-2031) | Value, Trends, Competitive Landscape, Segmentation, Analysis, Industry, Share, Growth, Size & Revenue, Forecast, Companies, Outlook
Market Forecast By Type (Offset Printing UV Curable Inks, Silkscreen Printing UV Curable Inks, Flexo Printing UV Curable Inks, Gravure UV Curable Inks, Digital Printing UV Curable Inks), By Application (Automobile, Consumer goods, Medical, Publications and printing, Others) And Competitive Landscape
| Product Code: ETC8053423 | Publication Date: Sep 2024 | Updated Date: Apr 2026 | Product Type: Market Research Report | |
| Publisher: 6Wresearch | Author: Sumit Sagar | No. of Pages: 75 | No. of Figures: 35 | No. of Tables: 20 |
Lithuania Uv Curable Inks Market Size (2020-2030)
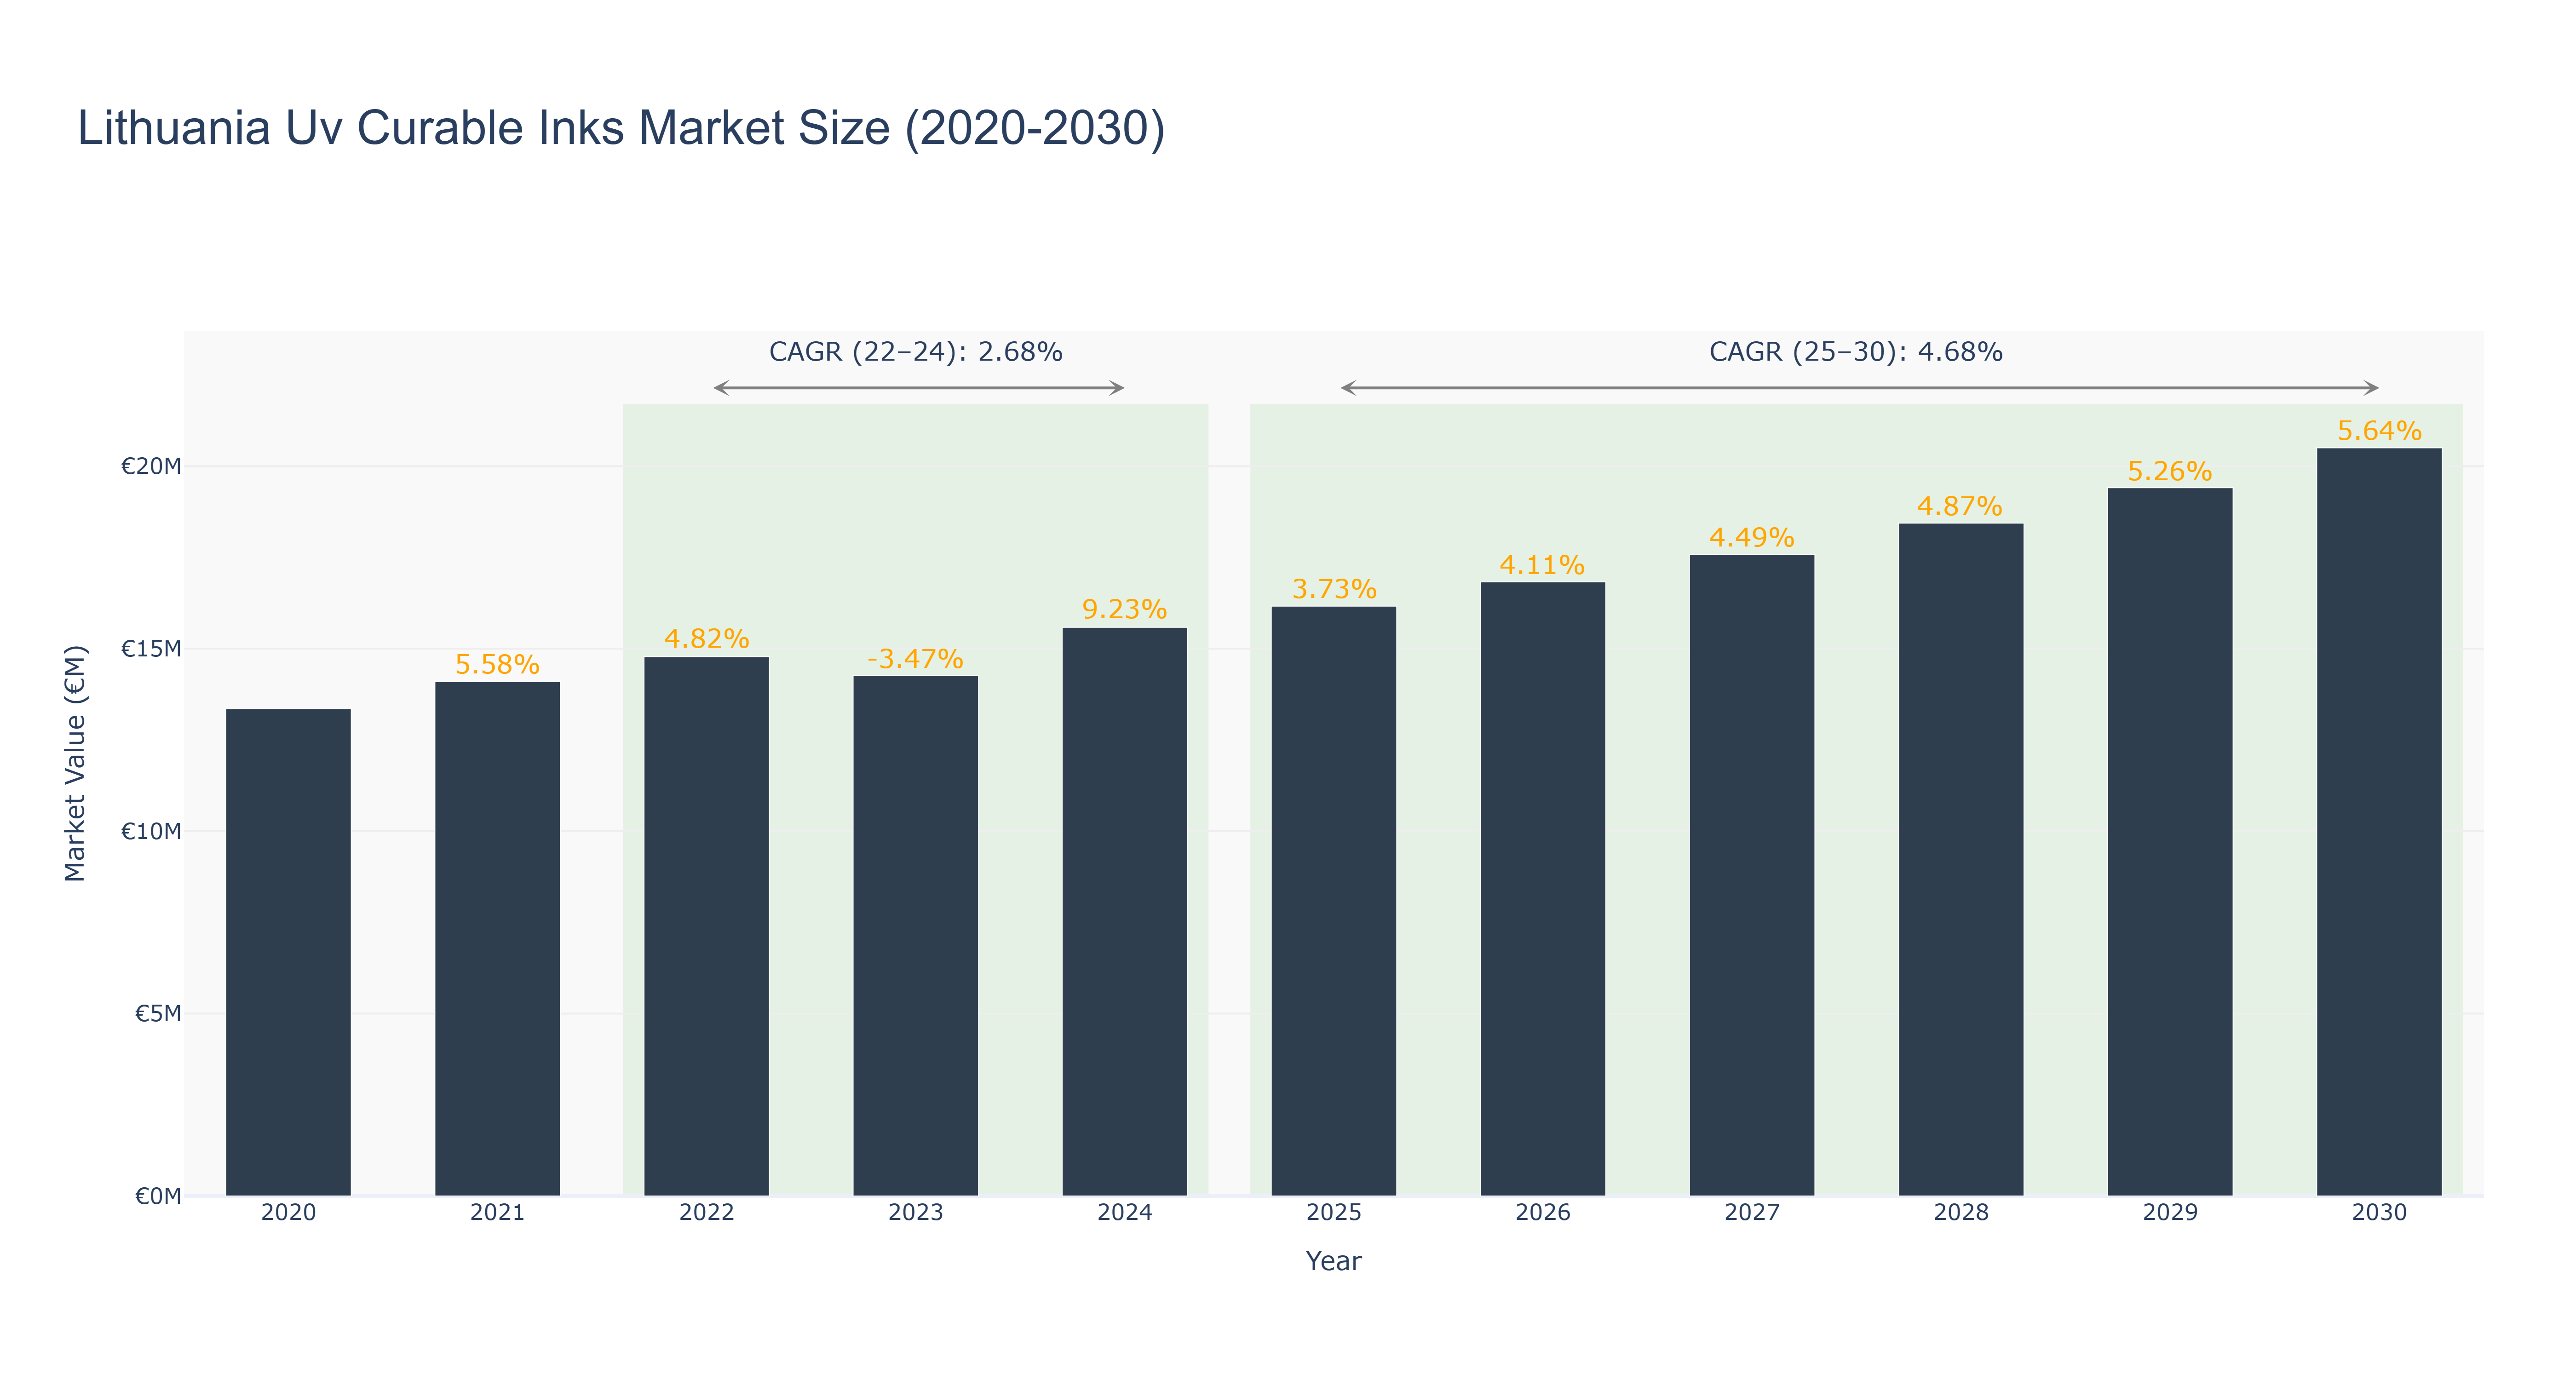
The Lithuania UV Curable Inks Market has shown a steady growth trajectory over the years. The peak market size of €20.51 million is forecasted for 2030, with a notable increase in market size from €13.36 million in 2020 to €15.58 million in 2024. The market is expected to continue its upward trend, with a forecasted size of €16.83 million in 2026. The CAGR for the period 2022-24 is 2.68%, indicating a moderate growth rate, while the CAGR for 2025-30 is projected at 4.68%, reflecting a more robust expansion. Industry drivers for this market include the increasing demand for eco-friendly inks and the growth of the packaging industry. Recent developments in Lithuania's printing sector, such as investments in advanced printing technologies and collaborations with international ink manufacturers, are set to further propel the UV curable inks market in the country.
Lithuania Uv Curable Inks Market: Production & Trade Performance (2019-2025)
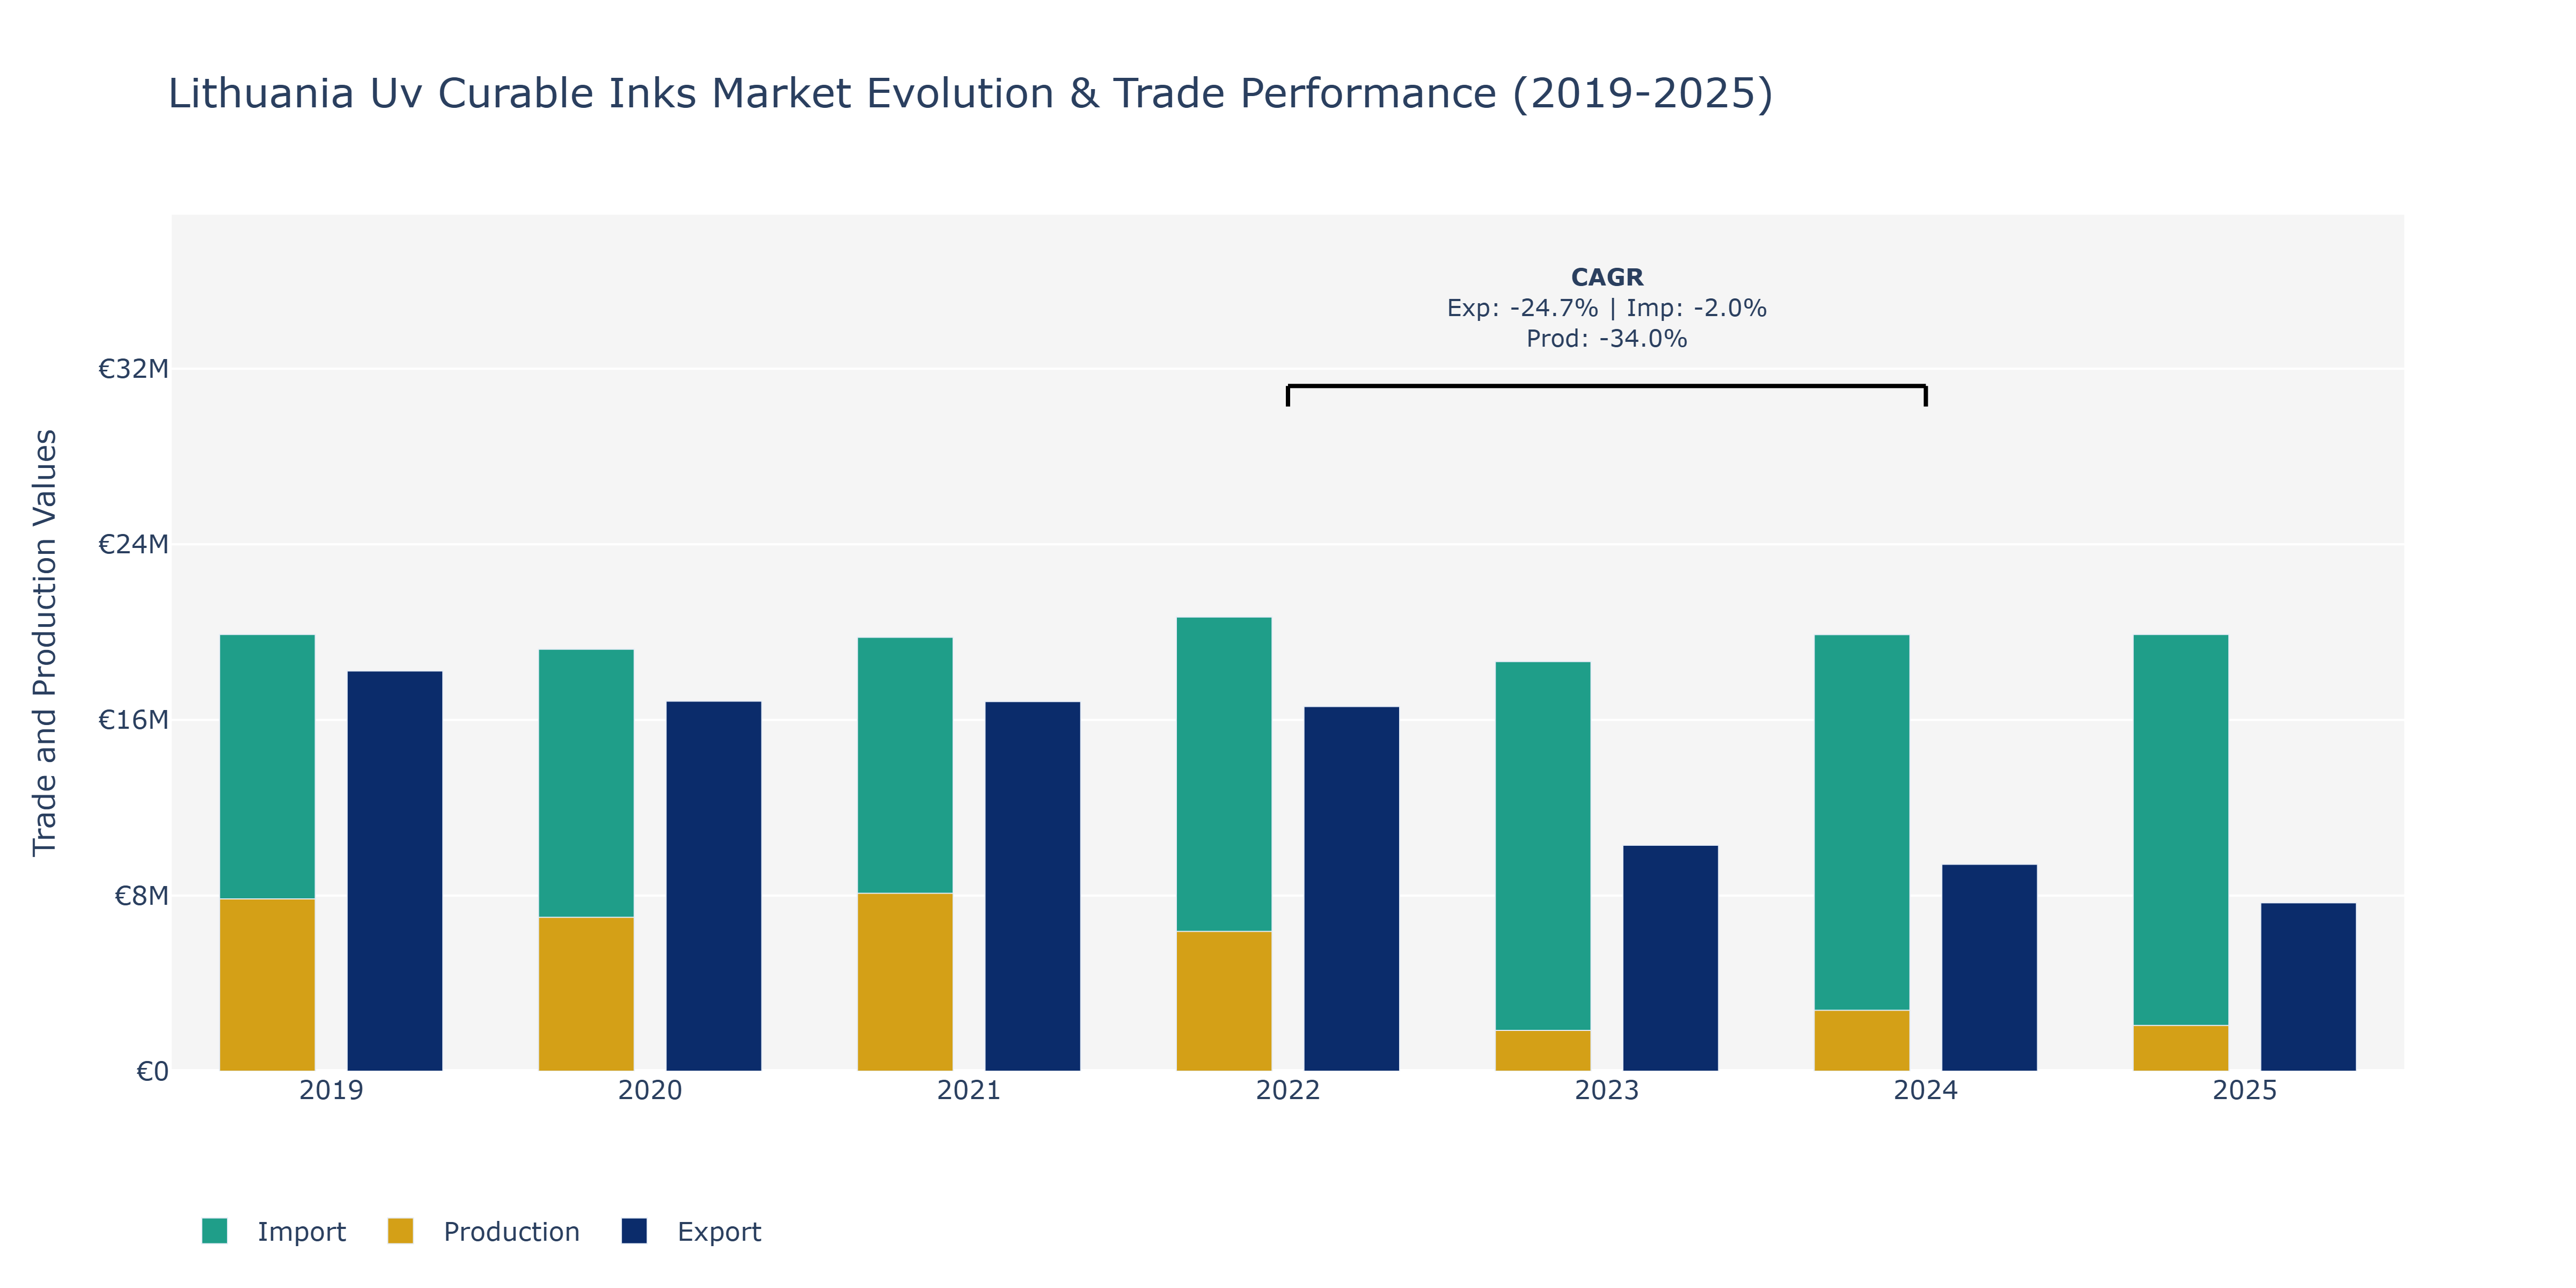
In the Lithuania UV Curable Inks Market, exports experienced a gradual decline from €18.23 million in 2019 to €7.67 million in 2025. This downward trend may be attributed to increased competition in the global market, leading to pricing pressures on exports. Imports, on the other hand, fluctuated slightly, showing a mild decrease from €19.89 million in 2019 to €19.89 million in 2025, indicating a relatively stable demand for foreign UV curable inks. Production levels also varied significantly, with a notable peak in 2021 at €8.10 million before dropping to €2.08 million in 2025. This decline could be linked to shifts in consumer preferences towards other printing technologies or changes in domestic manufacturing capacities. To adapt to these market dynamics, companies may need to focus on innovation, quality improvement, and strategic partnerships to maintain competitiveness in the UV curable inks sector.
Key Highlights of the Report:
- Lithuania UV Curable Inks Market Outlook
- Market Size of Lithuania UV Curable Inks Market, 2024
- Forecast of Lithuania UV Curable Inks Market, 2031
- Historical Data and Forecast of Lithuania UV Curable Inks Revenues & Volume for the Period 2021- 2031
- Lithuania UV Curable Inks Market Trend Evolution
- Lithuania UV Curable Inks Market Drivers and Challenges
- Lithuania UV Curable Inks Price Trends
- Lithuania UV Curable Inks Porter's Five Forces
- Lithuania UV Curable Inks Industry Life Cycle
- Historical Data and Forecast of Lithuania UV Curable Inks Market Revenues & Volume By Type for the Period 2021- 2031
- Historical Data and Forecast of Lithuania UV Curable Inks Market Revenues & Volume By Offset Printing UV Curable Inks for the Period 2021- 2031
- Historical Data and Forecast of Lithuania UV Curable Inks Market Revenues & Volume By Silkscreen Printing UV Curable Inks for the Period 2021- 2031
- Historical Data and Forecast of Lithuania UV Curable Inks Market Revenues & Volume By Flexo Printing UV Curable Inks for the Period 2021- 2031
- Historical Data and Forecast of Lithuania UV Curable Inks Market Revenues & Volume By Gravure UV Curable Inks for the Period 2021- 2031
- Historical Data and Forecast of Lithuania UV Curable Inks Market Revenues & Volume By Digital Printing UV Curable Inks for the Period 2021- 2031
- Historical Data and Forecast of Lithuania UV Curable Inks Market Revenues & Volume By Application for the Period 2021- 2031
- Historical Data and Forecast of Lithuania UV Curable Inks Market Revenues & Volume By Automobile for the Period 2021- 2031
- Historical Data and Forecast of Lithuania UV Curable Inks Market Revenues & Volume By Consumer goods for the Period 2021- 2031
- Historical Data and Forecast of Lithuania UV Curable Inks Market Revenues & Volume By Medical for the Period 2021- 2031
- Historical Data and Forecast of Lithuania UV Curable Inks Market Revenues & Volume By Publications and printing for the Period 2021- 2031
- Historical Data and Forecast of Lithuania UV Curable Inks Market Revenues & Volume By Others for the Period 2021- 2031
- Lithuania UV Curable Inks Import Export Trade Statistics
- Market Opportunity Assessment By Type
- Market Opportunity Assessment By Application
- Lithuania UV Curable Inks Top Companies Market Share
- Lithuania UV Curable Inks Competitive Benchmarking By Technical and Operational Parameters
- Lithuania UV Curable Inks Company Profiles
- Lithuania UV Curable Inks Key Strategic Recommendations
Frequently Asked Questions About the Market Study (FAQs):
6Wresearch actively monitors the Lithuania UV Curable Inks Market and publishes its comprehensive annual report, highlighting emerging trends, growth drivers, revenue analysis, and forecast outlook. Our insights help businesses to make data-backed strategic decisions with ongoing market dynamics. Our analysts track relevent industries related to the Lithuania UV Curable Inks Market, allowing our clients with actionable intelligence and reliable forecasts tailored to emerging regional needs.
Yes, we provide customisation as per your requirements. To learn more, feel free to contact us on sales@6wresearch.com
1 Executive Summary |
2 Introduction |
2.1 Key Highlights of the Report |
2.2 Report Description |
2.3 Market Scope & Segmentation |
2.4 Research Methodology |
2.5 Assumptions |
3 Lithuania UV Curable Inks Market Overview |
3.1 Lithuania Country Macro Economic Indicators |
3.2 Lithuania UV Curable Inks Market Revenues & Volume, 2021 & 2031F |
3.3 Lithuania UV Curable Inks Market - Industry Life Cycle |
3.4 Lithuania UV Curable Inks Market - Porter's Five Forces |
3.5 Lithuania UV Curable Inks Market Revenues & Volume Share, By Type, 2021 & 2031F |
3.6 Lithuania UV Curable Inks Market Revenues & Volume Share, By Application, 2021 & 2031F |
4 Lithuania UV Curable Inks Market Dynamics |
4.1 Impact Analysis |
4.2 Market Drivers |
4.2.1 Growing demand for eco-friendly and sustainable printing solutions |
4.2.2 Increasing adoption of UV curable inks in various industries such as packaging, automotive, and electronics |
4.2.3 Technological advancements leading to improved performance and versatility of UV curable inks |
4.3 Market Restraints |
4.3.1 High initial investment cost associated with UV curable inks and curing equipment |
4.3.2 Limited availability of raw materials used in UV curable inks production |
4.3.3 Stringent regulations regarding the use of chemicals in printing inks |
5 Lithuania UV Curable Inks Market Trends |
6 Lithuania UV Curable Inks Market, By Types |
6.1 Lithuania UV Curable Inks Market, By Type |
6.1.1 Overview and Analysis |
6.1.2 Lithuania UV Curable Inks Market Revenues & Volume, By Type, 2021- 2031F |
6.1.3 Lithuania UV Curable Inks Market Revenues & Volume, By Offset Printing UV Curable Inks, 2021- 2031F |
6.1.4 Lithuania UV Curable Inks Market Revenues & Volume, By Silkscreen Printing UV Curable Inks, 2021- 2031F |
6.1.5 Lithuania UV Curable Inks Market Revenues & Volume, By Flexo Printing UV Curable Inks, 2021- 2031F |
6.1.6 Lithuania UV Curable Inks Market Revenues & Volume, By Gravure UV Curable Inks, 2021- 2031F |
6.1.7 Lithuania UV Curable Inks Market Revenues & Volume, By Digital Printing UV Curable Inks, 2021- 2031F |
6.2 Lithuania UV Curable Inks Market, By Application |
6.2.1 Overview and Analysis |
6.2.2 Lithuania UV Curable Inks Market Revenues & Volume, By Automobile, 2021- 2031F |
6.2.3 Lithuania UV Curable Inks Market Revenues & Volume, By Consumer goods, 2021- 2031F |
6.2.4 Lithuania UV Curable Inks Market Revenues & Volume, By Medical, 2021- 2031F |
6.2.5 Lithuania UV Curable Inks Market Revenues & Volume, By Publications and printing, 2021- 2031F |
6.2.6 Lithuania UV Curable Inks Market Revenues & Volume, By Others, 2021- 2031F |
7 Lithuania UV Curable Inks Market Import-Export Trade Statistics |
7.1 Lithuania UV Curable Inks Market Export to Major Countries |
7.2 Lithuania UV Curable Inks Market Imports from Major Countries |
8 Lithuania UV Curable Inks Market Key Performance Indicators |
8.1 Research and development investment in UV curable ink formulations |
8.2 Adoption rate of UV curable inks in new application areas |
8.3 Environmental certifications obtained by UV curable ink manufacturers |
8.4 Percentage of UV curable ink sales generated from innovative product lines |
8.5 Number of partnerships and collaborations for expanding market reach and product offerings |
9 Lithuania UV Curable Inks Market - Opportunity Assessment |
9.1 Lithuania UV Curable Inks Market Opportunity Assessment, By Type, 2021 & 2031F |
9.2 Lithuania UV Curable Inks Market Opportunity Assessment, By Application, 2021 & 2031F |
10 Lithuania UV Curable Inks Market - Competitive Landscape |
10.1 Lithuania UV Curable Inks Market Revenue Share, By Companies, 2024 |
10.2 Lithuania UV Curable Inks Market Competitive Benchmarking, By Operating and Technical Parameters |
11 Company Profiles |
12 Recommendations |
13 Disclaimer |
Export potential assessment - trade Analytics for 2030
Export potential enables firms to identify high-growth global markets with greater confidence by combining advanced trade intelligence with a structured quantitative methodology. The framework analyzes emerging demand trends and country-level import patterns while integrating macroeconomic and trade datasets such as GDP and population forecasts, bilateral import–export flows, tariff structures, elasticity differentials between developed and developing economies, geographic distance, and import demand projections. Using weighted trade values from 2020–2024 as the base period to project country-to-country export potential for 2030, these inputs are operationalized through calculated drivers such as gravity model parameters, tariff impact factors, and projected GDP per-capita growth. Through an analysis of hidden potentials, demand hotspots, and market conditions that are most favorable to success, this method enables firms to focus on target countries, maximize returns, and global expansion with data, backed by accuracy.
By factoring in the projected importer demand gap that is currently unmet and could be potential opportunity, it identifies the potential for the Exporter (Country) among 190 countries, against the general trade analysis, which identifies the biggest importer or exporter.
To discover high-growth global markets and optimize your business strategy:
Click Here
Pricing
- Single User License$ 1,995
- Department License$ 2,400
- Site License$ 3,120
- Global License$ 3,795

Thought Leadership
Search
Thought Leadership and Analyst Meet


Our Clients
Latest Reports
- New Zealand Aseptic Manufacturing Market (2026-2032)
- Netherlands Aseptic Manufacturing Market (2026-2032)
- Nauru Aseptic Manufacturing Market (2026-2032)
- Namibia Aseptic Manufacturing Market (2026-2032)
- Mozambique Aseptic Manufacturing Market (2026-2032)
- Montenegro Aseptic Manufacturing Market (2026-2032)
- Mongolia Aseptic Manufacturing Market (2026-2032)
- Monaco Aseptic Manufacturing Market (2026-2032)
- Micronesia Aseptic Manufacturing Market (2026-2032)
- Mauritius Aseptic Manufacturing Market (2026-2032)
Industry Events and Analyst Meet

HIMTEX 2026

India Refining Summit 2026

India EV Show 2026

EV tech India Expo 2026

Auto Tech Asia 2026
Whitepaper
- Middle East & Africa Commercial Security Market Click here to view more.
- Middle East & Africa Fire Safety Systems & Equipment Market Click here to view more.
- GCC Drone Market Click here to view more.
- Middle East Lighting Fixture Market Click here to view more.
- GCC Physical & Perimeter Security Market Click here to view more.
6WResearch In News
- Doha a strategic location for EV manufacturing hub: IPA Qatar
- Demand for luxury TVs surging in the GCC, says Samsung
- Empowering Growth: The Thriving Journey of Bangladesh’s Cable Industry
- Demand for luxury TVs surging in the GCC, says Samsung
- Video call with a traditional healer? Once unthinkable, it’s now common in South Africa
- Intelligent Buildings To Smooth GCC’s Path To Net Zero