Lithuania Varnish Market (2026-2032) | Industry, Outlook, Growth, Value, Trends, Share, Size & Revenue, Companies, Forecast, Segmentation, Analysis, Competitive Landscape
Market Forecast By Type (UV Curable Overprint Varnishes, Water Based Overprint Varnish), By Application (Commercial prints, Food Industry, Pharmaceuticals, Others) And Competitive Landscape
| Product Code: ETC8053718 | Publication Date: Sep 2024 | Updated Date: Apr 2026 | Product Type: Market Research Report | |
| Publisher: 6Wresearch | Author: Sumit Sagar | No. of Pages: 75 | No. of Figures: 35 | No. of Tables: 20 |
Lithuania Varnish Market Size (2020-2030)
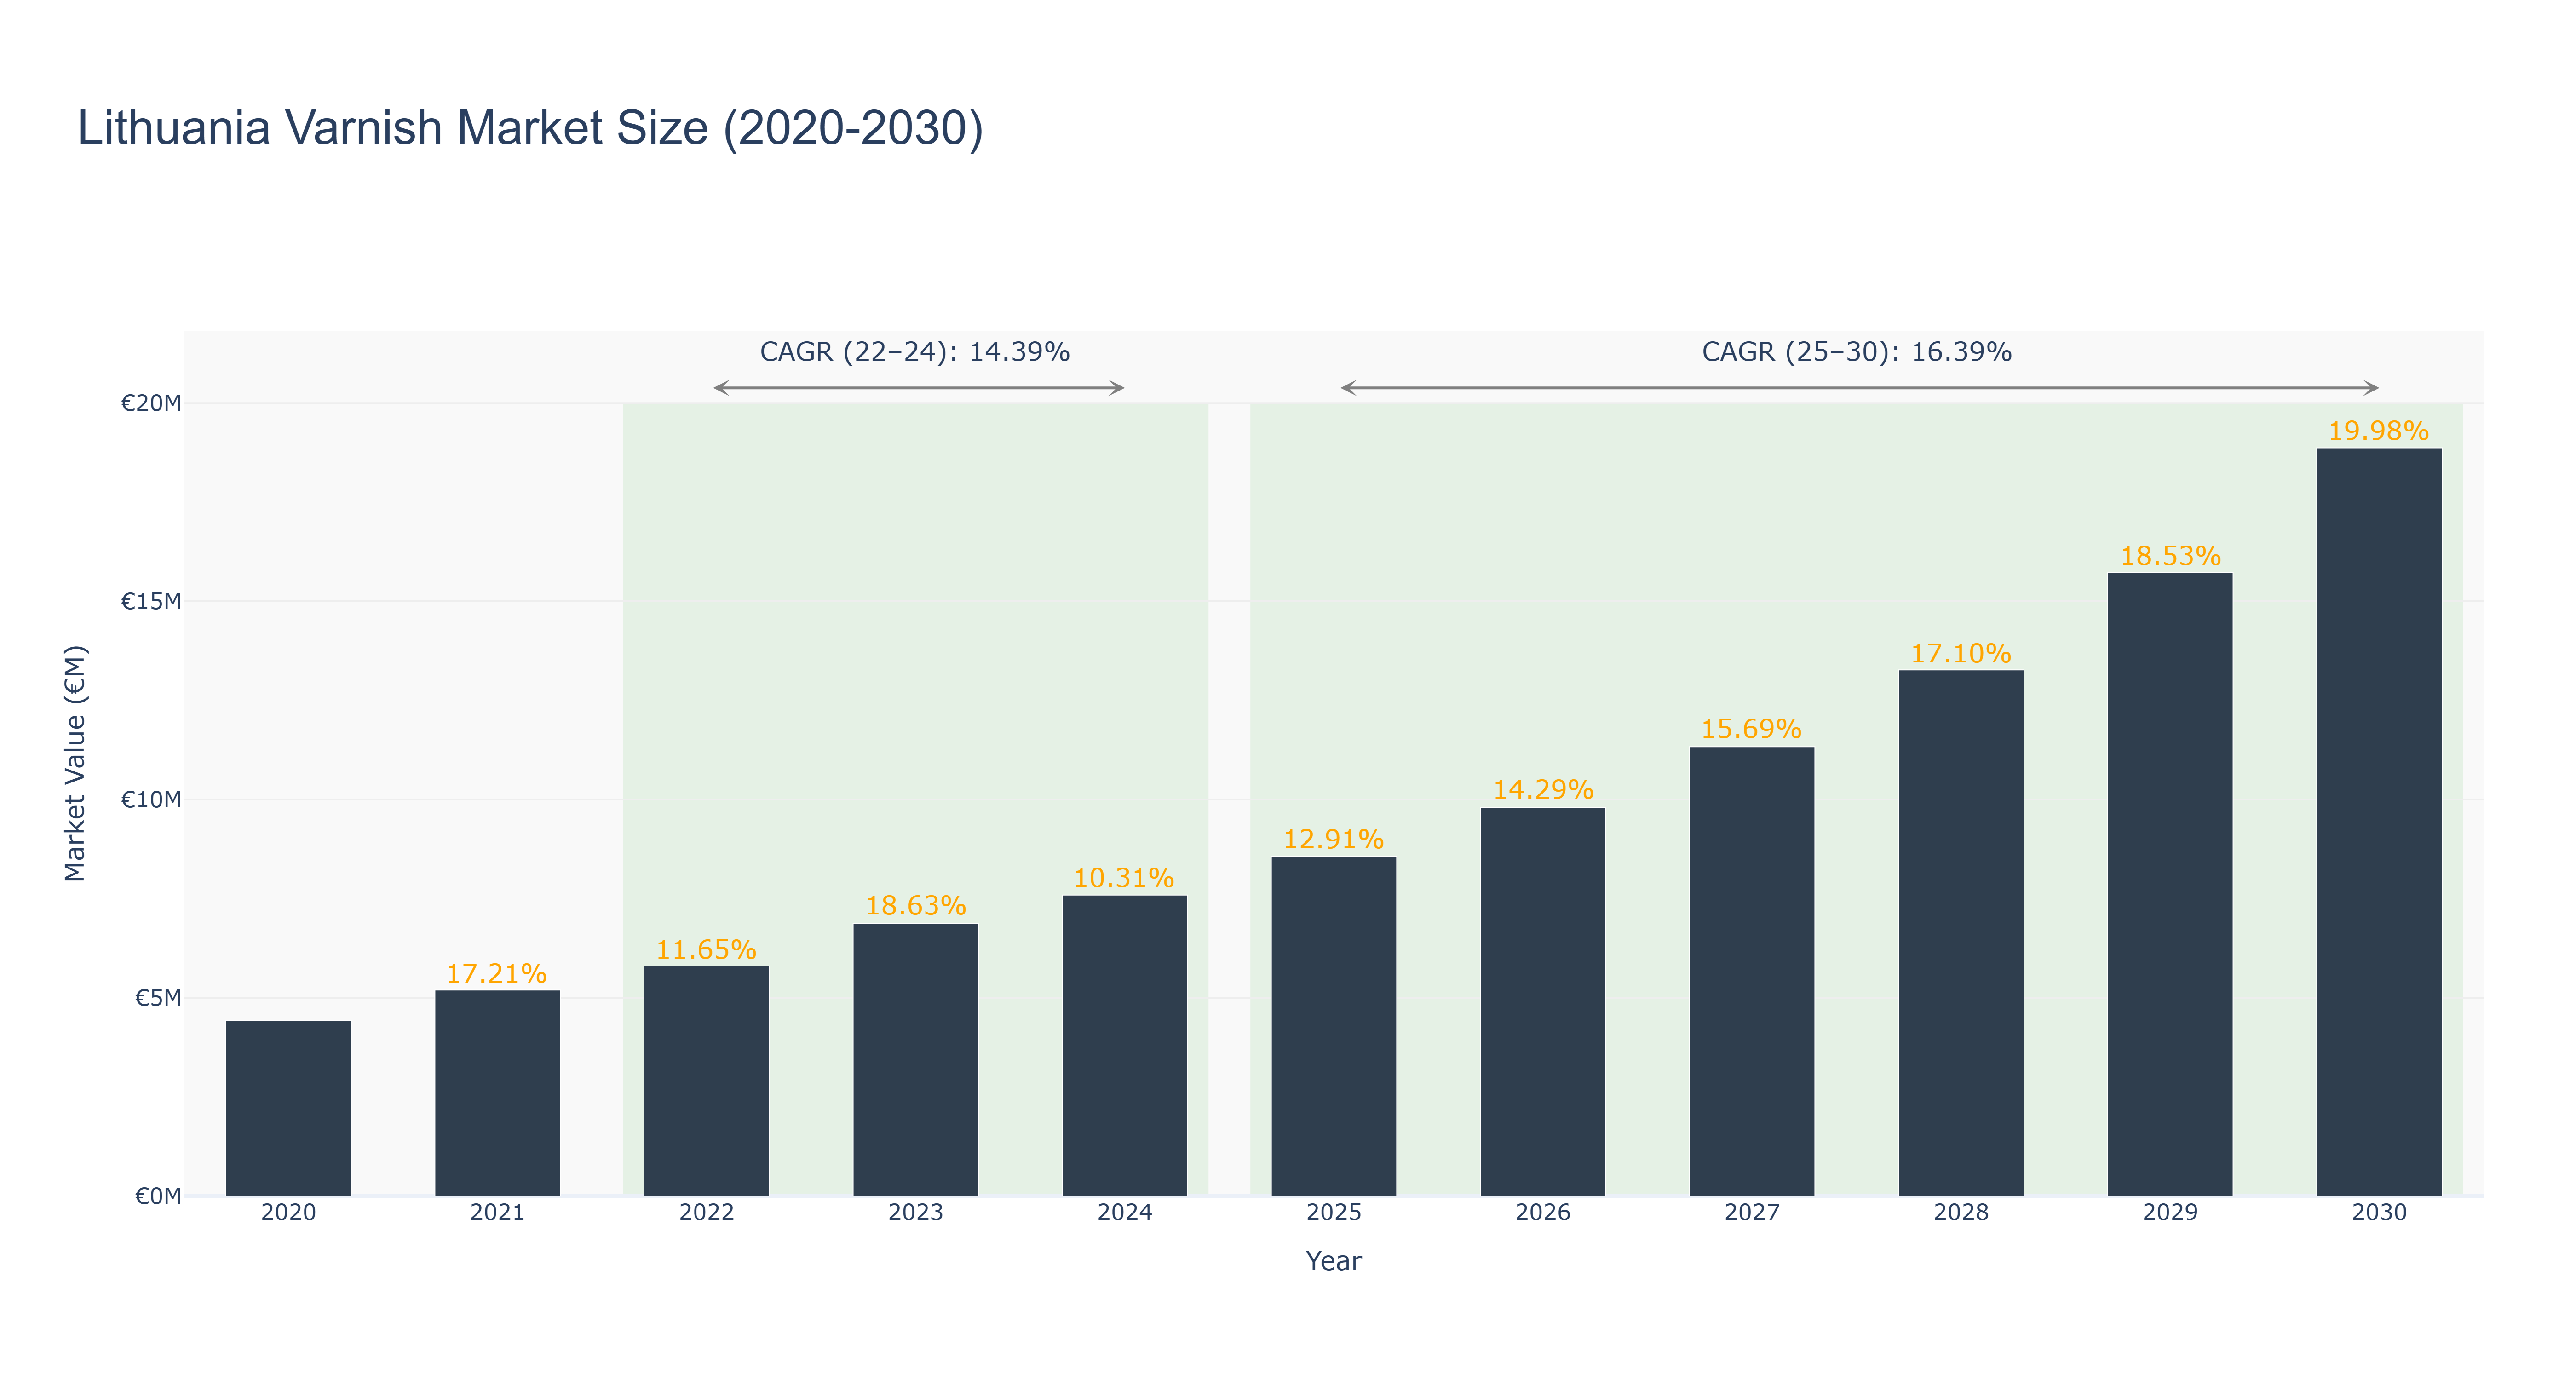
Lithuania Varnish Market has shown a steady growth trajectory over the past decade. The market size peaked at €18.87 million in 2030, with a notable CAGR of 16.39% from 2025 to 2030. From 2020 to 2024, the market size increased consistently, reaching €7.59 million in 2024. The growth can be attributed to increasing demand for varnish products in the industrial and construction sectors, coupled with advancements in technology driving product innovation. Looking ahead, the Lithuania Varnish Market is set to benefit from upcoming infrastructure projects in the country, particularly in the construction and automotive industries. These developments are expected to further boost market growth and create new opportunities for varnish manufacturers. With a strong CAGR forecasted for the coming years, the market is poised for sustained expansion, making it an attractive sector for investors and stakeholders seeking long-term growth prospects.
Lithuania Varnish Market: Production & Trade Performance (2019-2025)
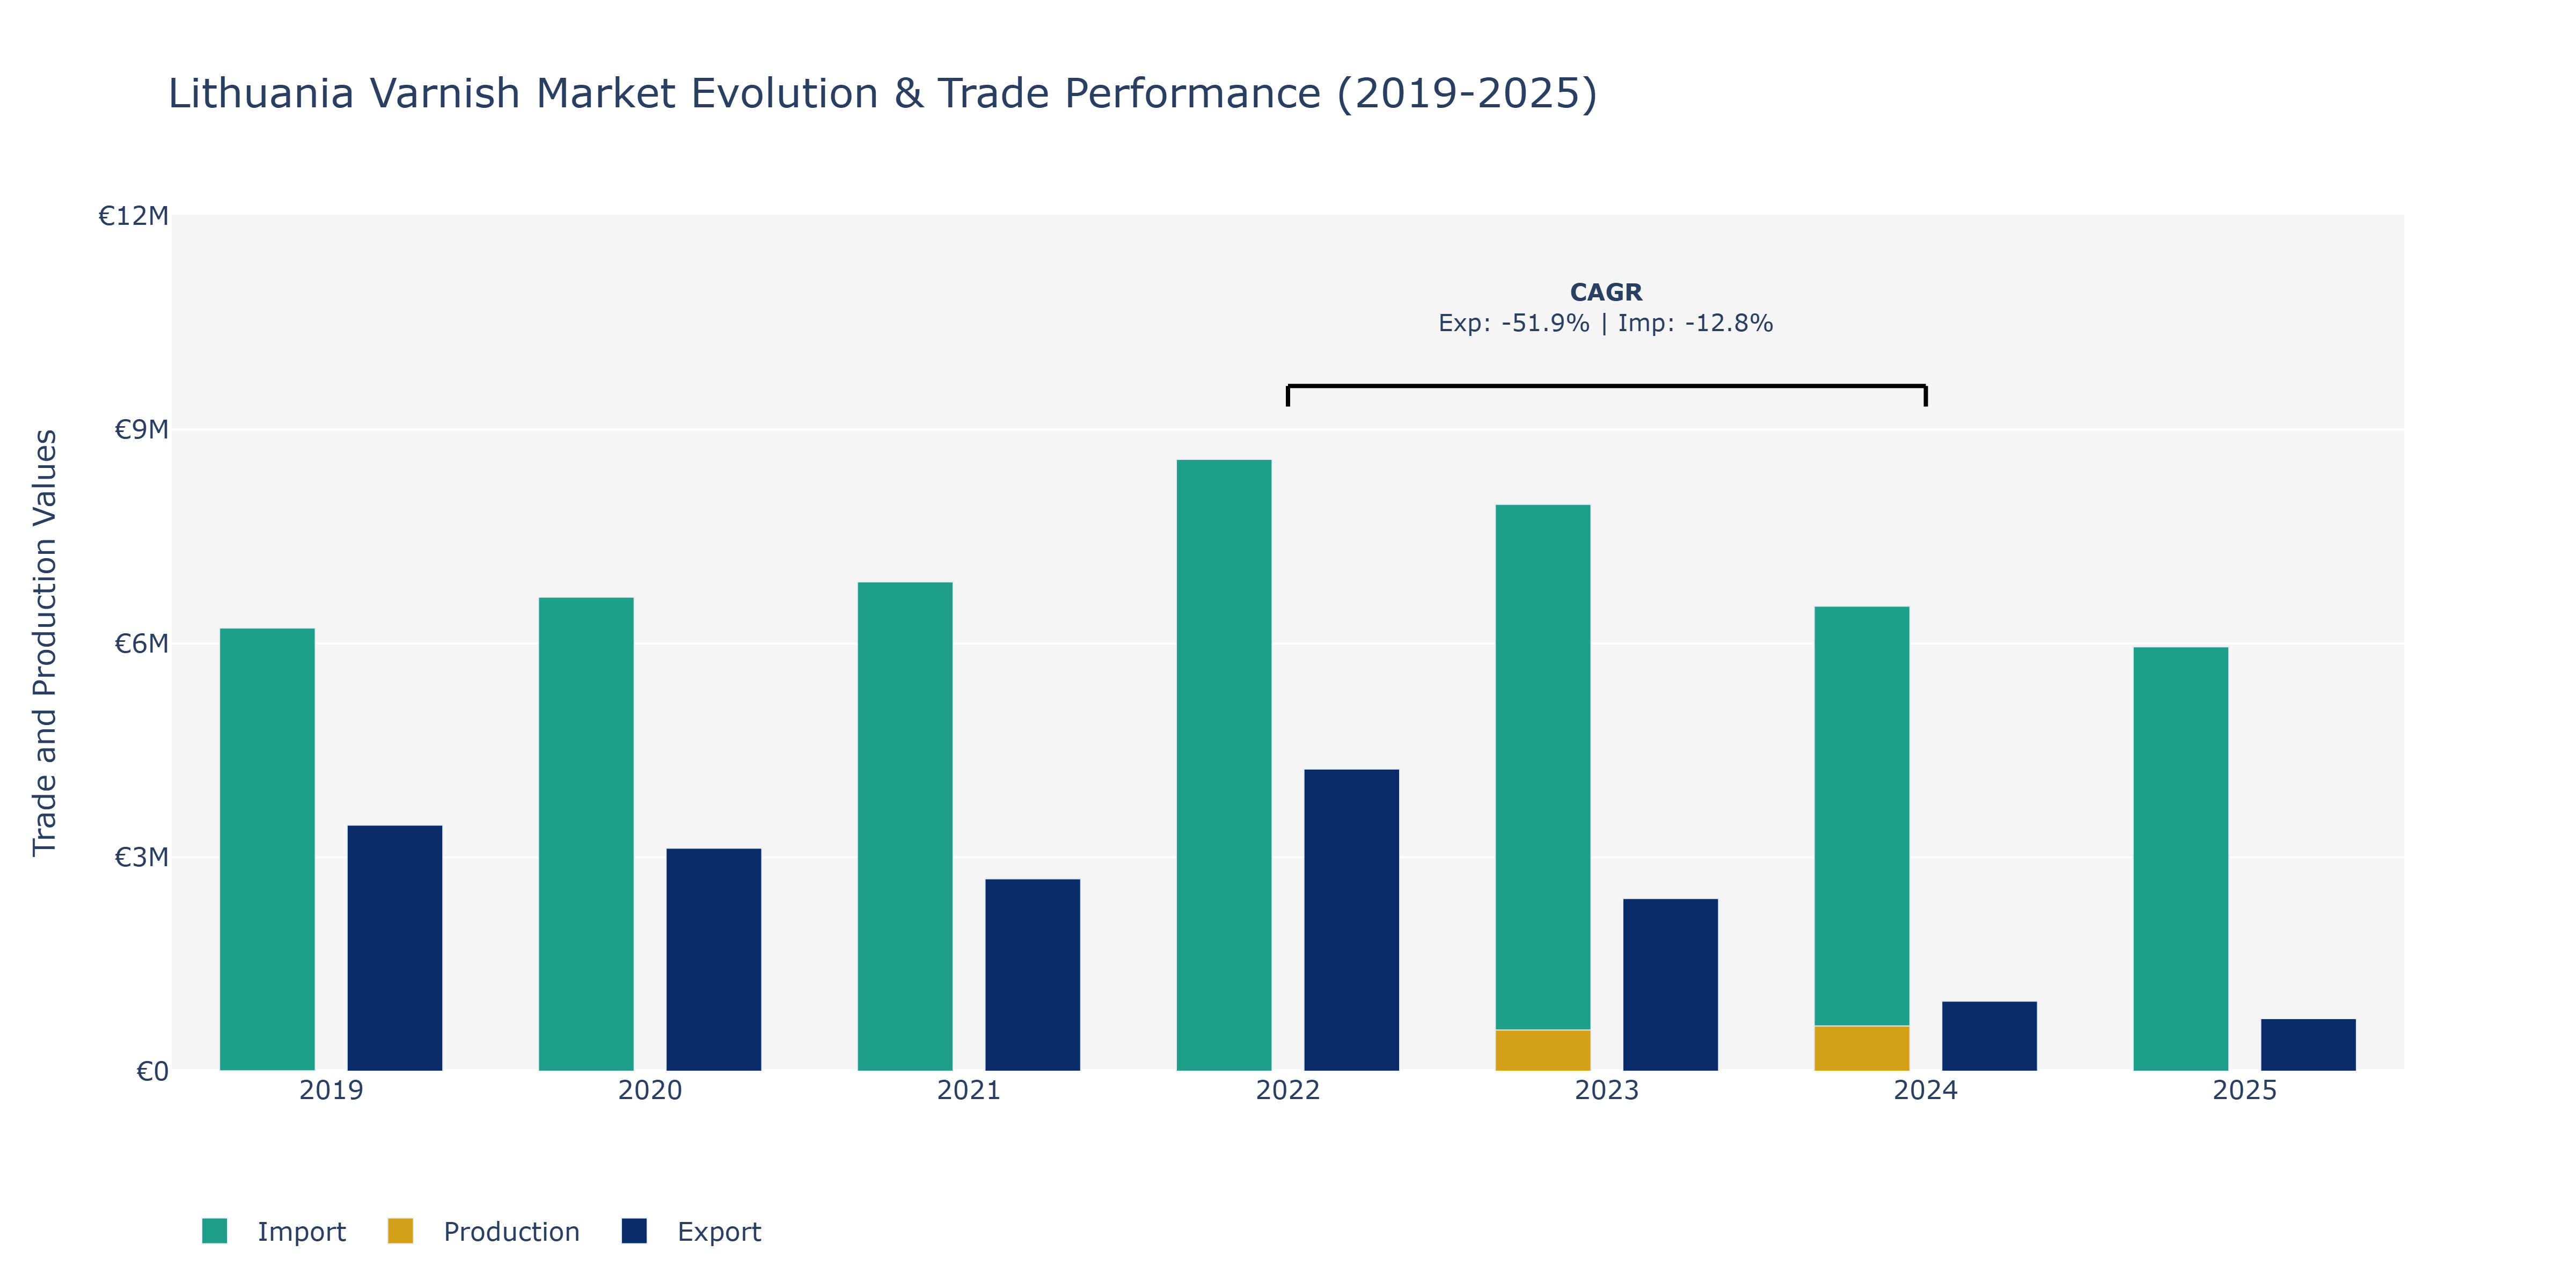
In the Lithuania Varnish Market, exports experienced fluctuations over the years, starting at €3.45 million in 2019, declining to €982.71 thousand in 2024, before showing a slight recovery to €738.76 thousand in 2025. Imports, on the other hand, increased steadily from €6.22 million in 2019 to a peak of €8.58 million in 2022, followed by a slight decrease to €5.95 million in 2025. Production value showed a significant upsurge from €4.79 million in 2019 to €630 million in 2024, indicating a substantial growth in local manufacturing capabilities. These trends could be attributed to various factors such as changes in global demand for varnish products, advancements in production technologies, and shifts in trade agreements impacting import volumes. The decline in exports might suggest increased domestic consumption or challenges in international market competitiveness. To sustain growth, market players could focus on enhancing product quality, exploring new export markets, and investing in innovative production processes.
Key Highlights of the Report:
- Lithuania Varnish Market Outlook
- Market Size of Lithuania Varnish Market, 2025
- Forecast of Lithuania Varnish Market, 2032
- Historical Data and Forecast of Lithuania Varnish Revenues & Volume for the Period 2022 - 2032
- Lithuania Varnish Market Trend Evolution
- Lithuania Varnish Market Drivers and Challenges
- Lithuania Varnish Price Trends
- Lithuania Varnish Porter's Five Forces
- Lithuania Varnish Industry Life Cycle
- Historical Data and Forecast of Lithuania Varnish Market Revenues & Volume By Type for the Period 2022 - 2032
- Historical Data and Forecast of Lithuania Varnish Market Revenues & Volume By UV Curable Overprint Varnishes for the Period 2022 - 2032
- Historical Data and Forecast of Lithuania Varnish Market Revenues & Volume By Water Based Overprint Varnish for the Period 2022 - 2032
- Historical Data and Forecast of Lithuania Varnish Market Revenues & Volume By Application for the Period 2022 - 2032
- Historical Data and Forecast of Lithuania Varnish Market Revenues & Volume By Commercial prints for the Period 2022 - 2032
- Historical Data and Forecast of Lithuania Varnish Market Revenues & Volume By Food Industry for the Period 2022 - 2032
- Historical Data and Forecast of Lithuania Varnish Market Revenues & Volume By Pharmaceuticals for the Period 2022 - 2032
- Historical Data and Forecast of Lithuania Varnish Market Revenues & Volume By Others for the Period 2022 - 2032
- Lithuania Varnish Import Export Trade Statistics
- Market Opportunity Assessment By Type
- Market Opportunity Assessment By Application
- Lithuania Varnish Top Companies Market Share
- Lithuania Varnish Competitive Benchmarking By Technical and Operational Parameters
- Lithuania Varnish Company Profiles
- Lithuania Varnish Key Strategic Recommendations
Frequently Asked Questions About the Market Study (FAQs):
6Wresearch actively monitors the Lithuania Varnish Market and publishes its comprehensive annual report, highlighting emerging trends, growth drivers, revenue analysis, and forecast outlook. Our insights help businesses to make data-backed strategic decisions with ongoing market dynamics. Our analysts track relevent industries related to the Lithuania Varnish Market, allowing our clients with actionable intelligence and reliable forecasts tailored to emerging regional needs.
Yes, we provide customisation as per your requirements. To learn more, feel free to contact us on sales@6wresearch.com
1 Executive Summary |
2 Introduction |
2.1 Key Highlights of the Report |
2.2 Report Description |
2.3 Market Scope & Segmentation |
2.4 Research Methodology |
2.5 Assumptions |
3 Lithuania Varnish Market Overview |
3.1 Lithuania Country Macro Economic Indicators |
3.2 Lithuania Varnish Market Revenues & Volume, 2022 & 2032F |
3.3 Lithuania Varnish Market - Industry Life Cycle |
3.4 Lithuania Varnish Market - Porter's Five Forces |
3.5 Lithuania Varnish Market Revenues & Volume Share, By Type, 2022 & 2032F |
3.6 Lithuania Varnish Market Revenues & Volume Share, By Application, 2022 & 2032F |
4 Lithuania Varnish Market Dynamics |
4.1 Impact Analysis |
4.2 Market Drivers |
4.2.1 Increasing demand for eco-friendly and sustainable varnish products |
4.2.2 Growth in the construction and real estate sectors in Lithuania |
4.2.3 Rise in disposable income leading to higher spending on home improvement and renovation projects |
4.3 Market Restraints |
4.3.1 Fluctuating raw material prices affecting production costs |
4.3.2 Stringent environmental regulations impacting manufacturing processes |
4.3.3 Intense competition from substitute products like paint and coatings |
5 Lithuania Varnish Market Trends |
6 Lithuania Varnish Market, By Types |
6.1 Lithuania Varnish Market, By Type |
6.1.1 Overview and Analysis |
6.1.2 Lithuania Varnish Market Revenues & Volume, By Type, 2022 - 2032F |
6.1.3 Lithuania Varnish Market Revenues & Volume, By UV Curable Overprint Varnishes, 2022 - 2032F |
6.1.4 Lithuania Varnish Market Revenues & Volume, By Water Based Overprint Varnish, 2022 - 2032F |
6.2 Lithuania Varnish Market, By Application |
6.2.1 Overview and Analysis |
6.2.2 Lithuania Varnish Market Revenues & Volume, By Commercial prints, 2022 - 2032F |
6.2.3 Lithuania Varnish Market Revenues & Volume, By Food Industry, 2022 - 2032F |
6.2.4 Lithuania Varnish Market Revenues & Volume, By Pharmaceuticals, 2022 - 2032F |
6.2.5 Lithuania Varnish Market Revenues & Volume, By Others, 2022 - 2032F |
7 Lithuania Varnish Market Import-Export Trade Statistics |
7.1 Lithuania Varnish Market Export to Major Countries |
7.2 Lithuania Varnish Market Imports from Major Countries |
8 Lithuania Varnish Market Key Performance Indicators |
8.1 Number of new eco-friendly varnish products introduced in the market |
8.2 Percentage increase in construction permits issued in Lithuania |
8.3 Average household expenditure on home improvement projects |
9 Lithuania Varnish Market - Opportunity Assessment |
9.1 Lithuania Varnish Market Opportunity Assessment, By Type, 2022 & 2032F |
9.2 Lithuania Varnish Market Opportunity Assessment, By Application, 2022 & 2032F |
10 Lithuania Varnish Market - Competitive Landscape |
10.1 Lithuania Varnish Market Revenue Share, By Companies, 2025 |
10.2 Lithuania Varnish Market Competitive Benchmarking, By Operating and Technical Parameters |
11 Company Profiles |
12 Recommendations |
13 Disclaimer |
Export potential assessment - trade Analytics for 2030
Export potential enables firms to identify high-growth global markets with greater confidence by combining advanced trade intelligence with a structured quantitative methodology. The framework analyzes emerging demand trends and country-level import patterns while integrating macroeconomic and trade datasets such as GDP and population forecasts, bilateral import–export flows, tariff structures, elasticity differentials between developed and developing economies, geographic distance, and import demand projections. Using weighted trade values from 2020–2024 as the base period to project country-to-country export potential for 2030, these inputs are operationalized through calculated drivers such as gravity model parameters, tariff impact factors, and projected GDP per-capita growth. Through an analysis of hidden potentials, demand hotspots, and market conditions that are most favorable to success, this method enables firms to focus on target countries, maximize returns, and global expansion with data, backed by accuracy.
By factoring in the projected importer demand gap that is currently unmet and could be potential opportunity, it identifies the potential for the Exporter (Country) among 190 countries, against the general trade analysis, which identifies the biggest importer or exporter.
To discover high-growth global markets and optimize your business strategy:
Click Here
Pricing
- Single User License$ 1,995
- Department License$ 2,400
- Site License$ 3,120
- Global License$ 3,795

Search
Thought Leadership and Analyst Meet


Our Clients
Latest Reports
- Philippines Polyhydroxybutyrate-co-Hydroxyvalerate Market (2026-2032) | Trends, Insights, Challenges, Restraints, Competition, Size, Value, Forecast, Pricing, Share, Outlook, Revenue, Investment Opportunities, Strategy, Drivers, Demand, Growth, segmentation, Analysis, Companies
- Peru Polyhydroxybutyrate-co-Hydroxyvalerate Market (2026-2032) | Growth, Demand, Challenges, Share, Trends, Analysis, Pricing, Investment Opportunities, Drivers, Value, Forecast, Competition, Size, Companies, Insights, Outlook, Restraints, segmentation, Revenue, Strategy
- Pakistan Polyhydroxybutyrate-co-Hydroxyvalerate Market (2026-2032) | Restraints, segmentation, Pricing, Forecast, Share, Strategy, Competition, Trends, Insights, Drivers, Challenges, Growth, Revenue, Outlook, Value, Investment Opportunities, Companies, Size, Analysis, Demand
- Oman Polyhydroxybutyrate-co-Hydroxyvalerate Market (2026-2032) | Drivers, segmentation, Insights, Competition, Pricing, Outlook, Size, Revenue, Challenges, Forecast, Analysis, Growth, Value, Share, Trends, Investment Opportunities, Strategy, Restraints, Companies, Demand
- Nigeria Polyhydroxybutyrate-co-Hydroxyvalerate Market (2026-2032) | Value, Investment Opportunities, Analysis, Revenue, Restraints, Pricing, Outlook, Competition, Demand, Growth, Forecast, Companies, Trends, Challenges, segmentation, Drivers, Insights, Share, Size, Strategy
- Nepal Polyhydroxybutyrate-co-Hydroxyvalerate Market (2026-2032) | Insights, Analysis, Drivers, Share, Revenue, Demand, segmentation, Investment Opportunities, Competition, Forecast, Growth, Pricing, Companies, Strategy, Trends, Restraints, Challenges, Outlook, Size, Value
- Myanmar Polyhydroxybutyrate-co-Hydroxyvalerate Market (2026-2032) | Outlook, Revenue, Strategy, Restraints, Drivers, segmentation, Share, Forecast, Competition, Insights, Growth, Pricing, Size, Demand, Value, Companies, Trends, Challenges, Investment Opportunities, Analysis
- Morocco Polyhydroxybutyrate-co-Hydroxyvalerate Market (2026-2032) | Outlook, Investment Opportunities, Restraints, Strategy, Forecast, Challenges, Drivers, Growth, Companies, segmentation, Trends, Size, Competition, Revenue, Demand, Insights, Share, Analysis, Value, Pricing
- Mexico Polyhydroxybutyrate-co-Hydroxyvalerate Market (2026-2032) | Size, Drivers, Outlook, Share, Strategy, Growth, Pricing, Challenges, Companies, Demand, Value, Investment Opportunities, Restraints, Trends, Forecast, segmentation, Analysis, Insights, Competition, Revenue
- Malaysia Polyhydroxybutyrate-co-Hydroxyvalerate Market (2026-2032) | Share, segmentation, Size, Companies, Analysis, Insights, Forecast, Value, Revenue, Drivers, Restraints, Challenges, Investment Opportunities, Trends, Competition, Strategy, Demand, Growth, Outlook, Pricing
Industry Events and Analyst Meet

HIMTEX 2026

India Refining Summit 2026

India EV Show 2026

EV tech India Expo 2026

Auto Tech Asia 2026
Whitepaper
- Middle East & Africa Commercial Security Market Click here to view more.
- Middle East & Africa Fire Safety Systems & Equipment Market Click here to view more.
- GCC Drone Market Click here to view more.
- Middle East Lighting Fixture Market Click here to view more.
- GCC Physical & Perimeter Security Market Click here to view more.
6WResearch In News
- Doha a strategic location for EV manufacturing hub: IPA Qatar
- Demand for luxury TVs surging in the GCC, says Samsung
- Empowering Growth: The Thriving Journey of Bangladesh’s Cable Industry
- Demand for luxury TVs surging in the GCC, says Samsung
- Video call with a traditional healer? Once unthinkable, it’s now common in South Africa
- Intelligent Buildings To Smooth GCC’s Path To Net Zero