Lithuania Wax Market (2026-2032) | Growth, Value, Forecast, Revenue, Segmentation, Analysis, Trends, Share, Size, Industry, Companies & Outlook
Market Forecast By Product (Mineral, Synthetic, Natural), By Applications (Candles, Packaging, Plastic & Rubber, Cosmetics & Toiletries, Fire Logs, Adhesives, Others) And Competitive Landscape
| Product Code: ETC5822780 | Publication Date: Nov 2023 | Updated Date: Apr 2026 | Product Type: Market Research Report | |
| Publisher: 6Wresearch | Author: Ravi Bhandari | No. of Pages: 60 | No. of Figures: 30 | No. of Tables: 5 |
Lithuania Wax Market Size (2020-2030)
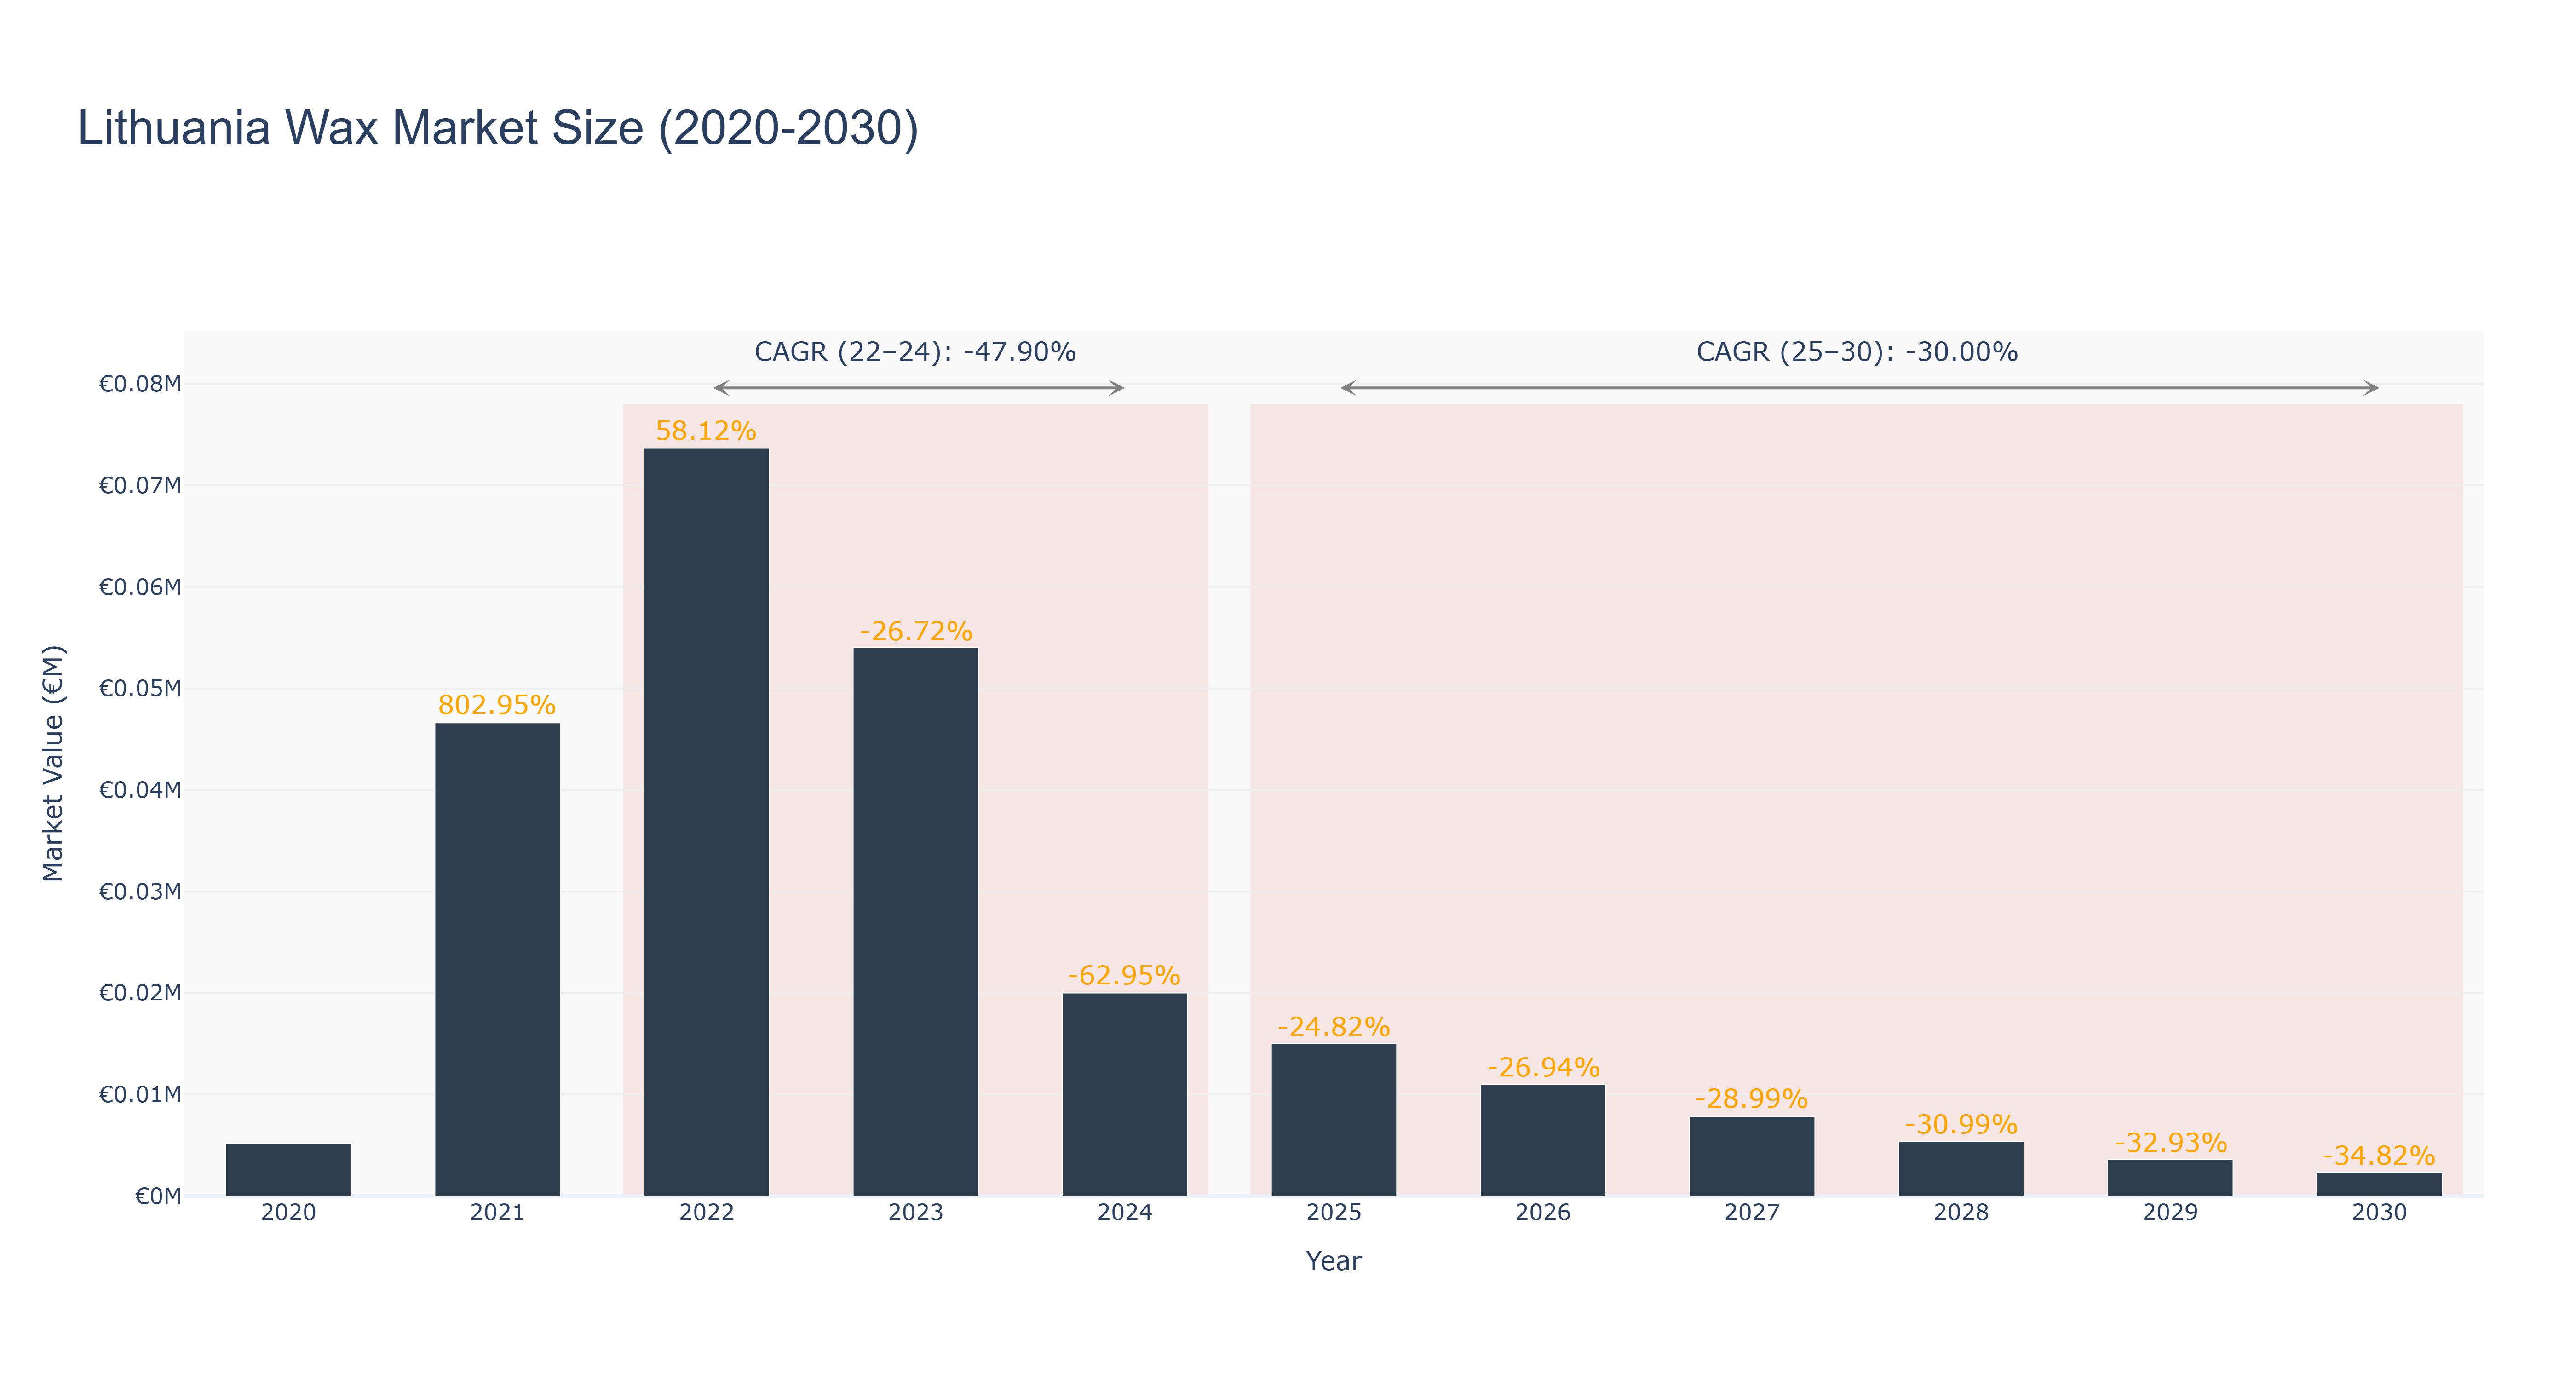
The Lithuania Wax Market has experienced significant volatility, with a remarkable peak in market size recorded in 2021 at €46.61 thousand, following a substantial growth rate of 802.95% from 2020. However, the market has since declined, with actual sizes of €73.70 thousand in 2022 and €54.01 thousand in 2023, leading to a negative growth trajectory of -26.72% in 2023 and a steep drop to €20.01 thousand in 2024. The compound annual growth rate (CAGR) for the actual period from 2022 to 2024 stands at -47.90%. Looking ahead, the forecasted values from 2025 to 2030 suggest continued contraction, with sizes projected to decrease to €2.35 thousand by 2030, reflecting a CAGR of -30.00%. This decline may be attributed to shifting consumer preferences, increased competition from alternative products, and economic pressures. Without significant innovation or market revitalization efforts, the Lithuania Wax Market faces ongoing challenges in regaining its former growth trajectory.
Lithuania Wax Market: Production & Trade Performance (2019-2025)
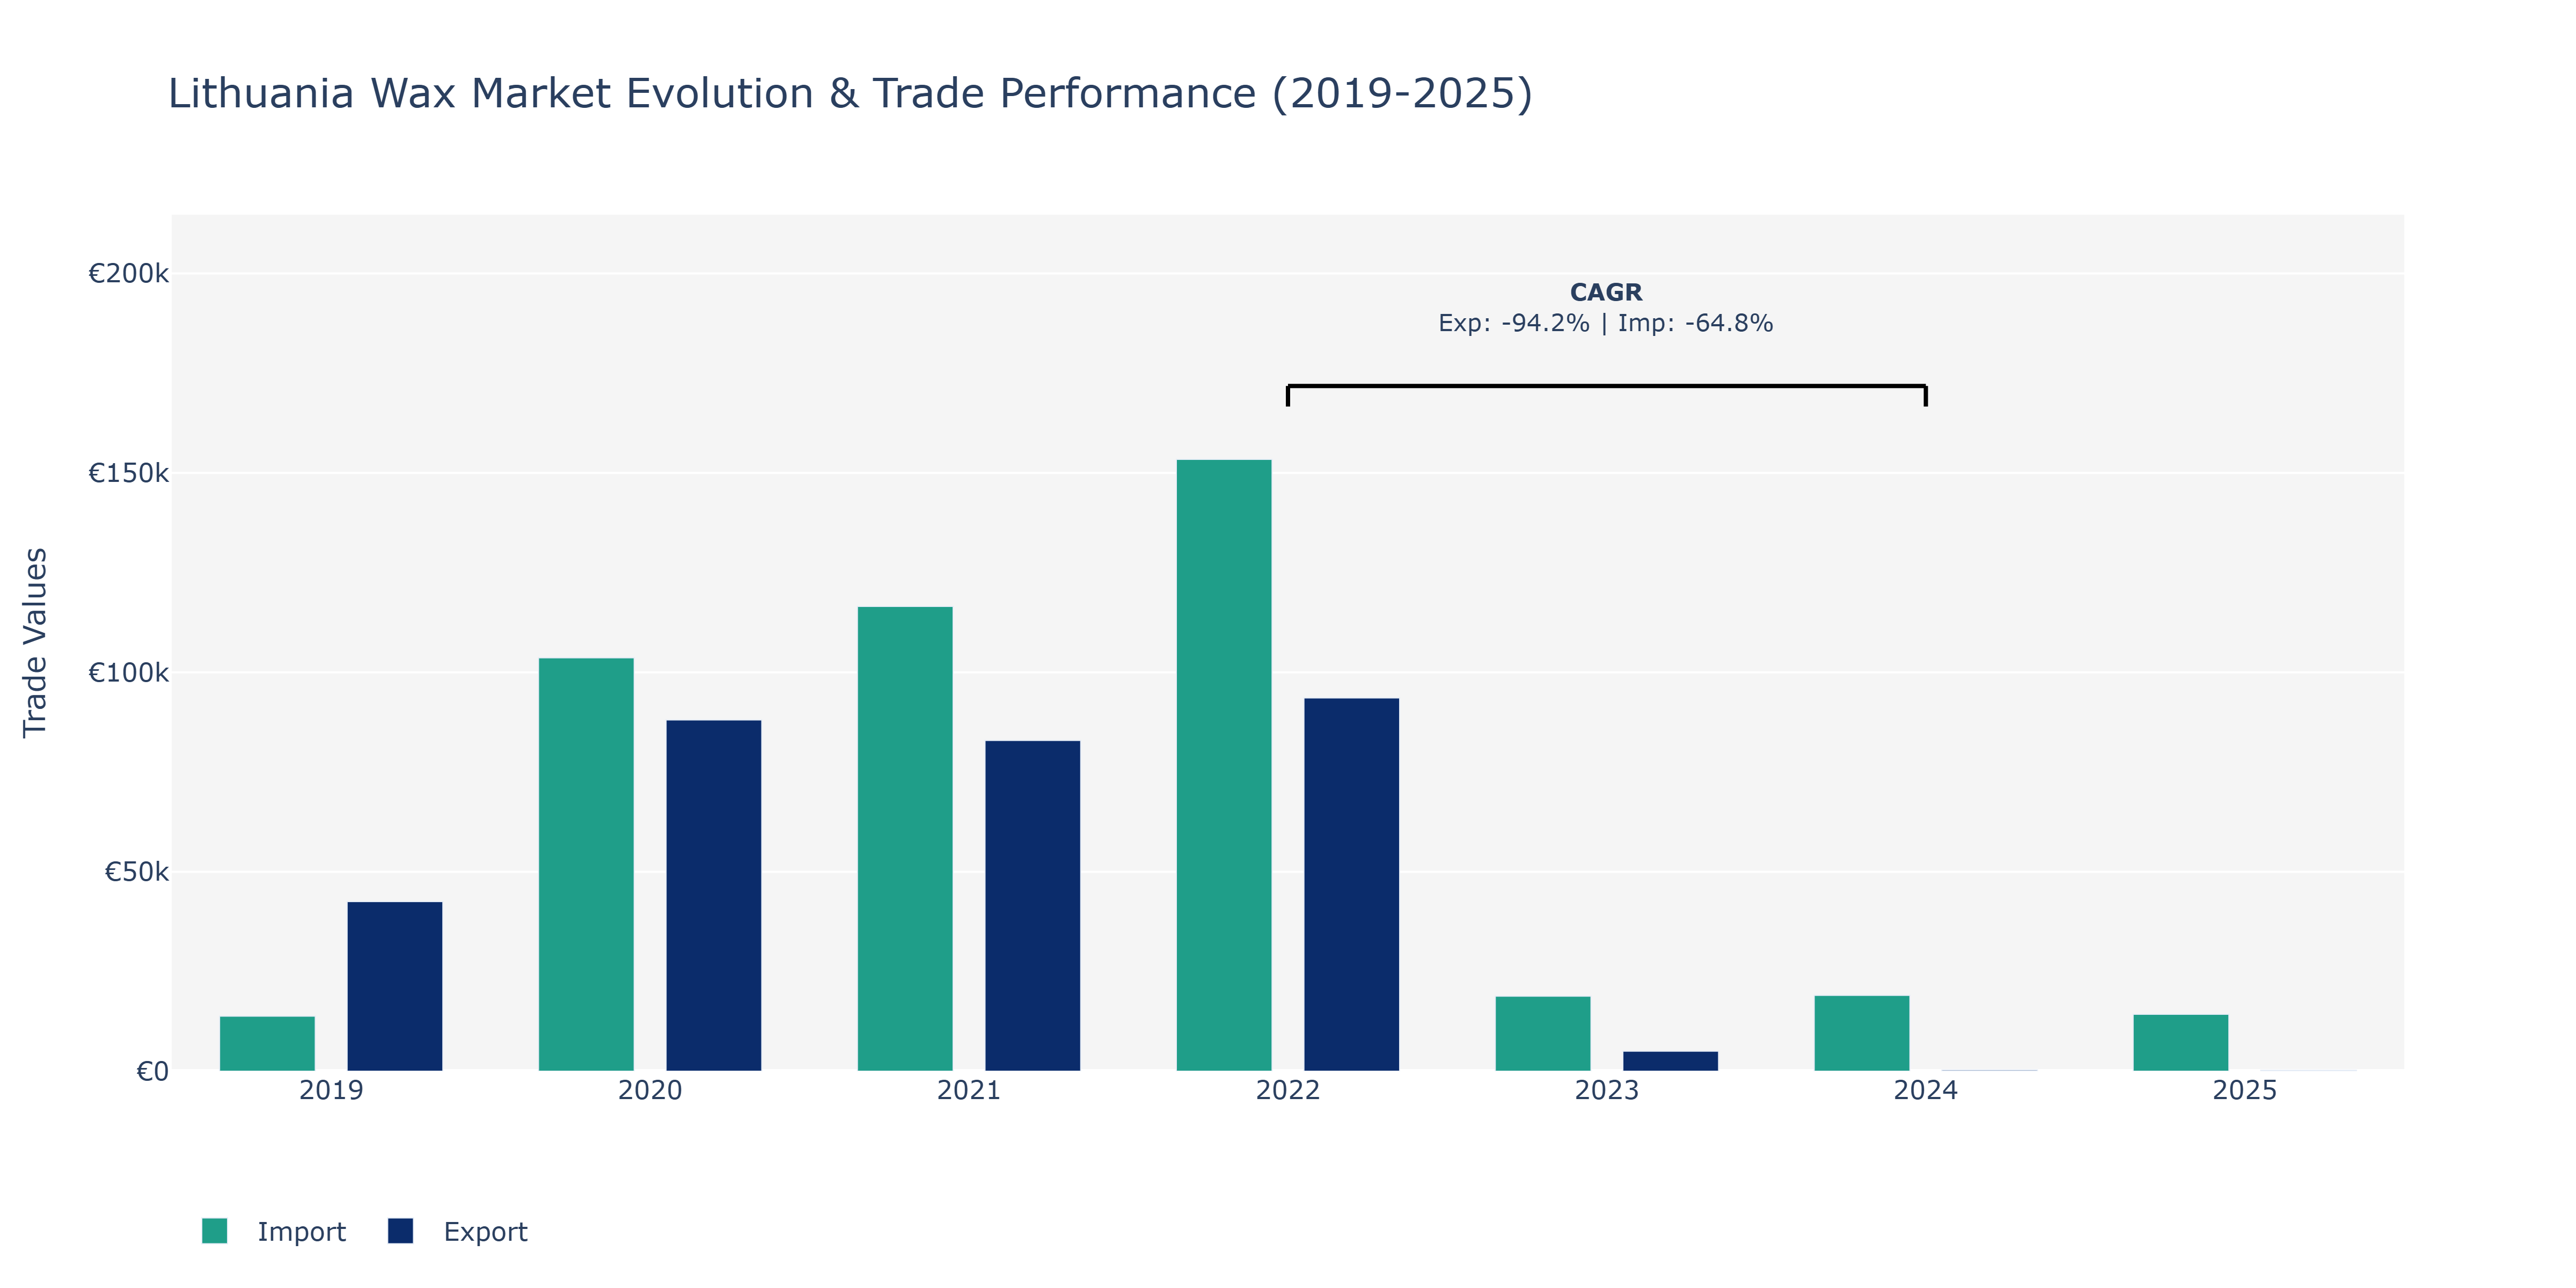
Between 2019 and 2025, Lithuania's Wax Market showed varying trends in exports and imports. In 2019, exports stood at €42.52 thousand, increasing notably in 2020 to €88.08 thousand before decreasing in 2021 to €82.91 thousand. Despite a slight recovery in 2022 to €93.59 thousand, a significant drop was observed in 2023 to €5.03 thousand, reaching its lowest point in 2024 at €0.31 thousand. The year 2025 saw a partial recovery to €233.05 thousand. Imports also fluctuated during this period, starting at €13.78 thousand in 2019, peaking in 2022 at €153.39 thousand, and then decreasing to €14.28 thousand in 2025. The market faced challenges such as global economic uncertainties impacting trade flows, shifting consumer preferences towards eco-friendly products, and changing regulatory environments affecting the wax industry. To adapt, Lithuanian wax exporters may consider diversifying their product offerings to align with sustainable trends, while importers could focus on optimizing supply chains to mitigate risks associated with global disruptions.
Key Highlights of the Report:
- Lithuania Wax Market Outlook
- Market Size of Lithuania Wax Market, 2025
- Forecast of Lithuania Wax Market, 2032
- Historical Data and Forecast of Lithuania Wax Revenues & Volume for the Period 2022 - 2032F
- Lithuania Wax Market Trend Evolution
- Lithuania Wax Market Drivers and Challenges
- Lithuania Wax Price Trends
- Lithuania Wax Porter`s Five Forces
- Lithuania Wax Industry Life Cycle
- Historical Data and Forecast of Lithuania Wax Market Revenues & Volume By Product for the Period 2022 - 2032F
- Historical Data and Forecast of Lithuania Wax Market Revenues & Volume By Mineral for the Period 2022 - 2032F
- Historical Data and Forecast of Lithuania Wax Market Revenues & Volume By Synthetic for the Period 2022 - 2032F
- Historical Data and Forecast of Lithuania Wax Market Revenues & Volume By Natural for the Period 2022 - 2032F
- Historical Data and Forecast of Lithuania Wax Market Revenues & Volume By Applications for the Period 2022 - 2032F
- Historical Data and Forecast of Lithuania Wax Market Revenues & Volume By Candles for the Period 2022 - 2032F
- Historical Data and Forecast of Lithuania Wax Market Revenues & Volume By Packaging for the Period 2022 - 2032F
- Historical Data and Forecast of Lithuania Wax Market Revenues & Volume By Plastic & Rubber for the Period 2022 - 2032F
- Historical Data and Forecast of Lithuania Wax Market Revenues & Volume By Cosmetics & Toiletries for the Period 2022 - 2032F
- Historical Data and Forecast of Lithuania Wax Market Revenues & Volume By Fire Logs for the Period 2022 - 2032F
- Historical Data and Forecast of Lithuania Wax Market Revenues & Volume By Adhesives for the Period 2022 - 2032F
- Historical Data and Forecast of Lithuania Wax Market Revenues & Volume By Others for the Period 2022 - 2032F
- Lithuania Wax Import Export Trade Statistics
- Market Opportunity Assessment By Product
- Market Opportunity Assessment By Applications
- Lithuania Wax Top Companies Market Share
- Lithuania Wax Competitive Benchmarking By Technical and Operational Parameters
- Lithuania Wax Company Profiles
- Lithuania Wax Key Strategic Recommendations
Frequently Asked Questions About the Market Study (FAQs):
6Wresearch actively monitors the Lithuania Wax Market and publishes its comprehensive annual report, highlighting emerging trends, growth drivers, revenue analysis, and forecast outlook. Our insights help businesses to make data-backed strategic decisions with ongoing market dynamics. Our analysts track relevent industries related to the Lithuania Wax Market, allowing our clients with actionable intelligence and reliable forecasts tailored to emerging regional needs.
Yes, we provide customisation as per your requirements. To learn more, feel free to contact us on sales@6wresearch.com
1 Executive Summary |
2 Introduction |
2.1 Key Highlights of the Report |
2.2 Report Description |
2.3 Market Scope & Segmentation |
2.4 Research Methodology |
2.5 Assumptions |
3 Lithuania Wax Market Overview |
3.1 Lithuania Country Macro Economic Indicators |
3.2 Lithuania Wax Market Revenues & Volume, 2022 & 2032F |
3.3 Lithuania Wax Market - Industry Life Cycle |
3.4 Lithuania Wax Market - Porter's Five Forces |
3.5 Lithuania Wax Market Revenues & Volume Share, By Product, 2022 & 2032F |
3.6 Lithuania Wax Market Revenues & Volume Share, By Applications, 2022 & 2032F |
4 Lithuania Wax Market Dynamics |
4.1 Impact Analysis |
4.2 Market Drivers |
4.2.1 Increasing demand for natural and organic wax products in Lithuania |
4.2.2 Growing awareness about the benefits of using wax products over synthetic alternatives |
4.2.3 Rising disposable income leading to higher spending on personal care and beauty products |
4.3 Market Restraints |
4.3.1 Fluctuating prices of raw materials impacting the production cost of wax products |
4.3.2 Stringent regulations and compliance requirements in the wax industry |
4.3.3 Competition from alternative hair removal methods such as laser treatments |
5 Lithuania Wax Market Trends |
6 Lithuania Wax Market Segmentations |
6.1 Lithuania Wax Market, By Product |
6.1.1 Overview and Analysis |
6.1.2 Lithuania Wax Market Revenues & Volume, By Mineral, 2022 - 2032F |
6.1.3 Lithuania Wax Market Revenues & Volume, By Synthetic, 2022 - 2032F |
6.1.4 Lithuania Wax Market Revenues & Volume, By Natural, 2022 - 2032F |
6.2 Lithuania Wax Market, By Applications |
6.2.1 Overview and Analysis |
6.2.2 Lithuania Wax Market Revenues & Volume, By Candles, 2022 - 2032F |
6.2.3 Lithuania Wax Market Revenues & Volume, By Packaging, 2022 - 2032F |
6.2.4 Lithuania Wax Market Revenues & Volume, By Plastic & Rubber, 2022 - 2032F |
6.2.5 Lithuania Wax Market Revenues & Volume, By Cosmetics & Toiletries, 2022 - 2032F |
6.2.6 Lithuania Wax Market Revenues & Volume, By Fire Logs, 2022 - 2032F |
6.2.7 Lithuania Wax Market Revenues & Volume, By Adhesives, 2022 - 2032F |
7 Lithuania Wax Market Import-Export Trade Statistics |
7.1 Lithuania Wax Market Export to Major Countries |
7.2 Lithuania Wax Market Imports from Major Countries |
8 Lithuania Wax Market Key Performance Indicators |
8.1 Percentage of consumers opting for natural wax products over synthetic alternatives |
8.2 Average spending on wax products per capita in Lithuania |
8.3 Number of new product launches in the wax market with natural and organic claims |
9 Lithuania Wax Market - Opportunity Assessment |
9.1 Lithuania Wax Market Opportunity Assessment, By Product, 2022 & 2032F |
9.2 Lithuania Wax Market Opportunity Assessment, By Applications, 2022 & 2032F |
10 Lithuania Wax Market - Competitive Landscape |
10.1 Lithuania Wax Market Revenue Share, By Companies, 2025 |
10.2 Lithuania Wax Market Competitive Benchmarking, By Operating and Technical Parameters |
11 Company Profiles |
12 Recommendations | 13 Disclaimer |
Global Go To Market Strategy - 2030
Export potential enables firms to identify high-growth global markets with greater confidence by combining advanced trade intelligence with a structured quantitative methodology. The framework analyzes emerging demand trends and country-level import patterns while integrating macroeconomic and trade datasets such as GDP and population forecasts, bilateral import–export flows, tariff structures, elasticity differentials between developed and developing economies, geographic distance, and import demand projections. Using weighted trade values from 2020–2024 as the base period to project country-to-country export potential for 2030, these inputs are operationalized through calculated drivers such as gravity model parameters, tariff impact factors, and projected GDP per-capita growth. Through an analysis of hidden potentials, demand hotspots, and market conditions that are most favorable to success, this method enables firms to focus on target countries, maximize returns, and global expansion with data, backed by accuracy.
By factoring in the projected importer demand gap that is currently unmet and could be potential opportunity, it identifies the potential for the Exporter (Country) among 190 countries, against the general trade analysis, which identifies the biggest importer or exporter.
To discover high-growth global markets and optimize your business strategy:
Click Here
Pricing
- Single User License$ 1,995
- Department License$ 2,400
- Site License$ 3,120
- Global License$ 3,795

Leadership Perspectives from Industry Events
Search
Thought Leadership and Analyst Meet


Our Clients
6WResearch In News
- Doha a strategic location for EV manufacturing hub: IPA Qatar
- Demand for luxury TVs surging in the GCC, says Samsung
- Empowering Growth: The Thriving Journey of Bangladesh’s Cable Industry
- Demand for luxury TVs surging in the GCC, says Samsung
- Video call with a traditional healer? Once unthinkable, it’s now common in South Africa
- Intelligent Buildings To Smooth GCC’s Path To Net Zero
Latest Reports
- Taiwan Airport Wireless Infrastructure Market (2026-2032)
- Vietnam Airport Wireless Infrastructure Market (2026-2032)
- Thailand Airport Wireless Infrastructure Market (2026-2032)
- South Korea Airport Wireless Infrastructure Market (2026-2032)
- Romania Airport Wireless Infrastructure Market (2026-2032)
- Qatar Airport Wireless Infrastructure Market (2026-2032)
- Philippines Airport Wireless Infrastructure Market (2026-2032)
- Japan Airport Wireless Infrastructure Market (2026-2032)
- Taiwan Airport Winter Services Market (2026-2032)
- Vietnam Airport Winter Services Market (2026-2032)
Industry Events and Analyst Meet

HIMTEX 2026

India Refining Summit 2026

India EV Show 2026

EV tech India Expo 2026

Auto Tech Asia 2026
Whitepaper
- Middle East & Africa Commercial Security Market Click here to view more.
- Middle East & Africa Fire Safety Systems & Equipment Market Click here to view more.
- GCC Drone Market Click here to view more.
- Middle East Lighting Fixture Market Click here to view more.
- GCC Physical & Perimeter Security Market Click here to view more.