Luxembourg High Voltage Direct Current Cables Market (2026-2032) | Competitive Landscape, Outlook, Segmentation, Size & Revenue, Forecast, Trends, Analysis, Growth, Value, Industry, Companies, Share
Market Forecast By Location of Deployment (Underground, Submarine, Overhead) And Competitive Landscape
| Product Code: ETC8064390 | Publication Date: Sep 2024 | Updated Date: Apr 2026 | Product Type: Market Research Report | |
| Publisher: 6Wresearch | Author: Dhaval Chaurasia | No. of Pages: 75 | No. of Figures: 35 | No. of Tables: 20 |
Luxembourg High Voltage Direct Current Cables Market Size (2020-2030)
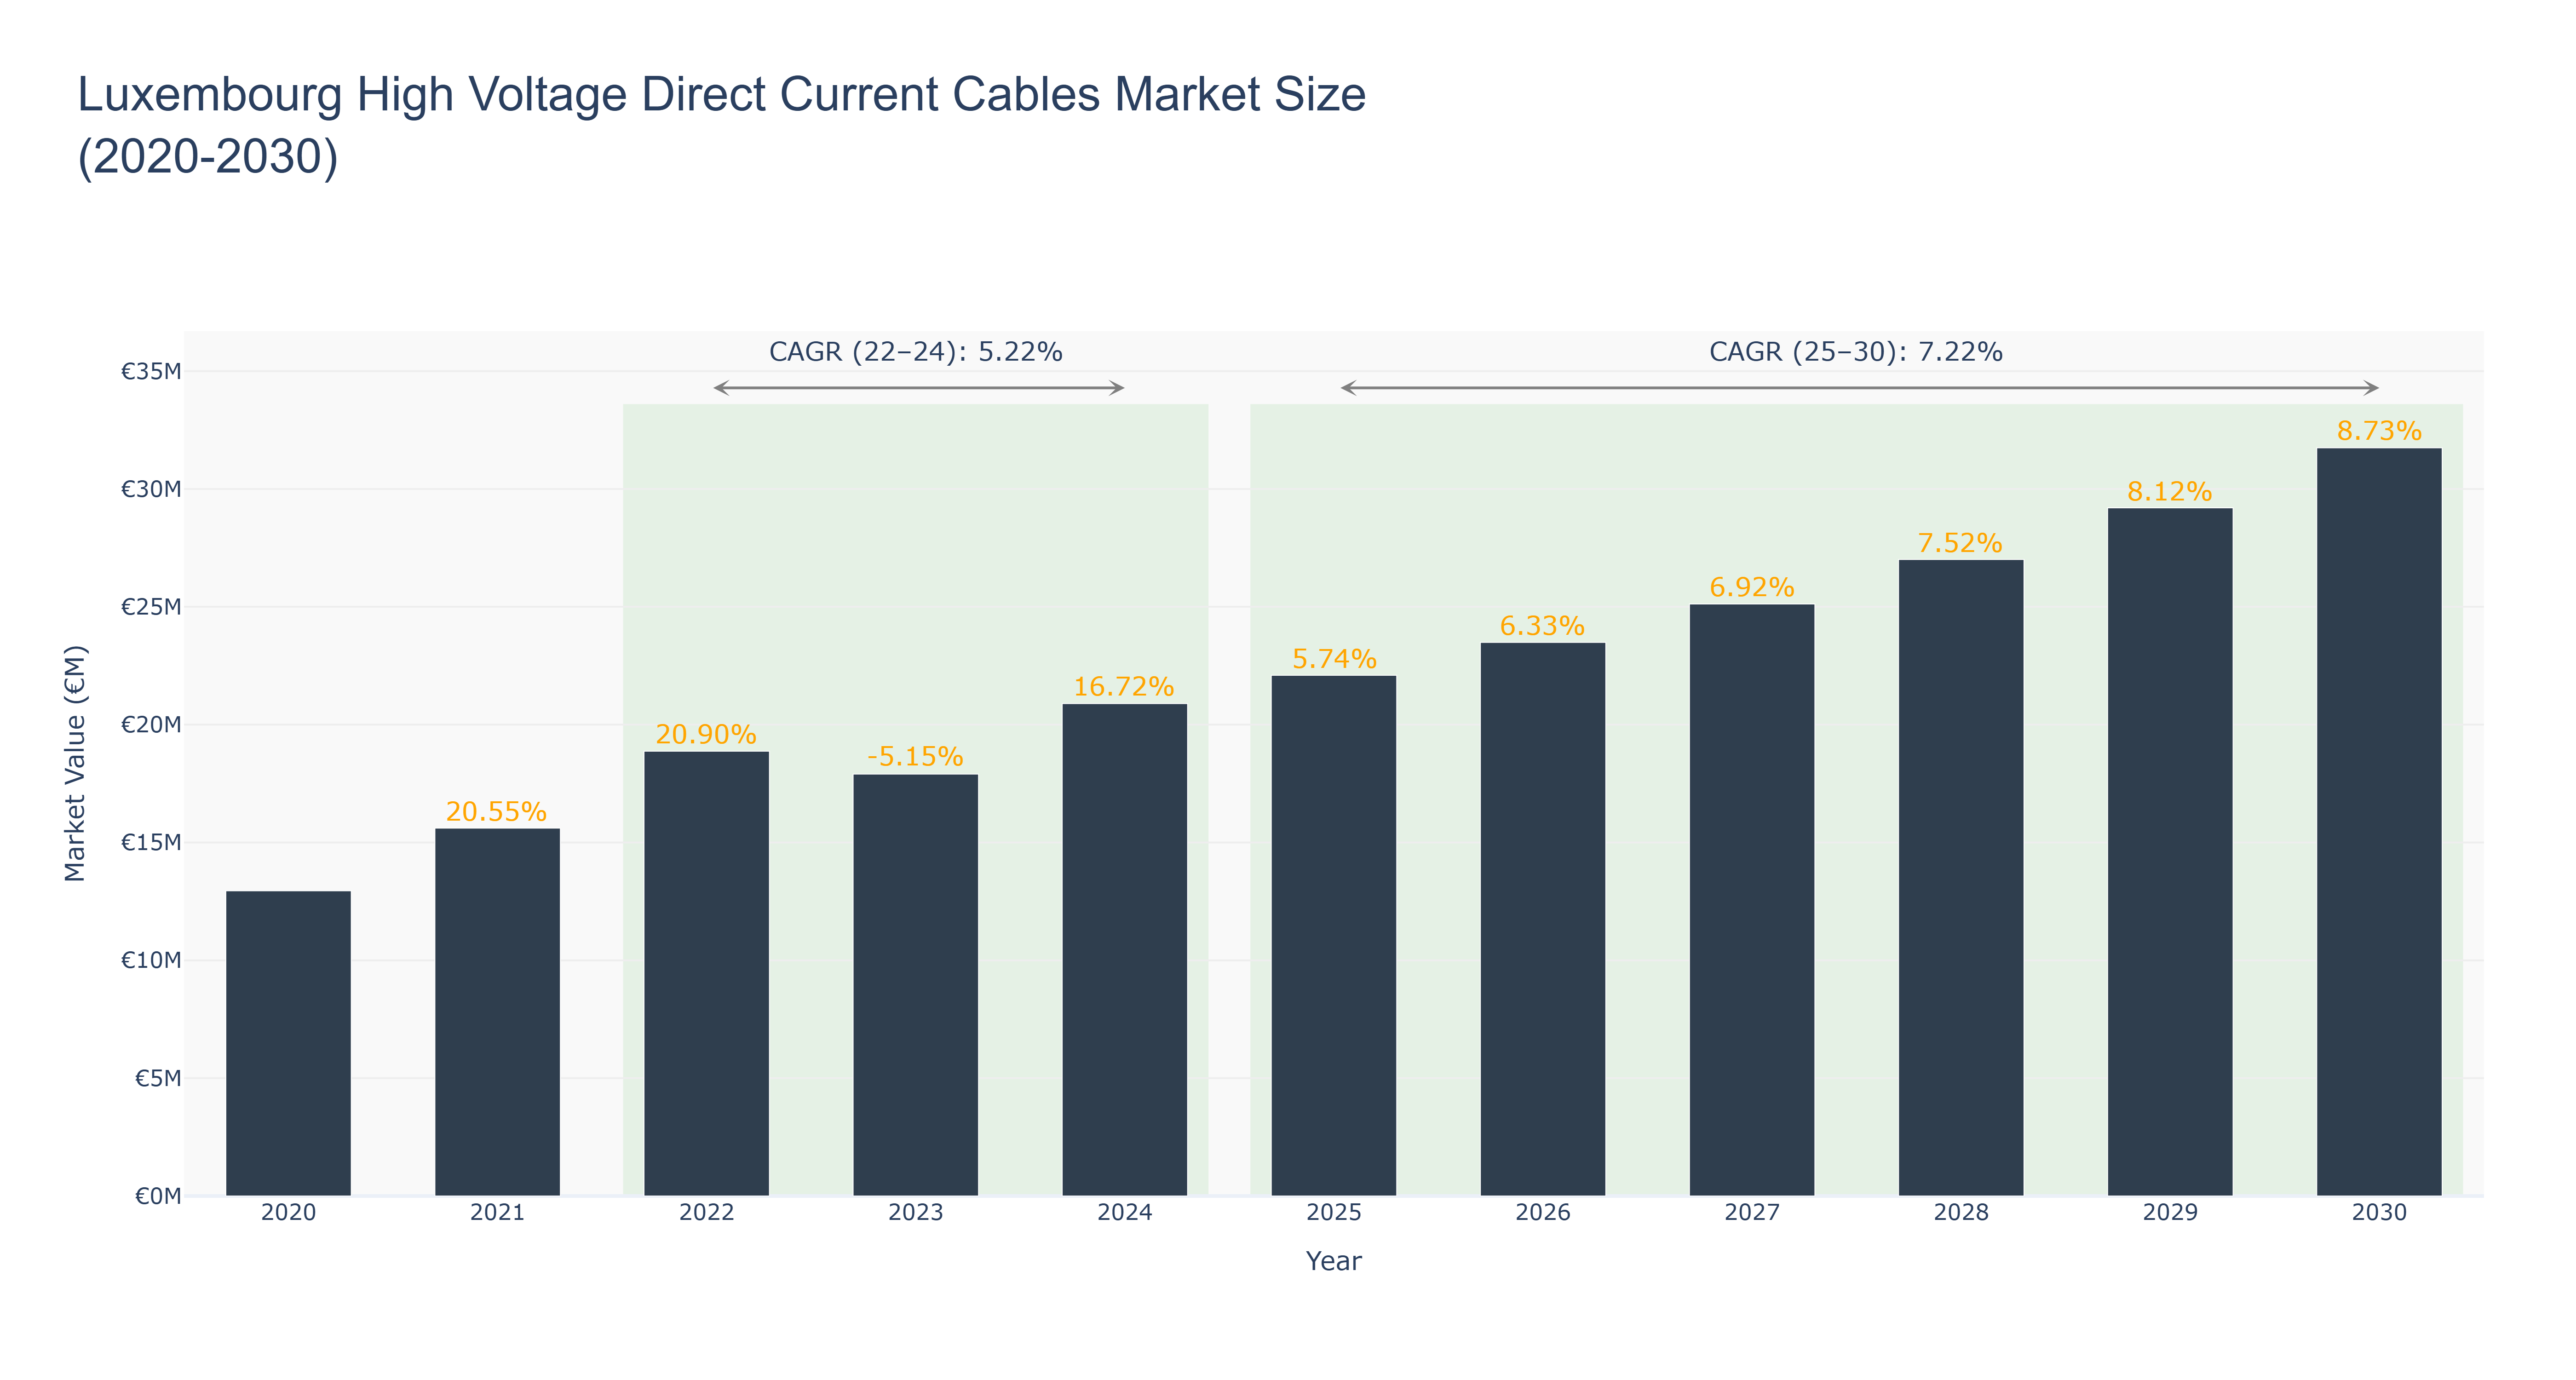
Luxembourg High Voltage Direct Current Cables Market has shown a steady growth trajectory over the years. The peak market size of €31.75 million in 2030 reflects the market's robust expansion. From 2020 to 2024, the market size increased consistently, with notable values of €20.90 million in 2024. However, a slight decline was observed in 2023, possibly due to external economic factors impacting demand. Looking ahead, the forecasted market size is expected to reach €31.75 million by 2030, with a CAGR of 7.22% from 2025 to 2030. The industry drivers fueling this growth include increasing demand for efficient energy transmission solutions. In the near future, Luxembourg is planning to invest in upgrading its energy infrastructure, presenting opportunities for further market expansion in the high voltage direct current cables sector.
Luxembourg High Voltage Direct Current Cables Market: Production & Trade Performance (2019-2025)
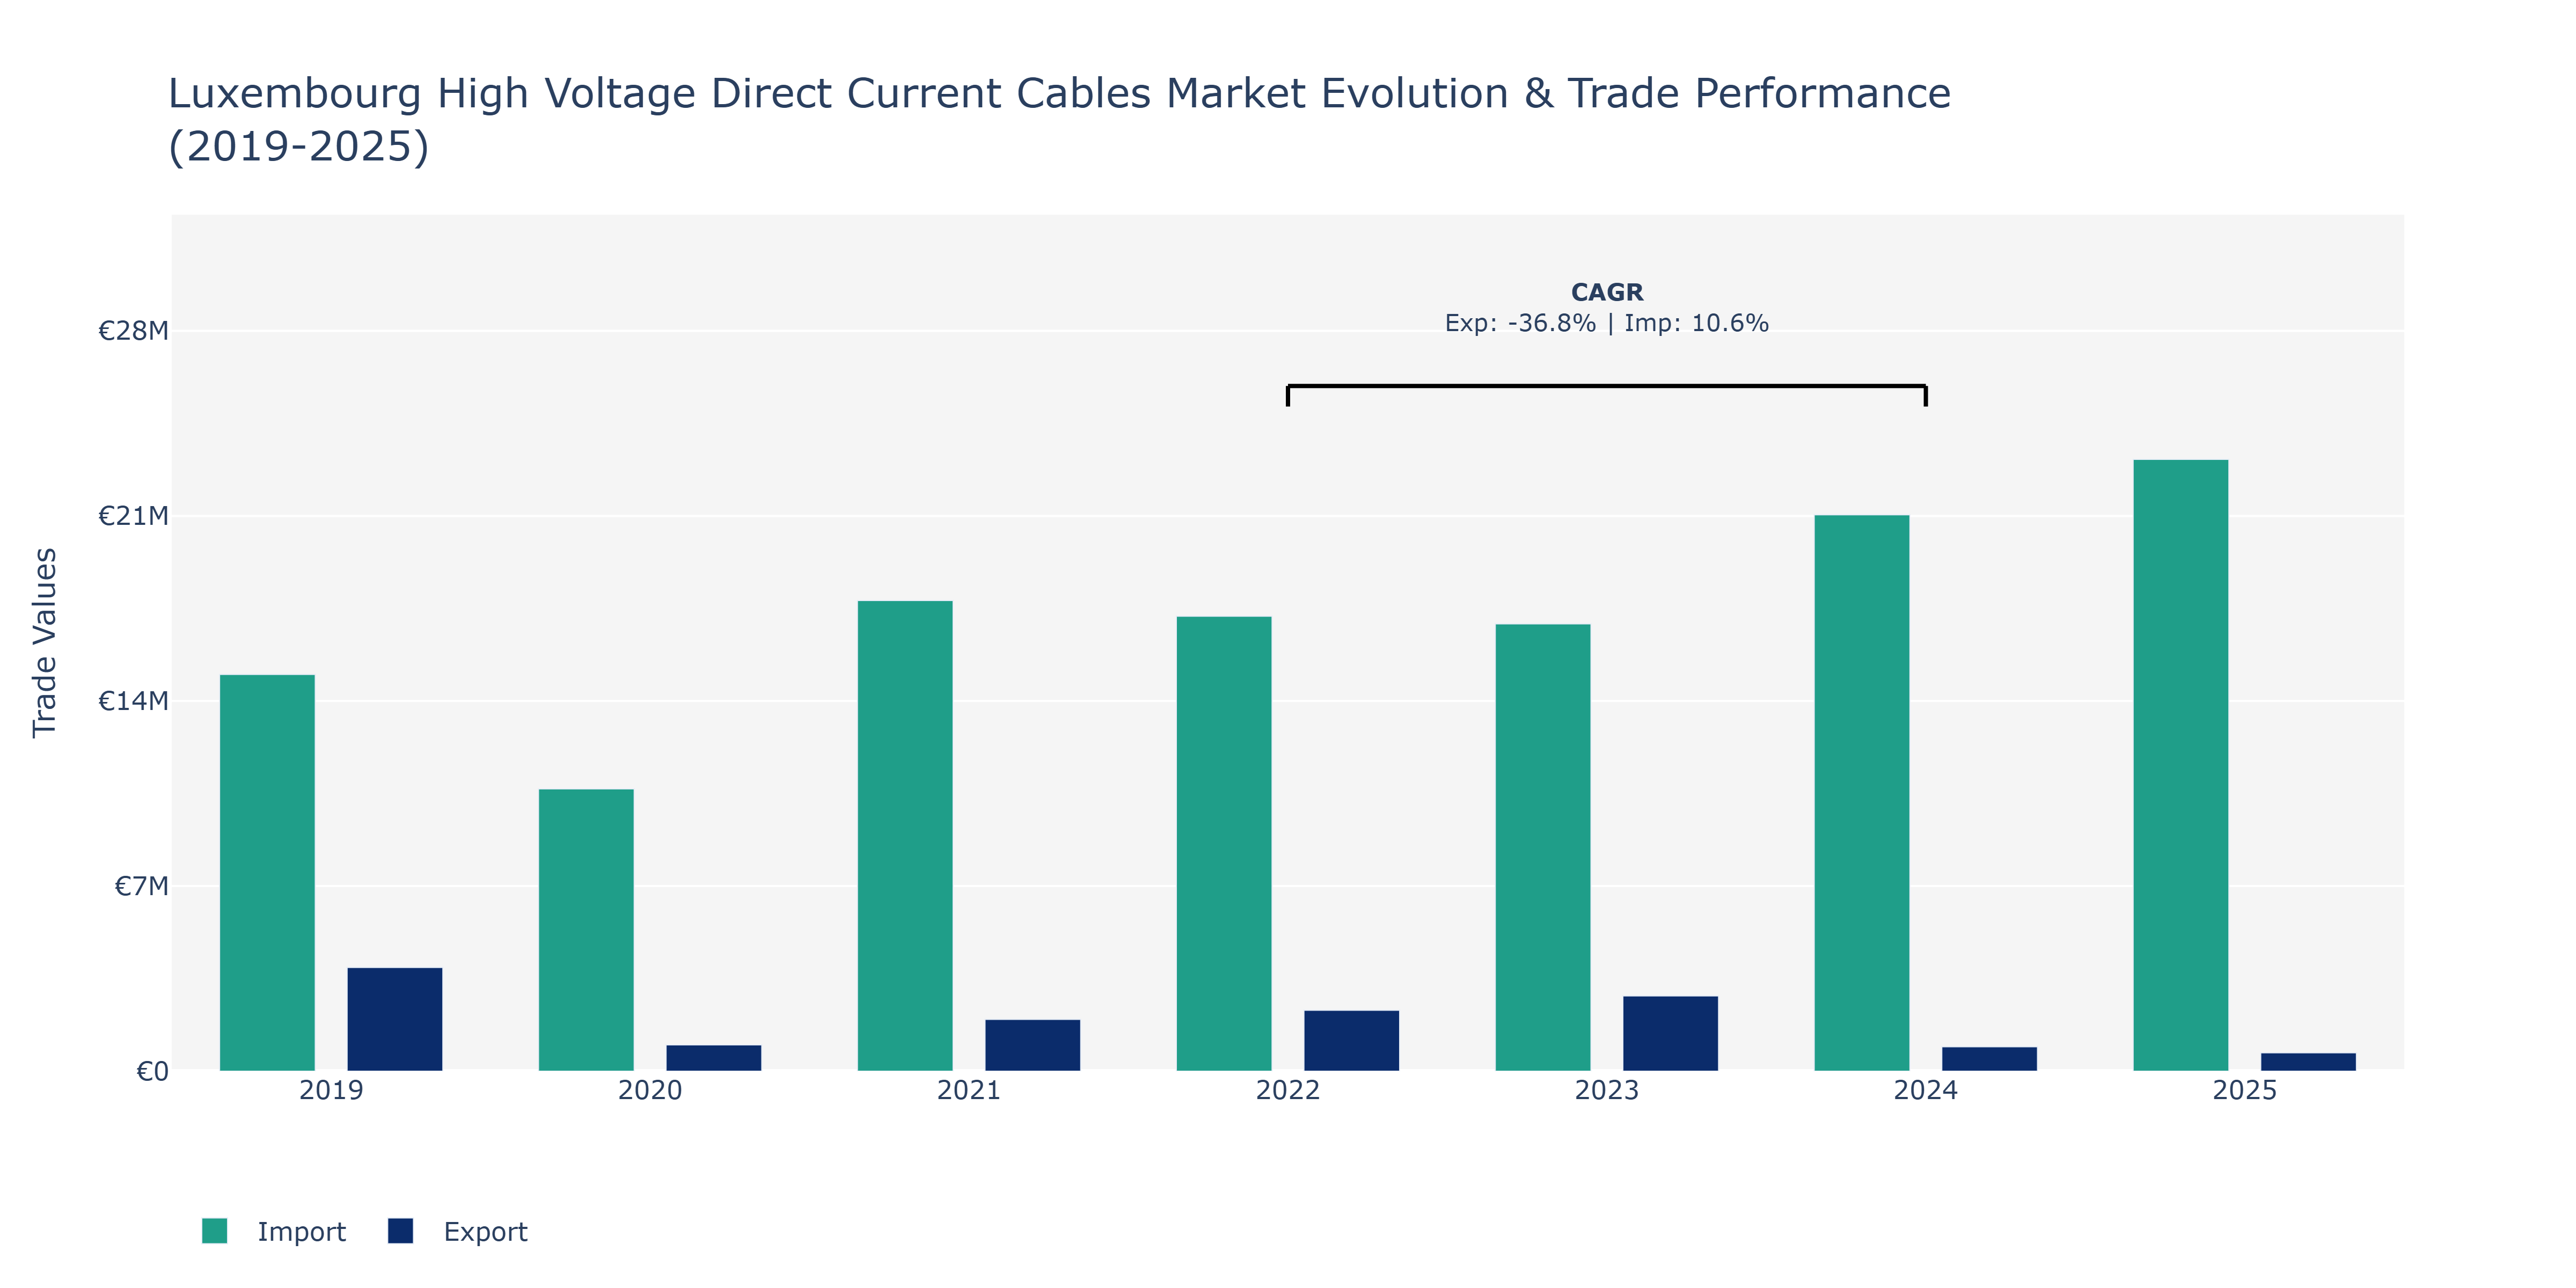
The Luxembourg High Voltage Direct Current Cables Market witnessed fluctuations in both Exports and Imports from 2019 to 2025. Exports started at €3.92 million in 2019, dropping to €994.42 thousand in 2020 before gradually increasing to €2.85 million in 2023 and then decreasing to €693.5 thousand in 2025. On the other hand, Imports saw a continuous growth trajectory, starting at €15.0 million in 2019, peaking at €21.05 million in 2024, and slightly decreasing to €23.14 million in 2025. The peak in Imports in 2024 could be attributed to Luxembourg's focus on upgrading its energy infrastructure through investments in high-voltage direct current cables to enhance energy transmission efficiency. The fluctuations in Exports could be influenced by global market demand shifts and competition. Luxembourg's strategic geographical location and its role as an energy hub could have contributed to the steady rise in Imports, reflecting the country's commitment to sustainable energy solutions and growing energy demands regionally.
Key Highlights of the Report:
- Luxembourg High Voltage Direct Current Cables Market Outlook
- Market Size of Luxembourg High Voltage Direct Current Cables Market, 2025
- Forecast of Luxembourg High Voltage Direct Current Cables Market, 2032
- Historical Data and Forecast of Luxembourg High Voltage Direct Current Cables Revenues & Volume for the Period 2022-2032F
- Luxembourg High Voltage Direct Current Cables Market Trend Evolution
- Luxembourg High Voltage Direct Current Cables Market Drivers and Challenges
- Luxembourg High Voltage Direct Current Cables Price Trends
- Luxembourg High Voltage Direct Current Cables Porter's Five Forces
- Luxembourg High Voltage Direct Current Cables Industry Life Cycle
- Historical Data and Forecast of Luxembourg High Voltage Direct Current Cables Market Revenues & Volume By Location of Deployment for the Period 2022-2032F
- Historical Data and Forecast of Luxembourg High Voltage Direct Current Cables Market Revenues & Volume By Underground for the Period 2022-2032F
- Historical Data and Forecast of Luxembourg High Voltage Direct Current Cables Market Revenues & Volume By Submarine for the Period 2022-2032F
- Historical Data and Forecast of Luxembourg High Voltage Direct Current Cables Market Revenues & Volume By Overhead for the Period 2022-2032F
- Luxembourg High Voltage Direct Current Cables Import Export Trade Statistics
- Market Opportunity Assessment By Location of Deployment
- Luxembourg High Voltage Direct Current Cables Top Companies Market Share
- Luxembourg High Voltage Direct Current Cables Competitive Benchmarking By Technical and Operational Parameters
- Luxembourg High Voltage Direct Current Cables Company Profiles
- Luxembourg High Voltage Direct Current Cables Key Strategic Recommendations
Frequently Asked Questions About the Market Study (FAQs):
6Wresearch actively monitors the Luxembourg High Voltage Direct Current Cables Market and publishes its comprehensive annual report, highlighting emerging trends, growth drivers, revenue analysis, and forecast outlook. Our insights help businesses to make data-backed strategic decisions with ongoing market dynamics. Our analysts track relevent industries related to the Luxembourg High Voltage Direct Current Cables Market, allowing our clients with actionable intelligence and reliable forecasts tailored to emerging regional needs.
Yes, we provide customisation as per your requirements. To learn more, feel free to contact us on sales@6wresearch.com
1 Executive Summary |
2 Introduction |
2.1 Key Highlights of the Report |
2.2 Report Description |
2.3 Market Scope & Segmentation |
2.4 Research Methodology |
2.5 Assumptions |
3 Luxembourg High Voltage Direct Current Cables Market Overview |
3.1 Luxembourg Country Macro Economic Indicators |
3.2 Luxembourg High Voltage Direct Current Cables Market Revenues & Volume, 2022 & 2032F |
3.3 Luxembourg High Voltage Direct Current Cables Market - Industry Life Cycle |
3.4 Luxembourg High Voltage Direct Current Cables Market - Porter's Five Forces |
3.5 Luxembourg High Voltage Direct Current Cables Market Revenues & Volume Share, By Location of Deployment, 2022 & 2032F |
4 Luxembourg High Voltage Direct Current Cables Market Dynamics |
4.1 Impact Analysis |
4.2 Market Drivers |
4.2.1 Increasing demand for renewable energy sources leading to the development of high voltage direct current (HVDC) infrastructure |
4.2.2 Government initiatives aimed at enhancing energy efficiency and reducing carbon emissions |
4.2.3 Growing investments in infrastructure development projects in Luxembourg |
4.3 Market Restraints |
4.3.1 High initial investment costs associated with HVDC cable projects |
4.3.2 Technological challenges and complexities in implementing HVDC systems |
4.3.3 Regulatory hurdles and compliance requirements in the energy sector |
5 Luxembourg High Voltage Direct Current Cables Market Trends |
6 Luxembourg High Voltage Direct Current Cables Market, By Types |
6.1 Luxembourg High Voltage Direct Current Cables Market, By Location of Deployment |
6.1.1 Overview and Analysis |
6.1.2 Luxembourg High Voltage Direct Current Cables Market Revenues & Volume, By Location of Deployment, 2022-2032F |
6.1.3 Luxembourg High Voltage Direct Current Cables Market Revenues & Volume, By Underground, 2022-2032F |
6.1.4 Luxembourg High Voltage Direct Current Cables Market Revenues & Volume, By Submarine, 2022-2032F |
6.1.5 Luxembourg High Voltage Direct Current Cables Market Revenues & Volume, By Overhead, 2022-2032F |
7 Luxembourg High Voltage Direct Current Cables Market Import-Export Trade Statistics |
7.1 Luxembourg High Voltage Direct Current Cables Market Export to Major Countries |
7.2 Luxembourg High Voltage Direct Current Cables Market Imports from Major Countries |
8 Luxembourg High Voltage Direct Current Cables Market Key Performance Indicators |
8.1 Capacity utilization rate of HVDC cables in Luxembourg |
8.2 Number of new HVDC cable projects initiated in the market |
8.3 Average transmission efficiency of HVDC systems |
8.4 Percentage of energy consumption from renewable sources in Luxembourg |
8.5 Investment flow into HVDC infrastructure projects |
9 Luxembourg High Voltage Direct Current Cables Market - Opportunity Assessment |
9.1 Luxembourg High Voltage Direct Current Cables Market Opportunity Assessment, By Location of Deployment, 2022 & 2032F |
10 Luxembourg High Voltage Direct Current Cables Market - Competitive Landscape |
10.1 Luxembourg High Voltage Direct Current Cables Market Revenue Share, By Companies, 2025 |
10.2 Luxembourg High Voltage Direct Current Cables Market Competitive Benchmarking, By Operating and Technical Parameters |
11 Company Profiles |
12 Recommendations |
13 Disclaimer |
Export potential assessment - trade Analytics for 2030
Export potential enables firms to identify high-growth global markets with greater confidence by combining advanced trade intelligence with a structured quantitative methodology. The framework analyzes emerging demand trends and country-level import patterns while integrating macroeconomic and trade datasets such as GDP and population forecasts, bilateral import–export flows, tariff structures, elasticity differentials between developed and developing economies, geographic distance, and import demand projections. Using weighted trade values from 2020–2024 as the base period to project country-to-country export potential for 2030, these inputs are operationalized through calculated drivers such as gravity model parameters, tariff impact factors, and projected GDP per-capita growth. Through an analysis of hidden potentials, demand hotspots, and market conditions that are most favorable to success, this method enables firms to focus on target countries, maximize returns, and global expansion with data, backed by accuracy.
By factoring in the projected importer demand gap that is currently unmet and could be potential opportunity, it identifies the potential for the Exporter (Country) among 190 countries, against the general trade analysis, which identifies the biggest importer or exporter.
To discover high-growth global markets and optimize your business strategy:
Click Here
Pricing
- Single User License$ 1,995
- Department License$ 2,400
- Site License$ 3,120
- Global License$ 3,795

Search
Thought Leadership and Analyst Meet


Our Clients
Latest Reports
- China Electric Appliance Rental Market (2026-2032) | Trends, Revenue, Growth, Challenges, Size, Value, Outlook, Pricing, Strategy, Insights, Restraints, segmentation, Companies, Investment Opportunities, Analysis, Demand, Drivers, Competition, Forecast, Share
- Chile Electric Appliance Rental Market (2026-2032) | Outlook, Competition, Drivers, Strategy, Revenue, Analysis, Value, Pricing, Restraints, Size, Demand, Share, Growth, Forecast, Challenges, Insights, Investment Opportunities, Companies, Trends, segmentation
- Cambodia Electric Appliance Rental Market (2026-2032) | Companies, Analysis, Restraints, Pricing, Insights, Challenges, Outlook, Strategy, Forecast, Trends, Competition, Value, Revenue, Investment Opportunities, segmentation, Drivers, Size, Demand, Growth, Share
- Brazil Electric Appliance Rental Market (2026-2032) | Revenue, Strategy, Forecast, Companies, segmentation, Competition, Size, Investment Opportunities, Pricing, Restraints, Outlook, Challenges, Analysis, Drivers, Value, Demand, Insights, Trends, Growth, Share
- Bangladesh Electric Appliance Rental Market (2026-2032) | Drivers, Forecast, Investment Opportunities, Strategy, Insights, Demand, Challenges, Outlook, Trends, Competition, Value, Revenue, Size, Pricing, Analysis, Companies, Restraints, segmentation, Share, Growth
- Bahrain Electric Appliance Rental Market (2026-2032) | Outlook, Size, Competition, Restraints, Drivers, Value, Trends, Investment Opportunities, Insights, Forecast, Revenue, Strategy, Growth, Share, Demand, Analysis, Challenges, Companies, segmentation, Pricing
- Azerbaijan Electric Appliance Rental Market (2026-2032) | Trends, Investment Opportunities, Restraints, Insights, Strategy, Competition, Value, Growth, Demand, Drivers, Analysis, Forecast, Size, Share, Outlook, segmentation, Pricing, Challenges, Revenue, Companies
- Australia Electric Appliance Rental Market (2026-2032) | Challenges, Restraints, Forecast, Demand, Size, Competition, Pricing, Investment Opportunities, Revenue, Trends, Drivers, Growth, Outlook, Analysis, Strategy, Value, segmentation, Insights, Companies, Share
- Argentina Electric Appliance Rental Market (2026-2032) | Growth, Trends, Insights, Outlook, Forecast, Size, Drivers, Analysis, Restraints, Challenges, Share, Revenue, Investment Opportunities, Strategy, Demand, Value, Companies, segmentation, Competition, Pricing
- Algeria Electric Appliance Rental Market (2026-2032) | Share, Size, Value, Strategy, Competition, Outlook, Challenges, Companies, Trends, Pricing, Insights, Forecast, Investment Opportunities, Revenue, Growth, Restraints, segmentation, Analysis, Demand, Drivers
Industry Events and Analyst Meet

HIMTEX 2026

India Refining Summit 2026

India EV Show 2026

EV tech India Expo 2026

Auto Tech Asia 2026
Whitepaper
- Middle East & Africa Commercial Security Market Click here to view more.
- Middle East & Africa Fire Safety Systems & Equipment Market Click here to view more.
- GCC Drone Market Click here to view more.
- Middle East Lighting Fixture Market Click here to view more.
- GCC Physical & Perimeter Security Market Click here to view more.
6WResearch In News
- Doha a strategic location for EV manufacturing hub: IPA Qatar
- Demand for luxury TVs surging in the GCC, says Samsung
- Empowering Growth: The Thriving Journey of Bangladesh’s Cable Industry
- Demand for luxury TVs surging in the GCC, says Samsung
- Video call with a traditional healer? Once unthinkable, it’s now common in South Africa
- Intelligent Buildings To Smooth GCC’s Path To Net Zero