Malaysia Infrastructure as Code (IaC) Market Size & Growth Rate (2026-2032)
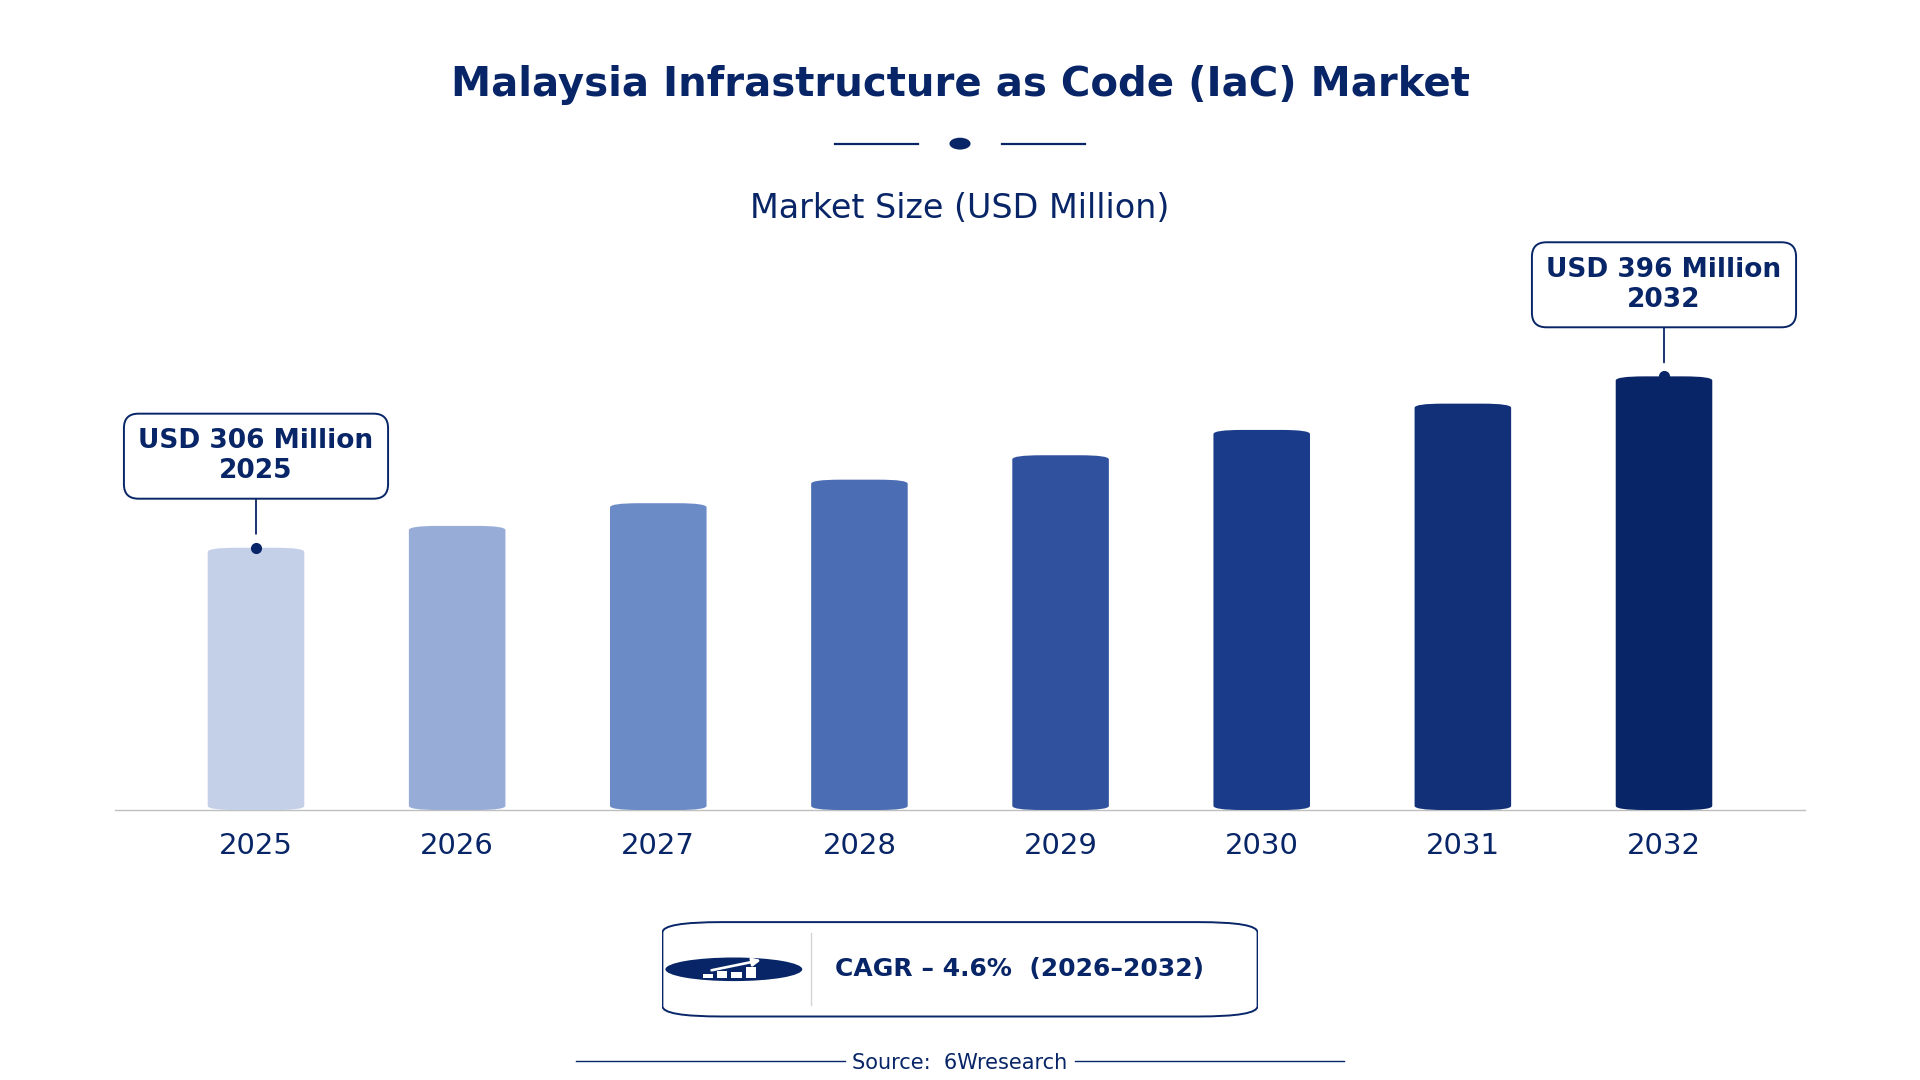
The Malaysia Infrastructure as Code (IaC) Market was estimated at USD 306 Million in 2025 and is projected to reach USD 396 Million by 2032, growing at a CAGR of 4.6% from 2026 to 2032.
Malaysia Infrastructure as Code (IaC) Market Synopsis
In Malaysia, businesses are increasingly adopting Infrastructure as Code (IaC) solutions to enhance the efficiency of their cloud infrastructure management. This trend is a direct response to the growing demand for automation, allowing firms to provision resources rapidly while minimizing human error.
The integration of IaC within the DevOps framework has further propelled its adoption. Companies recognize that IaC not only improves deployment speed but also contributes to better resource management and cost efficiency, making it a vital component of their digital transformation strategies.
Malaysia Infrastructure as Code (IaC) Market Year-wise Growth Rate and Key Drivers
This graph illustrates the annual growth rates of the Malaysia Infrastructure as Code (IaC) Market from 2021 to 2032, highlighting a steady upward trajectory and projected expansion over the forecast period.
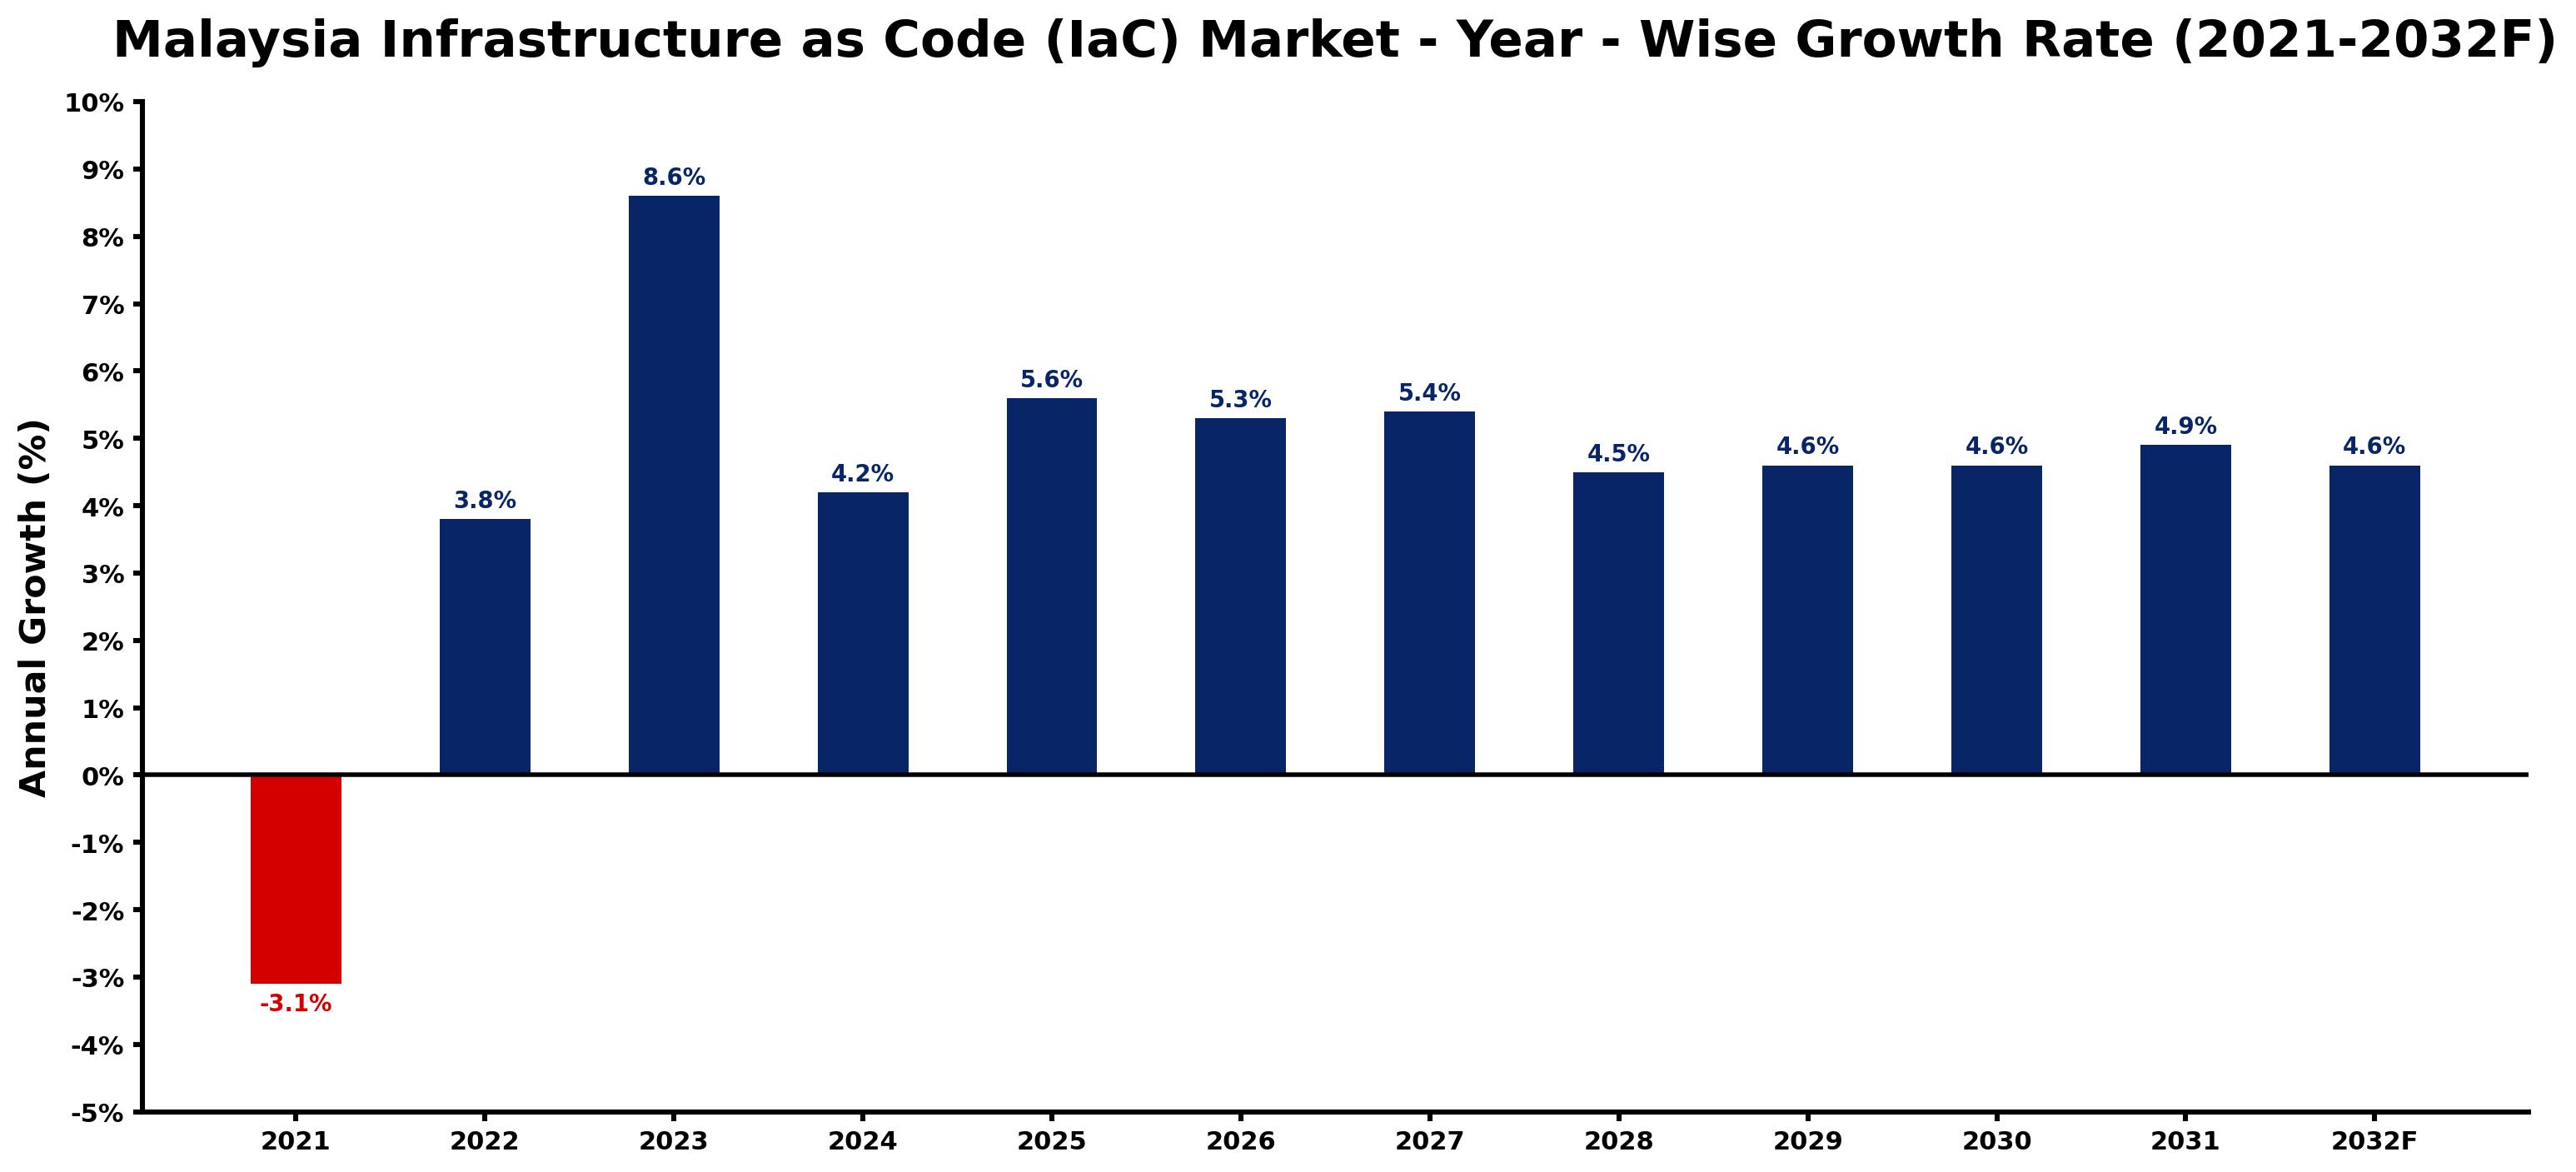
The table below presents the year‑wise growth rates along with the key drivers influencing the market
| Year | Growth Rate | Major Drivers |
| 2021 | -3.1% | Government budget cuts delayed infrastructure digital transformation projects. |
| 2022 | 3.8% | Adoption of MyDIGITAL blueprint enhancing cloud infrastructure. |
| 2023 | 8.6% | Increased funding for digital startups by Malaysia Digital Economy Corporation. |
| 2024 | 4.2% | Corporate focus on agile operations driving IaC solutions. |
| 2025 | 5.6% | Regulatory support for cloud security improving IaC adoption. |
| 2026 | 5.3% | Growth in remote work boosting IaC implementation requirements. |
| 2027 | 5.4% | Rise of local cloud service providers facilitating IaC. |
| 2028 | 4.5% | Investment in smart city projects demanding automated deployments. |
| 2029 | 4.6% | Government collaboration with tech firms on IaC standards. |
| 2030 | 4.6% | Demand for rapid application deployment driving IaC projects. |
| 2031 | 4.9% | Emerging focus on sustainability in software deployment strategies. |
| 2032 | 4.6% | Increased cybersecurity concerns promoting IaC for infrastructure safety. |
Note: Market size estimations and growth projections presented in this report are based on 6Wresearch's proprietary forecasting methodology, utilizing the latest available industry data, government publications, and primary research inputs.
Malaysia Infrastructure as Code (IaC) Market Key Takeaways
Below are some of the specific key takeaways from the market, including:
- The demand for IaC is driven by the need for rapid deployment and management of cloud resources.
- Growing adoption of DevOps practices is significantly influencing the IaC market in Malaysia.
- Cost optimization remains a central focus for organizations implementing IaC solutions.
- Skill gaps and cultural shifts pose challenges to IaC adoption across various sectors.
- The Covid-19 pandemic has accelerated the transition towards IaC as businesses seek more agility.
Evaluation of Restraints in Malaysia Infrastructure as Code (IaC) Market
Despite the promising growth trajectory, the Malaysia Infrastructure as Code (IaC) market faces notable constraints. One of the most pressing issues is the existing skill gap within the workforce. Many organizations struggle to find talent proficient in IaC tools and methodologies, which can hinder effective implementation. on top of that, the cultural shift required for successful IaC adoption necessitates time and commitment from leadership, which not all companies are willing or able to invest. Maintaining security and compliance throughout the development lifecycle also demands continuous monitoring, adding an additional layer of complexity.
Malaysia Infrastructure as Code (IaC) Market Trends
Several trends are shaping the Malaysia Infrastructure as Code (IaC) market. The rise of hybrid cloud environments is prompting organizations to adopt IaC for better resource management across multiple platforms. Additionally, the focus on security-first development is becoming a priority, with companies seeking to integrate security practices within their IaC processes. The growing popularity of containerization and microservices architectures is also influencing IaC adoption, as these technologies benefit significantly from automated infrastructure provisioning and management.
Malaysia Infrastructure as Code (IaC) Market Opportunities
As Malaysia continues to digitize its economy, numerous opportunities arise within the IaC market. Businesses looking to enhance operational efficiency can invest in IaC solutions to automate repetitive tasks, ultimately freeing up resources for strategic initiatives. on top of that, partnerships between technology providers and local organizations can foster knowledge-sharing and capacity-building, addressing the skill gap. As regulatory frameworks evolve, compliance-oriented IaC solutions can become a lucrative area for development, ensuring organizations meet new standards while maintaining operational agility.
Government Initiatives in the Malaysia Infrastructure as Code (IaC) Market
The Malaysian government is actively promoting the adoption of digital technologies, including Infrastructure as Code (IaC), to enhance the nation’s competitiveness in the global digital economy. By prioritizing digital transformation through various initiatives, the government aims to create a conducive environment for innovation and growth in this sector.
- A national digital infrastructure upgrade programme now in its rollout phase aims to enhance connectivity and support the adoption of cloud technologies.
- A regulatory framework introduced in 2025 mandates the incorporation of automated processes in public sector IT infrastructure management.
- Currently ongoing is a public-private initiative focused on enhancing the cybersecurity posture of digital infrastructure, which includes IaC solutions.
- A planned digital skills development programme expected to launch by 2026 aims to upskill the workforce, addressing the skill gaps in IaC and related technologies.
Future Insights of the Malaysia Infrastructure as Code (IaC) Market
Looking ahead to 2026-2032, the Malaysia Infrastructure as Code (IaC) market is set for continued growth. As more organizations recognize the critical role of IaC in achieving operational efficiency and agility, investment in these solutions is likely to increase. The integration of advanced technologies, such as artificial intelligence and machine learning, into IaC practices is expected to further enhance capabilities, allowing businesses to optimize resource allocation and improve decision-making. This evolving landscape will position IaC as a cornerstone of digital transformation initiatives across various sectors.
Malaysia Infrastructure as Code (IaC) Market Latest Developments
Over the past year, activity in the Malaysia Infrastructure as Code (IaC) market has intensified, reflecting a growing recognition of its value in automating infrastructure management. Companies are increasingly investing in IaC solutions to streamline operations and respond to market demands more efficiently.
- A leading regional operator launched a new IaC platform in early 2025, designed to enhance cloud resource management for enterprises.
- An initiative that began in mid-2025 and remains underway focuses on integrating IaC practices into existing DevOps workflows among technology firms.
- A major technology vendor is currently working on a service upgrade to incorporate machine learning capabilities into their IaC offerings, expected by late 2026.
- A rollout expected to begin in the second half of 2026 aims to enhance the cybersecurity features of IaC templates, ensuring compliance with emerging regulations.
Malaysia Infrastructure as Code (IaC) Market - Key Attractiveness of the Report
- 10 Years of Market Numbers
- Historical Data Starting from 2022 to 2025
- Base Year: 2025
- Forecast Data until 2032
- Key Performance Indicators Impacting the Market
- Major Upcoming Developments and Projects
Key Highlights of the Report:
- Malaysia Infrastructure as Code (IaC) Market Outlook
- Market Size of Malaysia Infrastructure as Code (IaC) Market, 2025
- Forecast of Malaysia Infrastructure as Code (IaC) Market, 2032
- Historical Data and Forecast of Malaysia Infrastructure as Code (IaC) Revenues & Volume for the Period 2022-2032F
- Malaysia Infrastructure as Code (IaC) Market Trend Evolution
- Malaysia Infrastructure as Code (IaC) Market Drivers and Challenges
- Malaysia Infrastructure as Code (IaC) Price Trends
- Malaysia Infrastructure as Code (IaC) Porter's Five Forces
- Malaysia Infrastructure as Code (IaC) Industry Life Cycle
- Historical Data and Forecast of Malaysia Infrastructure as Code (IaC) Market Revenues & Volume By Component for the Period 2022-2032F
- Historical Data and Forecast of Malaysia Infrastructure as Code (IaC) Market Revenues & Volume By Tools for the Period 2022-2032F
- Historical Data and Forecast of Malaysia Infrastructure as Code (IaC) Market Revenues & Volume By Services for the Period 2022-2032F
- Historical Data and Forecast of Malaysia Infrastructure as Code (IaC) Market Revenues & Volume By Type for the Period 2022-2032F
- Historical Data and Forecast of Malaysia Infrastructure as Code (IaC) Market Revenues & Volume By Declarative for the Period 2022-2032F
- Historical Data and Forecast of Malaysia Infrastructure as Code (IaC) Market Revenues & Volume By Imperative for the Period 2022-2032F
- Historical Data and Forecast of Malaysia Infrastructure as Code (IaC) Market Revenues & Volume By Infrastructure Type for the Period 2022-2032F
- Historical Data and Forecast of Malaysia Infrastructure as Code (IaC) Market Revenues & Volume By Mutable for the Period 2022-2032F
- Historical Data and Forecast of Malaysia Infrastructure as Code (IaC) Market Revenues & Volume By Immutable for the Period 2022-2032F
- Historical Data and Forecast of Malaysia Infrastructure as Code (IaC) Market Revenues & Volume By Organization Size for the Period 2022-2032F
- Historical Data and Forecast of Malaysia Infrastructure as Code (IaC) Market Revenues & Volume By Large Enterprises for the Period 2022-2032F
- Historical Data and Forecast of Malaysia Infrastructure as Code (IaC) Market Revenues & Volume By SMEs for the Period 2022-2032F
- Historical Data and Forecast of Malaysia Infrastructure as Code (IaC) Market Revenues & Volume By Deployment Type for the Period 2022-2032F
- Historical Data and Forecast of Malaysia Infrastructure as Code (IaC) Market Revenues & Volume By On-premises for the Period 2022-2032F
- Historical Data and Forecast of Malaysia Infrastructure as Code (IaC) Market Revenues & Volume By Cloud for the Period 2022-2032F
- Historical Data and Forecast of Malaysia Infrastructure as Code (IaC) Market Revenues & Volume By Verticals for the Period 2022-2032F
- Historical Data and Forecast of Malaysia Infrastructure as Code (IaC) Market Revenues & Volume By BFSI for the Period 2022-2032F
- Historical Data and Forecast of Malaysia Infrastructure as Code (IaC) Market Revenues & Volume By IT & ITES for the Period 2022-2032F
- Historical Data and Forecast of Malaysia Infrastructure as Code (IaC) Market Revenues & Volume By Telecom for the Period 2022-2032F
- Historical Data and Forecast of Malaysia Infrastructure as Code (IaC) Market Revenues & Volume By Government for the Period 2022-2032F
- Historical Data and Forecast of Malaysia Infrastructure as Code (IaC) Market Revenues & Volume By Manufacturing for the Period 2022-2032F
- Historical Data and Forecast of Malaysia Infrastructure as Code (IaC) Market Revenues & Volume By Healthcare for the Period 2022-2032F
- Historical Data and Forecast of Malaysia Infrastructure as Code (IaC) Market Revenues & Volume By Retail for the Period 2022-2032F
- Historical Data and Forecast of Malaysia Infrastructure as Code (IaC) Market Revenues & Volume By Transportation & Logistics for the Period 2022-2032F
- Malaysia Infrastructure as Code (IaC) Import Export Trade Statistics
- Market Opportunity Assessment By Component
- Market Opportunity Assessment By Type
- Market Opportunity Assessment By Infrastructure Type
- Market Opportunity Assessment By Organization Size
- Market Opportunity Assessment By Deployment Type
- Market Opportunity Assessment By Verticals
- Malaysia Infrastructure as Code (IaC) Top Companies Market Share
- Malaysia Infrastructure as Code (IaC) Competitive Benchmarking By Technical and Operational Parameters
- Malaysia Infrastructure as Code (IaC) Company Profiles
- Malaysia Infrastructure as Code (IaC) Key Strategic Recommendations






































