Maldives Processed Food Market (2026-2032) | Share, Value, Analysis, Size, Growth, Outlook, Revenue, Trends, Industry, Segmentation, Forecast & Companies
Market Forecast By Process (Minimally, Highly), By Product type (Plant based, Fruits , Vegetables, Legumes , Extracted foods, Others, Animal based, Milk ), By Application (Baked foods, Baby food, Breakfast Cereal, Biscuits, Cheese, Chocolate confectionary, Ice creams, Instant Noodles) And Competitive Landscape
| Product Code: ETC5208210 | Publication Date: Nov 2023 | Updated Date: Apr 2026 | Product Type: Market Research Report | |
| Publisher: 6Wresearch | Author: Shubham Padhi | No. of Pages: 60 | No. of Figures: 30 | No. of Tables: 5 |
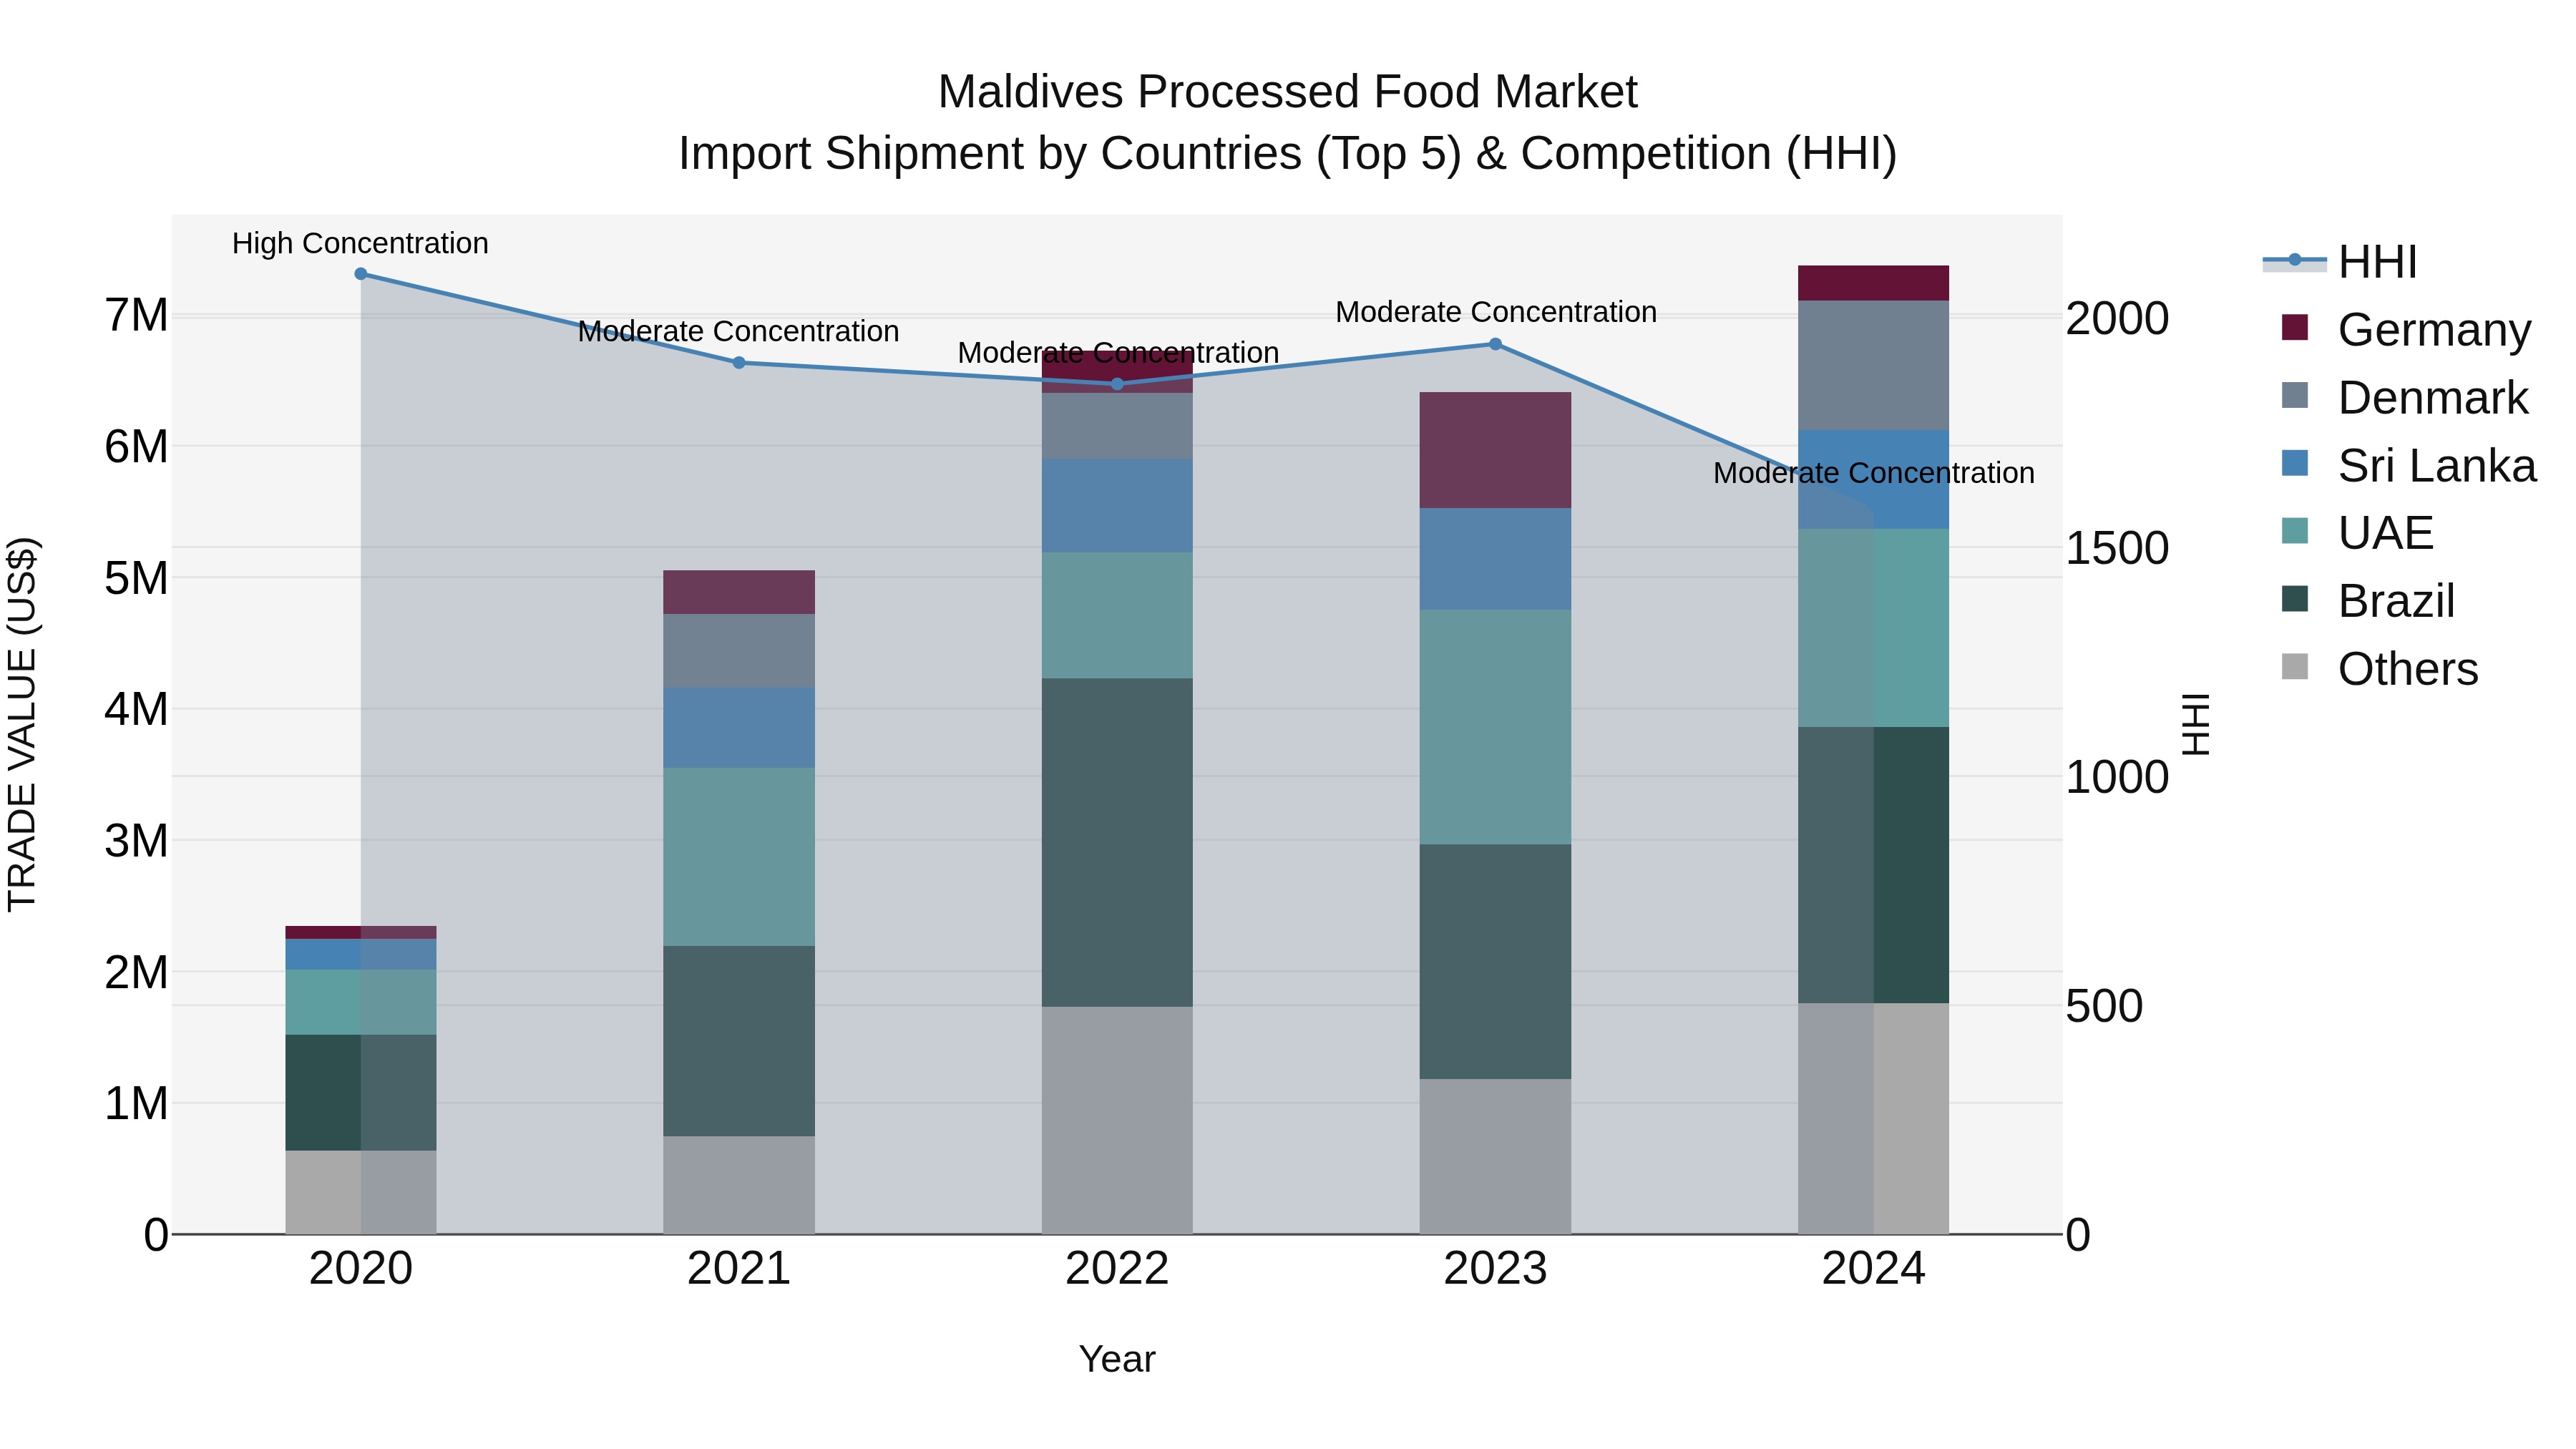
Maldives Processed Food Market Top 5 Importing Countries and Market Competition (HHI) Analysis
Maldives continues to see a significant increase in processed food imports, with top countries like Brazil, UAE, and Denmark leading the way in 2024. The market is moderately concentrated, as indicated by the Herfindahl-Hirschman Index (HHI). The compound annual growth rate (CAGR) from 2020 to 2024 is an impressive 33.14%, with a notable growth rate of 15.06% from 2023 to 2024. These figures suggest a strong demand for processed food products in Maldives, with key exporting countries playing a crucial role in meeting consumer needs.
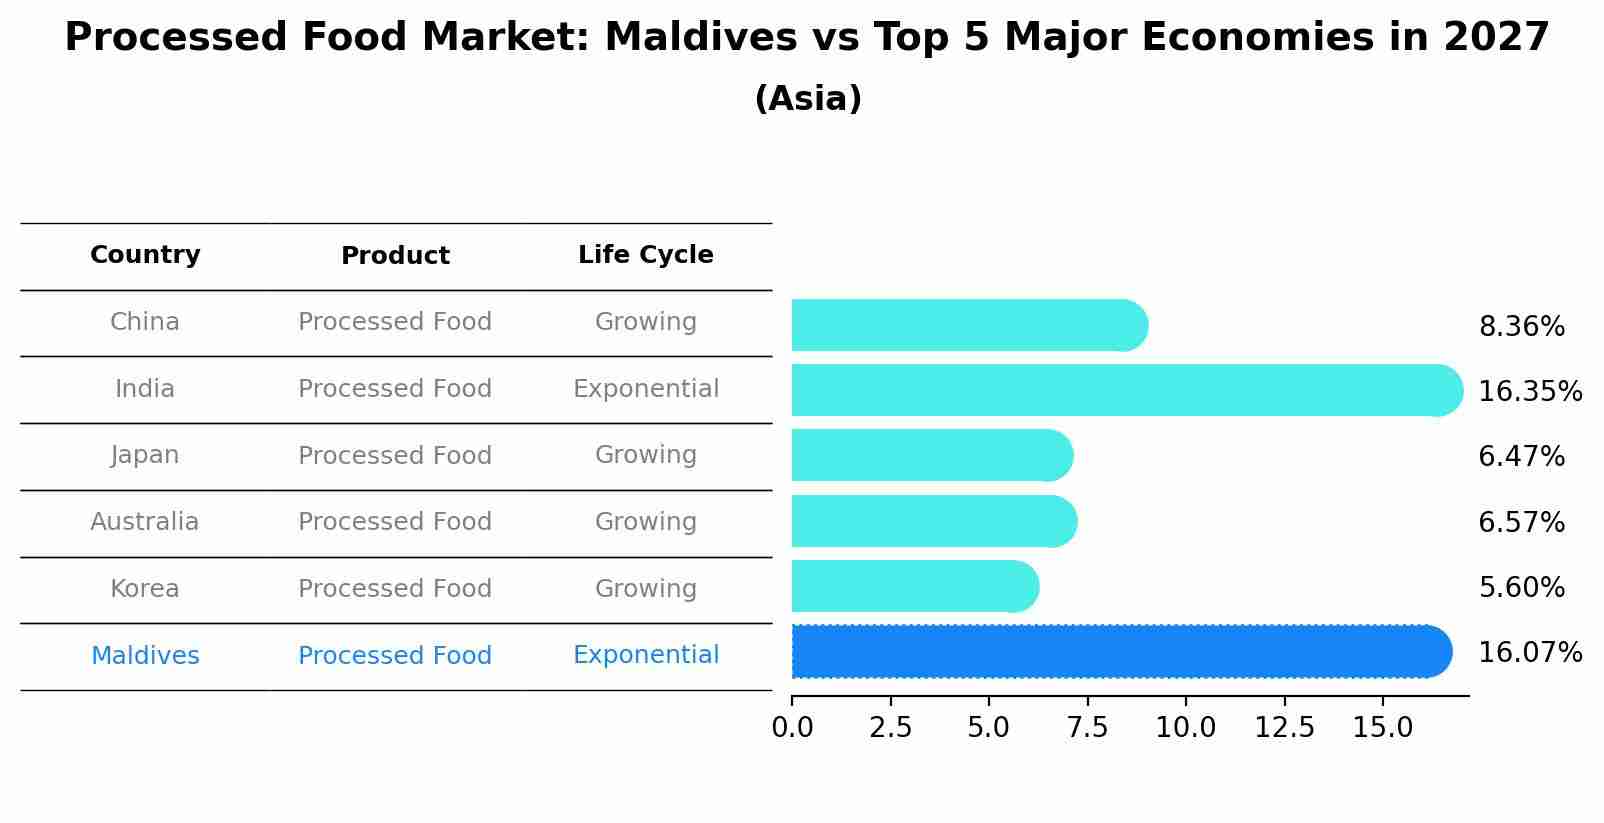
Processed Food Market: Maldives vs Top 5 Major Economies in 2027 (Asia)
Maldives's Processed Food market is anticipated to experience a exponential growth rate of 16.07% by 2027, reflecting trends observed in the largest economy China, followed by India, Japan, Australia and South Korea.
Key Highlights of the Report:
- Maldives Processed Food Market Outlook
- Market Size of Maldives Processed Food Market, 2025
- Forecast of Maldives Processed Food Market, 2032
- Historical Data and Forecast of Maldives Processed Food Revenues & Volume for the Period 2022 - 2032F
- Maldives Processed Food Market Trend Evolution
- Maldives Processed Food Market Drivers and Challenges
- Maldives Processed Food Price Trends
- Maldives Processed Food Porter`s Five Forces
- Maldives Processed Food Industry Life Cycle
- Historical Data and Forecast of Maldives Processed Food Market Revenues & Volume By Process for the Period 2022 - 2032F
- Historical Data and Forecast of Maldives Processed Food Market Revenues & Volume By Minimally for the Period 2022 - 2032F
- Historical Data and Forecast of Maldives Processed Food Market Revenues & Volume By Highly for the Period 2022 - 2032F
- Historical Data and Forecast of Maldives Processed Food Market Revenues & Volume By Product type for the Period 2022 - 2032F
- Historical Data and Forecast of Maldives Processed Food Market Revenues & Volume By Plant based for the Period 2022 - 2032F
- Historical Data and Forecast of Maldives Processed Food Market Revenues & Volume By Fruits for the Period 2022 - 2032F
- Historical Data and Forecast of Maldives Processed Food Market Revenues & Volume By Vegetables for the Period 2022 - 2032F
- Historical Data and Forecast of Maldives Processed Food Market Revenues & Volume By Legumes for the Period 2022 - 2032F
- Historical Data and Forecast of Maldives Processed Food Market Revenues & Volume By Extracted foods for the Period 2022 - 2032F
- Historical Data and Forecast of Maldives Processed Food Market Revenues & Volume By Others for the Period 2022 - 2032F
- Historical Data and Forecast of Maldives Processed Food Market Revenues & Volume By Animal based for the Period 2022 - 2032F
- Historical Data and Forecast of Maldives Processed Food Market Revenues & Volume By Milk for the Period 2022 - 2032F
- Historical Data and Forecast of Maldives Processed Food Market Revenues & Volume By Application for the Period 2022 - 2032F
- Historical Data and Forecast of Maldives Processed Food Market Revenues & Volume By Baked foods for the Period 2022 - 2032F
- Historical Data and Forecast of Maldives Processed Food Market Revenues & Volume By Baby food for the Period 2022 - 2032F
- Historical Data and Forecast of Maldives Processed Food Market Revenues & Volume By Breakfast Cereal for the Period 2022 - 2032F
- Historical Data and Forecast of Maldives Processed Food Market Revenues & Volume By Biscuits for the Period 2022 - 2032F
- Historical Data and Forecast of Maldives Processed Food Market Revenues & Volume By Cheese for the Period 2022 - 2032F
- Historical Data and Forecast of Maldives Processed Food Market Revenues & Volume By Chocolate confectionary for the Period 2022 - 2032F
- Historical Data and Forecast of Maldives Processed Food Market Revenues & Volume By Ice creams for the Period 2022 - 2032F
- Historical Data and Forecast of Maldives Processed Food Market Revenues & Volume By Instant Noodles for the Period 2022 - 2032F
- Maldives Processed Food Import Export Trade Statistics
- Market Opportunity Assessment By Process
- Market Opportunity Assessment By Product type
- Market Opportunity Assessment By Application
- Maldives Processed Food Top Companies Market Share
- Maldives Processed Food Competitive Benchmarking By Technical and Operational Parameters
- Maldives Processed Food Company Profiles
- Maldives Processed Food Key Strategic Recommendations
Frequently Asked Questions About the Market Study (FAQs):
6Wresearch actively monitors the Maldives Processed Food Market and publishes its comprehensive annual report, highlighting emerging trends, growth drivers, revenue analysis, and forecast outlook. Our insights help businesses to make data-backed strategic decisions with ongoing market dynamics. Our analysts track relevent industries related to the Maldives Processed Food Market, allowing our clients with actionable intelligence and reliable forecasts tailored to emerging regional needs.
Yes, we provide customisation as per your requirements. To learn more, feel free to contact us on sales@6wresearch.com
1 Executive Summary |
2 Introduction |
2.1 Key Highlights of the Report |
2.2 Report Description |
2.3 Market Scope & Segmentation |
2.4 Research Methodology |
2.5 Assumptions |
3 Maldives Processed Food Market Overview |
3.1 Maldives Country Macro Economic Indicators |
3.2 Maldives Processed Food Market Revenues & Volume, 2022 & 2032F |
3.3 Maldives Processed Food Market - Industry Life Cycle |
3.4 Maldives Processed Food Market - Porter's Five Forces |
3.5 Maldives Processed Food Market Revenues & Volume Share, By Process, 2022 & 2032F |
3.6 Maldives Processed Food Market Revenues & Volume Share, By Product type, 2022 & 2032F |
3.7 Maldives Processed Food Market Revenues & Volume Share, By Application, 2022 & 2032F |
4 Maldives Processed Food Market Dynamics |
4.1 Impact Analysis |
4.2 Market Drivers |
4.2.1 Increasing urbanization and changing lifestyles leading to a higher demand for convenient and ready-to-eat processed food products. |
4.2.2 Growing tourism industry in the Maldives driving the demand for a variety of processed food options to cater to tourists' preferences. |
4.2.3 Rising disposable income levels among the Maldivian population, leading to an increase in spending on processed food products. |
4.3 Market Restraints |
4.3.1 Limited availability of raw materials locally, leading to dependency on imports and potentially impacting the cost and availability of processed food products. |
4.3.2 Concerns regarding the health implications of consuming processed foods, leading to a shift towards healthier and organic alternatives in the market. |
5 Maldives Processed Food Market Trends |
6 Maldives Processed Food Market Segmentations |
6.1 Maldives Processed Food Market, By Process |
6.1.1 Overview and Analysis |
6.1.2 Maldives Processed Food Market Revenues & Volume, By Minimally, 2022 - 2032F |
6.1.3 Maldives Processed Food Market Revenues & Volume, By Highly, 2022 - 2032F |
6.2 Maldives Processed Food Market, By Product type |
6.2.1 Overview and Analysis |
6.2.2 Maldives Processed Food Market Revenues & Volume, By Plant based, 2022 - 2032F |
6.2.3 Maldives Processed Food Market Revenues & Volume, By Fruits , 2022 - 2032F | 6.2.4 Maldives Processed Food Market Revenues & Volume, By Vegetables, 2022 - 2032F |
6.2.5 Maldives Processed Food Market Revenues & Volume, By Legumes , 2022 - 2032F |
6.2.6 Maldives Processed Food Market Revenues & Volume, By Extracted foods, 2022 - 2032F |
6.2.7 Maldives Processed Food Market Revenues & Volume, By Others, 2022 - 2032F |
6.2.8 Maldives Processed Food Market Revenues & Volume, By Milk , 2022 - 2032F |
6.2.9 Maldives Processed Food Market Revenues & Volume, By Milk , 2022 - 2032F |
6.3 Maldives Processed Food Market, By Application |
6.3.1 Overview and Analysis |
6.3.2 Maldives Processed Food Market Revenues & Volume, By Baked foods, 2022 - 2032F |
6.3.3 Maldives Processed Food Market Revenues & Volume, By Baby food, 2022 - 2032F |
6.3.4 Maldives Processed Food Market Revenues & Volume, By Breakfast Cereal, 2022 - 2032F |
6.3.5 Maldives Processed Food Market Revenues & Volume, By Biscuits, 2022 - 2032F |
6.3.6 Maldives Processed Food Market Revenues & Volume, By Cheese, 2022 - 2032F |
6.3.7 Maldives Processed Food Market Revenues & Volume, By Chocolate confectionary, 2022 - 2032F |
6.3.8 Maldives Processed Food Market Revenues & Volume, By Instant Noodles, 2022 - 2032F |
6.3.9 Maldives Processed Food Market Revenues & Volume, By Instant Noodles, 2022 - 2032F |
7 Maldives Processed Food Market Import-Export Trade Statistics |
7.1 Maldives Processed Food Market Export to Major Countries |
7.2 Maldives Processed Food Market Imports from Major Countries |
8 Maldives Processed Food Market Key Performance Indicators |
8.1 Consumer preferences and trends towards specific types of processed food products. |
8.2 Market penetration of international processed food brands in the Maldives. |
8.3 Adoption rate of innovative packaging and marketing strategies by processed food manufacturers in the Maldives. |
9 Maldives Processed Food Market - Opportunity Assessment |
9.1 Maldives Processed Food Market Opportunity Assessment, By Process, 2022 & 2032F |
9.2 Maldives Processed Food Market Opportunity Assessment, By Product type, 2022 & 2032F |
9.3 Maldives Processed Food Market Opportunity Assessment, By Application, 2022 & 2032F |
10 Maldives Processed Food Market - Competitive Landscape |
10.1 Maldives Processed Food Market Revenue Share, By Companies, 2025 |
10.2 Maldives Processed Food Market Competitive Benchmarking, By Operating and Technical Parameters |
11 Company Profiles |
12 Recommendations | 13 Disclaimer |
Global Go To Market Strategy - 2030
Export potential enables firms to identify high-growth global markets with greater confidence by combining advanced trade intelligence with a structured quantitative methodology. The framework analyzes emerging demand trends and country-level import patterns while integrating macroeconomic and trade datasets such as GDP and population forecasts, bilateral import–export flows, tariff structures, elasticity differentials between developed and developing economies, geographic distance, and import demand projections. Using weighted trade values from 2020–2024 as the base period to project country-to-country export potential for 2030, these inputs are operationalized through calculated drivers such as gravity model parameters, tariff impact factors, and projected GDP per-capita growth. Through an analysis of hidden potentials, demand hotspots, and market conditions that are most favorable to success, this method enables firms to focus on target countries, maximize returns, and global expansion with data, backed by accuracy.
By factoring in the projected importer demand gap that is currently unmet and could be potential opportunity, it identifies the potential for the Exporter (Country) among 190 countries, against the general trade analysis, which identifies the biggest importer or exporter.
To discover high-growth global markets and optimize your business strategy:
Click Here
Pricing
- Single User License$ 1,995
- Department License$ 2,400
- Site License$ 3,120
- Global License$ 3,795

Leadership Perspectives from Industry Events
Search
Thought Leadership and Analyst Meet


Our Clients
6WResearch In News
- Doha a strategic location for EV manufacturing hub: IPA Qatar
- Demand for luxury TVs surging in the GCC, says Samsung
- Empowering Growth: The Thriving Journey of Bangladesh’s Cable Industry
- Demand for luxury TVs surging in the GCC, says Samsung
- Video call with a traditional healer? Once unthinkable, it’s now common in South Africa
- Intelligent Buildings To Smooth GCC’s Path To Net Zero
Latest Reports
- New Zealand Aseptic Manufacturing Market (2026-2032)
- Netherlands Aseptic Manufacturing Market (2026-2032)
- Nauru Aseptic Manufacturing Market (2026-2032)
- Namibia Aseptic Manufacturing Market (2026-2032)
- Mozambique Aseptic Manufacturing Market (2026-2032)
- Montenegro Aseptic Manufacturing Market (2026-2032)
- Mongolia Aseptic Manufacturing Market (2026-2032)
- Monaco Aseptic Manufacturing Market (2026-2032)
- Micronesia Aseptic Manufacturing Market (2026-2032)
- Mauritius Aseptic Manufacturing Market (2026-2032)
Industry Events and Analyst Meet

HIMTEX 2026

India Refining Summit 2026

India EV Show 2026

EV tech India Expo 2026

Auto Tech Asia 2026
Whitepaper
- Middle East & Africa Commercial Security Market Click here to view more.
- Middle East & Africa Fire Safety Systems & Equipment Market Click here to view more.
- GCC Drone Market Click here to view more.
- Middle East Lighting Fixture Market Click here to view more.
- GCC Physical & Perimeter Security Market Click here to view more.