Malta Automated Curtains Market (2026-2032) | Value, Size & Revenue, Industry, Growth, Forecast, Companies, Segmentation, Competitive Landscape, Share, Trends, Analysis, Outlook
Market Forecast By Product (Ripplefold, Pinch Pleat), By Application (Residential, Commercial) And Competitive Landscape
| Product Code: ETC8186142 | Publication Date: Sep 2024 | Updated Date: Apr 2026 | Product Type: Market Research Report | |
| Publisher: 6Wresearch | Author: Sumit Sagar | No. of Pages: 75 | No. of Figures: 35 | No. of Tables: 20 |
Malta Automated Curtains Market Size (2020-2030)
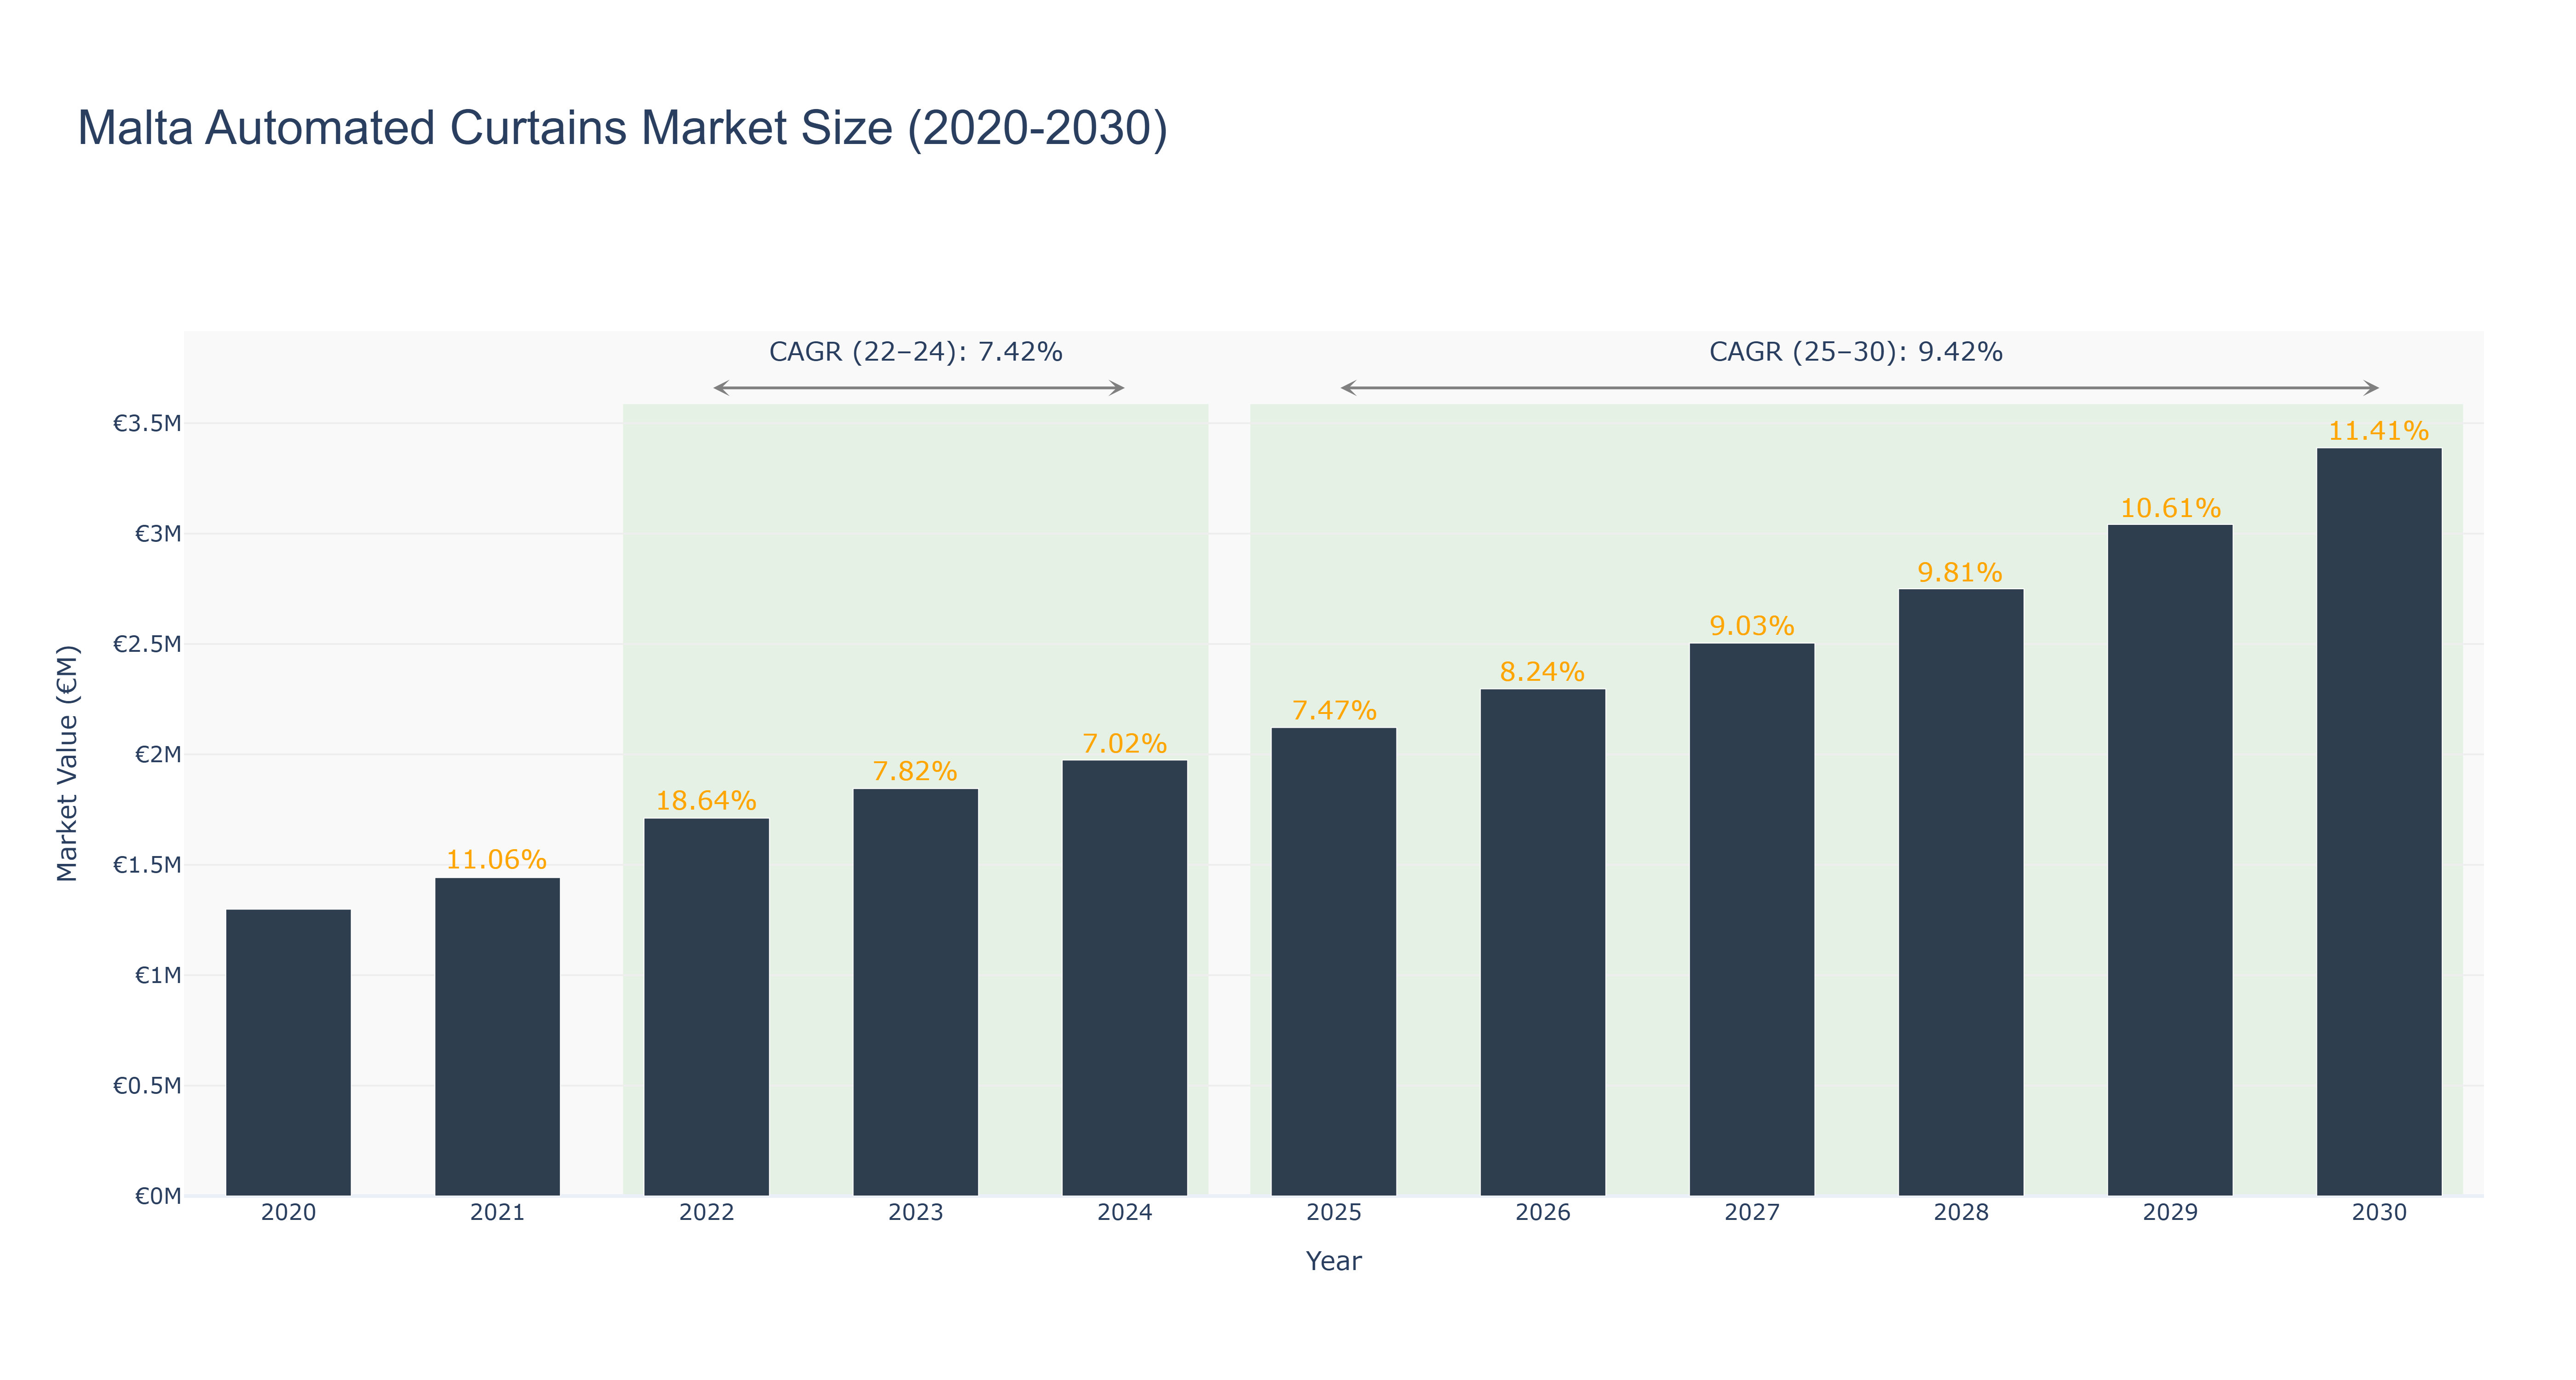
Malta Automated Curtains Market has shown a steady growth trajectory over the years. The peak market size of €3.39 million is forecasted for 2030, with an impressive CAGR of 9.42% from 2025 to 2030. The market size has grown from €1.30 million in 2020 to €1.97 million in 2024, indicating a consistent upward trend. The CAGR from 2022 to 2024 was 7.42%, reflecting a stable growth phase. The industry drivers for this market include increasing demand for smart home solutions and the integration of automation technologies. Looking ahead, upcoming projects in Malta include the implementation of energy-efficient automated curtain systems in commercial buildings, further driving market growth in the near future.
Malta Automated Curtains Market: Production & Trade Performance (2019-2025)
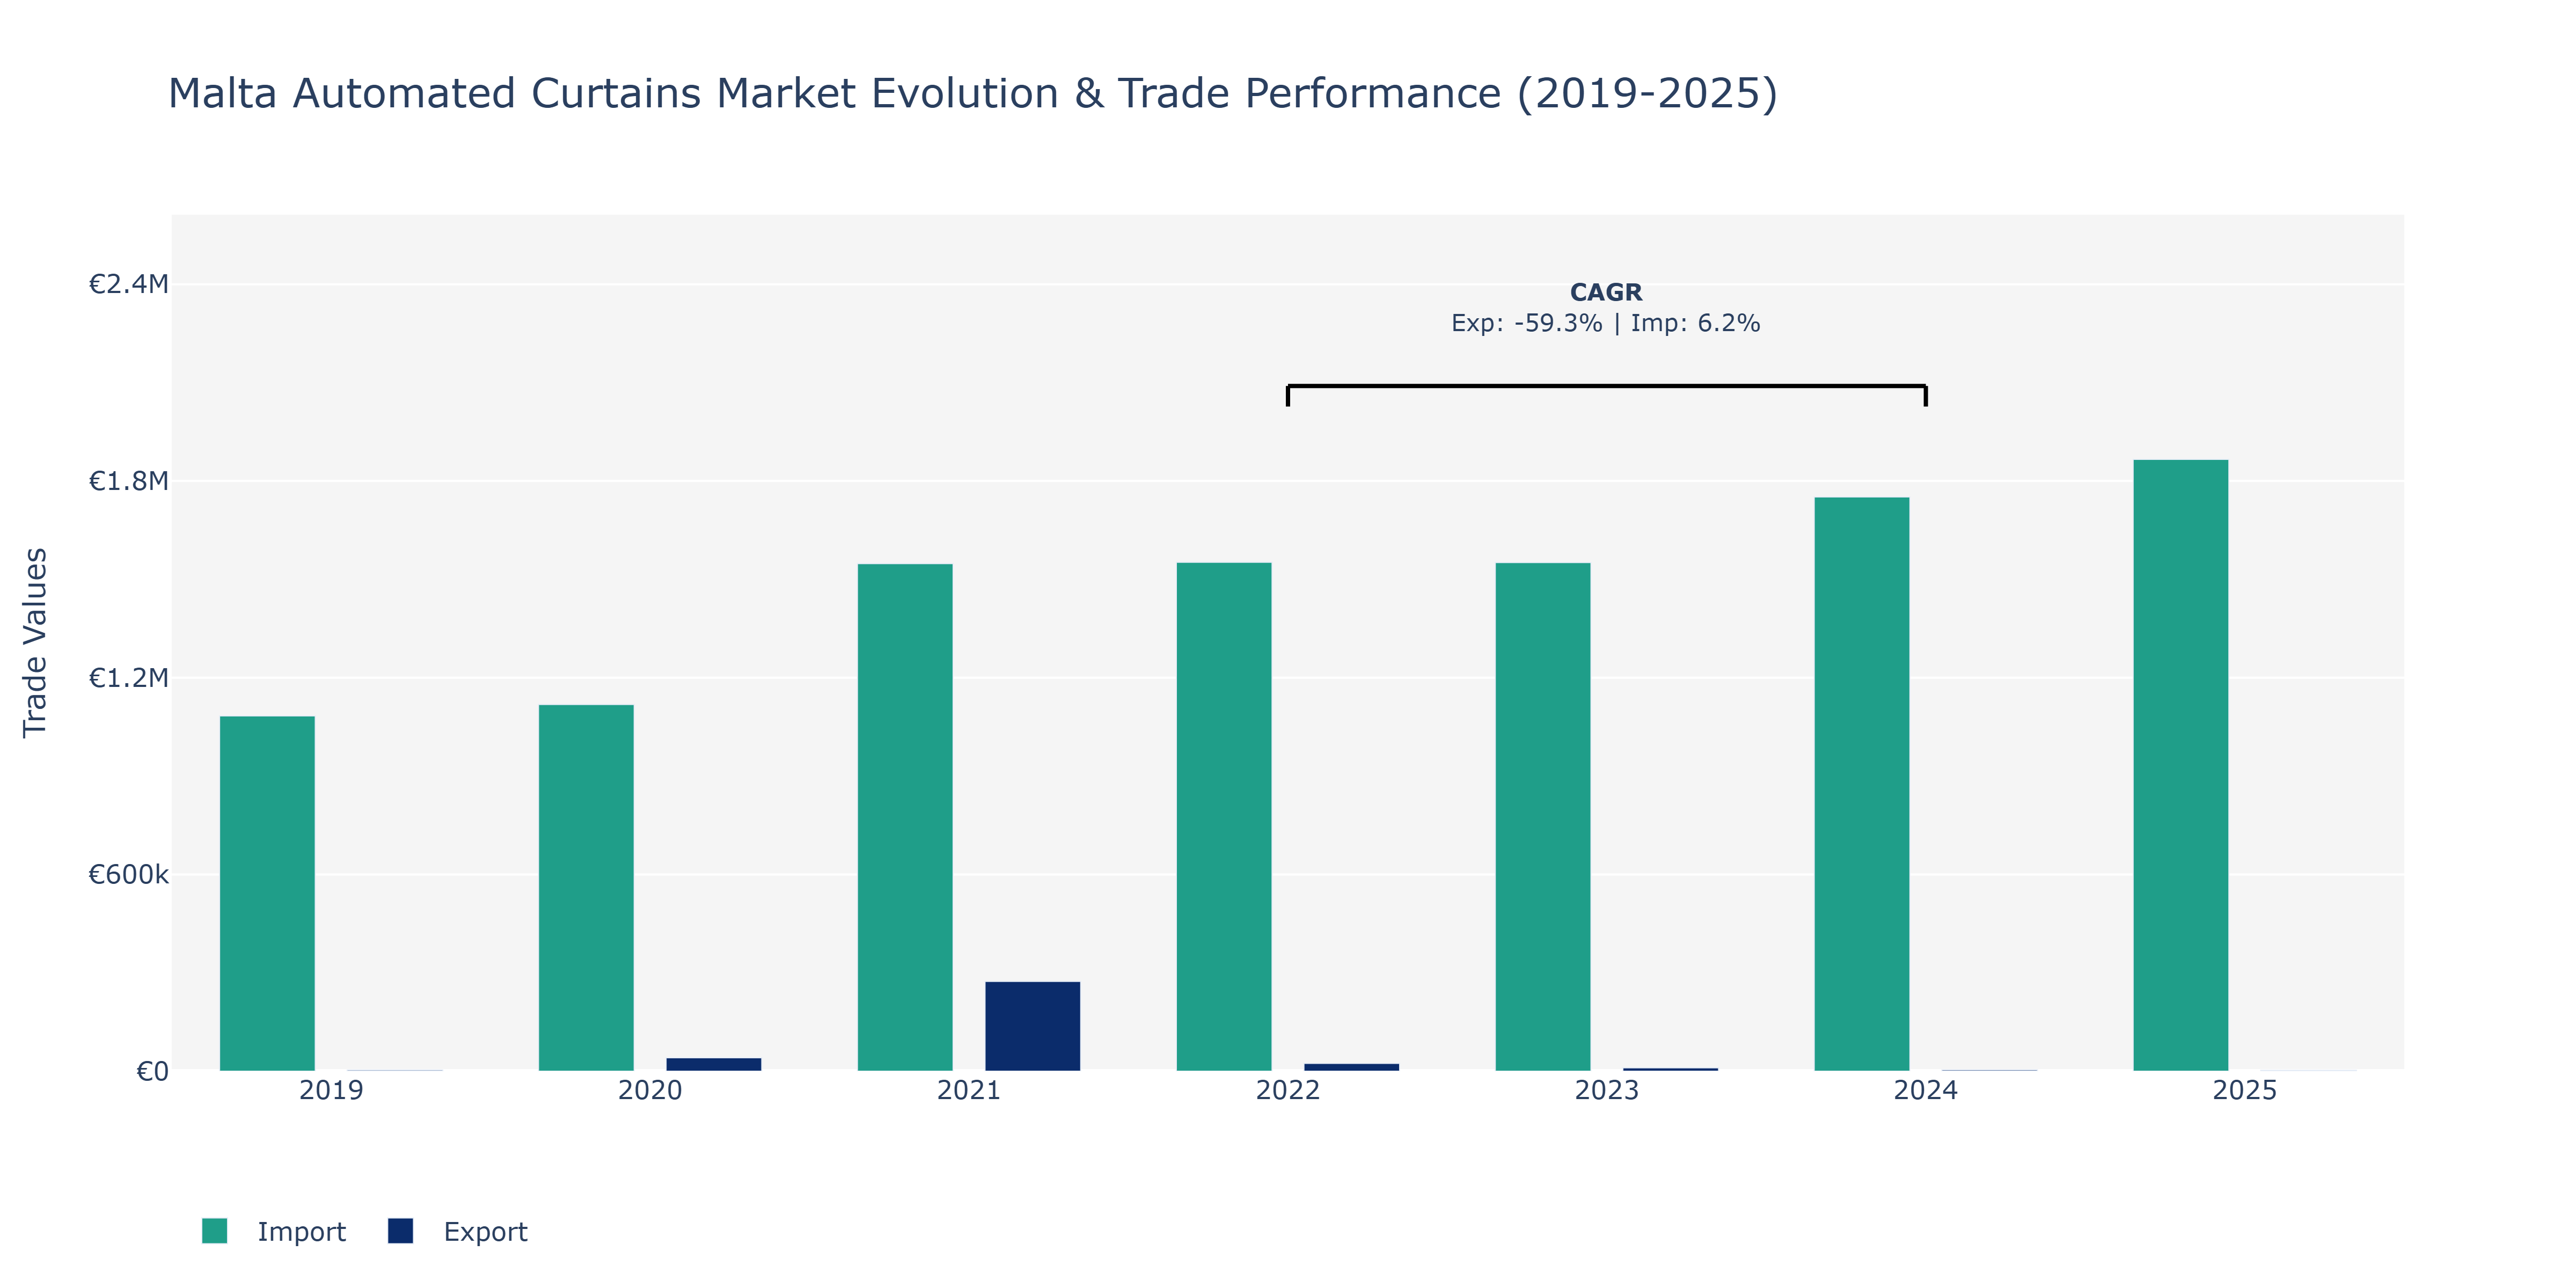
In the Malta Automated Curtains Market, exports saw fluctuations over the years, starting at €3.78 thousand in 2019 and peaking at €273.83 thousand in 2021 before declining to €2.95 thousand in 2025. This downward trend could be attributed to global economic uncertainties affecting consumer spending behaviors and supply chain disruptions impacting export capabilities. In contrast, imports consistently increased from €1.08 million in 2019 to €1.87 million in 2025, showcasing a steady growth trajectory. The rise in imports may be linked to the demand for advanced automated curtain technologies not locally produced, indicating Malta's reliance on foreign suppliers for such products. The observed divergent trends in exports and imports underscore the market's dependence on international trade dynamics and technological advancements shaping consumer preferences in the automated curtains sector.
Key Highlights of the Report:
- Malta Automated Curtains Market Outlook
- Market Size of Malta Automated Curtains Market, 2025
- Forecast of Malta Automated Curtains Market, 2032
- Historical Data and Forecast of Malta Automated Curtains Revenues & Volume for the Period 2022 - 2032
- Malta Automated Curtains Market Trend Evolution
- Malta Automated Curtains Market Drivers and Challenges
- Malta Automated Curtains Price Trends
- Malta Automated Curtains Porter's Five Forces
- Malta Automated Curtains Industry Life Cycle
- Historical Data and Forecast of Malta Automated Curtains Market Revenues & Volume By Product for the Period 2022 - 2032
- Historical Data and Forecast of Malta Automated Curtains Market Revenues & Volume By Ripplefold for the Period 2022 - 2032
- Historical Data and Forecast of Malta Automated Curtains Market Revenues & Volume By Pinch Pleat for the Period 2022 - 2032
- Historical Data and Forecast of Malta Automated Curtains Market Revenues & Volume By Application for the Period 2022 - 2032
- Historical Data and Forecast of Malta Automated Curtains Market Revenues & Volume By Residential for the Period 2022 - 2032
- Historical Data and Forecast of Malta Automated Curtains Market Revenues & Volume By Commercial for the Period 2022 - 2032
- Malta Automated Curtains Import Export Trade Statistics
- Market Opportunity Assessment By Product
- Market Opportunity Assessment By Application
- Malta Automated Curtains Top Companies Market Share
- Malta Automated Curtains Competitive Benchmarking By Technical and Operational Parameters
- Malta Automated Curtains Company Profiles
- Malta Automated Curtains Key Strategic Recommendations
Frequently Asked Questions About the Market Study (FAQs):
6Wresearch actively monitors the Malta Automated Curtains Market and publishes its comprehensive annual report, highlighting emerging trends, growth drivers, revenue analysis, and forecast outlook. Our insights help businesses to make data-backed strategic decisions with ongoing market dynamics. Our analysts track relevent industries related to the Malta Automated Curtains Market, allowing our clients with actionable intelligence and reliable forecasts tailored to emerging regional needs.
Yes, we provide customisation as per your requirements. To learn more, feel free to contact us on sales@6wresearch.com
1 Executive Summary |
2 Introduction |
2.1 Key Highlights of the Report |
2.2 Report Description |
2.3 Market Scope & Segmentation |
2.4 Research Methodology |
2.5 Assumptions |
3 Malta Automated Curtains Market Overview |
3.1 Malta Country Macro Economic Indicators |
3.2 Malta Automated Curtains Market Revenues & Volume, 2022 & 2032F |
3.3 Malta Automated Curtains Market - Industry Life Cycle |
3.4 Malta Automated Curtains Market - Porter's Five Forces |
3.5 Malta Automated Curtains Market Revenues & Volume Share, By Product, 2022 & 2032F |
3.6 Malta Automated Curtains Market Revenues & Volume Share, By Application, 2022 & 2032F |
4 Malta Automated Curtains Market Dynamics |
4.1 Impact Analysis |
4.2 Market Drivers |
4.2.1 Increasing demand for smart home automation solutions in Malta |
4.2.2 Growing awareness about the benefits of automated curtains such as energy efficiency and convenience |
4.2.3 Technological advancements leading to more affordable and efficient automated curtain systems |
4.3 Market Restraints |
4.3.1 High initial cost of automated curtain systems may deter price-sensitive consumers |
4.3.2 Limited availability of skilled professionals for installation and maintenance of automated curtain systems in Malta |
5 Malta Automated Curtains Market Trends |
6 Malta Automated Curtains Market, By Types |
6.1 Malta Automated Curtains Market, By Product |
6.1.1 Overview and Analysis |
6.1.2 Malta Automated Curtains Market Revenues & Volume, By Product, 2022 - 2032F |
6.1.3 Malta Automated Curtains Market Revenues & Volume, By Ripplefold, 2022 - 2032F |
6.1.4 Malta Automated Curtains Market Revenues & Volume, By Pinch Pleat, 2022 - 2032F |
6.2 Malta Automated Curtains Market, By Application |
6.2.1 Overview and Analysis |
6.2.2 Malta Automated Curtains Market Revenues & Volume, By Residential, 2022 - 2032F |
6.2.3 Malta Automated Curtains Market Revenues & Volume, By Commercial, 2022 - 2032F |
7 Malta Automated Curtains Market Import-Export Trade Statistics |
7.1 Malta Automated Curtains Market Export to Major Countries |
7.2 Malta Automated Curtains Market Imports from Major Countries |
8 Malta Automated Curtains Market Key Performance Indicators |
8.1 Adoption rate of home automation systems in Malta |
8.2 Number of new residential construction projects integrating automated curtain systems |
8.3 Average energy savings reported by households using automated curtains |
9 Malta Automated Curtains Market - Opportunity Assessment |
9.1 Malta Automated Curtains Market Opportunity Assessment, By Product, 2022 & 2032F |
9.2 Malta Automated Curtains Market Opportunity Assessment, By Application, 2022 & 2032F |
10 Malta Automated Curtains Market - Competitive Landscape |
10.1 Malta Automated Curtains Market Revenue Share, By Companies, 2025 |
10.2 Malta Automated Curtains Market Competitive Benchmarking, By Operating and Technical Parameters |
11 Company Profiles |
12 Recommendations |
13 Disclaimer |
Export potential assessment - trade Analytics for 2030
Export potential enables firms to identify high-growth global markets with greater confidence by combining advanced trade intelligence with a structured quantitative methodology. The framework analyzes emerging demand trends and country-level import patterns while integrating macroeconomic and trade datasets such as GDP and population forecasts, bilateral import–export flows, tariff structures, elasticity differentials between developed and developing economies, geographic distance, and import demand projections. Using weighted trade values from 2020–2024 as the base period to project country-to-country export potential for 2030, these inputs are operationalized through calculated drivers such as gravity model parameters, tariff impact factors, and projected GDP per-capita growth. Through an analysis of hidden potentials, demand hotspots, and market conditions that are most favorable to success, this method enables firms to focus on target countries, maximize returns, and global expansion with data, backed by accuracy.
By factoring in the projected importer demand gap that is currently unmet and could be potential opportunity, it identifies the potential for the Exporter (Country) among 190 countries, against the general trade analysis, which identifies the biggest importer or exporter.
To discover high-growth global markets and optimize your business strategy:
Click Here
Pricing
- Single User License$ 1,995
- Department License$ 2,400
- Site License$ 3,120
- Global License$ 3,795

Search
Thought Leadership and Analyst Meet


Our Clients
Latest Reports
- France Thermally Conductive Filler Dispersants Market (2026-2032) | Challenges, Restraints, Value, Share, Size, segmentation, Analysis, Trends, Investment Opportunities, Outlook, Pricing, Demand, Forecast, Revenue, Companies, Growth, Drivers, Strategy, Insights, Competition
- Egypt Thermally Conductive Filler Dispersants Market (2026-2032) | Competition, Forecast, Strategy, Value, Insights, Outlook, Investment Opportunities, Pricing, Demand, Share, segmentation, Drivers, Size, Companies, Restraints, Growth, Trends, Revenue, Challenges, Analysis
- Czech Republic Thermally Conductive Filler Dispersants Market (2026-2032) | Forecast, Pricing, Analysis, Drivers, Insights, Size, Demand, Growth, Challenges, segmentation, Competition, Outlook, Trends, Investment Opportunities, Companies, Strategy, Revenue, Share, Value, Restraints
- Colombia Thermally Conductive Filler Dispersants Market (2026-2032) | segmentation, Trends, Share, Drivers, Strategy, Companies, Demand, Insights, Size, Challenges, Value, Competition, Analysis, Growth, Revenue, Restraints, Forecast, Pricing, Outlook, Investment Opportunities
- China Thermally Conductive Filler Dispersants Market (2026-2032) | Restraints, Investment Opportunities, Pricing, Companies, Share, Size, Challenges, Trends, Outlook, Value, Analysis, Competition, Revenue, Drivers, Forecast, Demand, Insights, Growth, Strategy, segmentation
- Chile Thermally Conductive Filler Dispersants Market (2026-2032) | Investment Opportunities, Trends, Value, Restraints, Share, Companies, Forecast, segmentation, Pricing, Challenges, Demand, Size, Analysis, Drivers, Outlook, Growth, Competition, Strategy, Revenue, Insights
- Cambodia Thermally Conductive Filler Dispersants Market (2026-2032) | Analysis, Share, Outlook, Strategy, Pricing, Demand, Size, Growth, segmentation, Insights, Revenue, Forecast, Challenges, Competition, Companies, Investment Opportunities, Trends, Restraints, Value, Drivers
- Brazil Thermally Conductive Filler Dispersants Market (2026-2032) | Restraints, Forecast, Competition, Size, Revenue, Value, Investment Opportunities, Trends, Insights, Outlook, Growth, Analysis, Drivers, segmentation, Pricing, Challenges, Strategy, Share, Companies, Demand
- Bangladesh Thermally Conductive Filler Dispersants Market (2026-2032) | Restraints, Trends, Analysis, Competition, Insights, Forecast, Value, Investment Opportunities, Pricing, Share, Demand, Outlook, Revenue, segmentation, Companies, Drivers, Growth, Size, Challenges, Strategy
- Bahrain Thermally Conductive Filler Dispersants Market (2026-2032) | Trends, Outlook, Pricing, Demand, Value, Competition, Forecast, Growth, segmentation, Revenue, Companies, Analysis, Insights, Size, Drivers, Challenges, Strategy, Investment Opportunities, Share, Restraints
Industry Events and Analyst Meet

HIMTEX 2026

India Refining Summit 2026

India EV Show 2026

EV tech India Expo 2026

Auto Tech Asia 2026
Whitepaper
- Middle East & Africa Commercial Security Market Click here to view more.
- Middle East & Africa Fire Safety Systems & Equipment Market Click here to view more.
- GCC Drone Market Click here to view more.
- Middle East Lighting Fixture Market Click here to view more.
- GCC Physical & Perimeter Security Market Click here to view more.
6WResearch In News
- Doha a strategic location for EV manufacturing hub: IPA Qatar
- Demand for luxury TVs surging in the GCC, says Samsung
- Empowering Growth: The Thriving Journey of Bangladesh’s Cable Industry
- Demand for luxury TVs surging in the GCC, says Samsung
- Video call with a traditional healer? Once unthinkable, it’s now common in South Africa
- Intelligent Buildings To Smooth GCC’s Path To Net Zero