Malta Epichlorohydrin (ECH) Market (2025-2031) | Industry, Share, Analysis, Size, Outlook, Growth, Segmentation, Revenue, Trends, Forecast, Companies & Value
Market Forecast By Applications (Epoxy Resins, Synthetic Glycerin, Water Treatment Chemicals, Pharmaceuticals), By End Use (Paints & Applications, Electrical & Electronics, Construction, Wind Turbine, Composites, Adhesives, Others) And Competitive Landscape
| Product Code: ETC5690318 | Publication Date: Nov 2023 | Updated Date: Apr 2026 | Product Type: Market Research Report | |
| Publisher: 6Wresearch | Author: Ravi Bhandari | No. of Pages: 60 | No. of Figures: 30 | No. of Tables: 5 |
Malta Epichlorohydrin (Ech) Market Size (2020-2030)
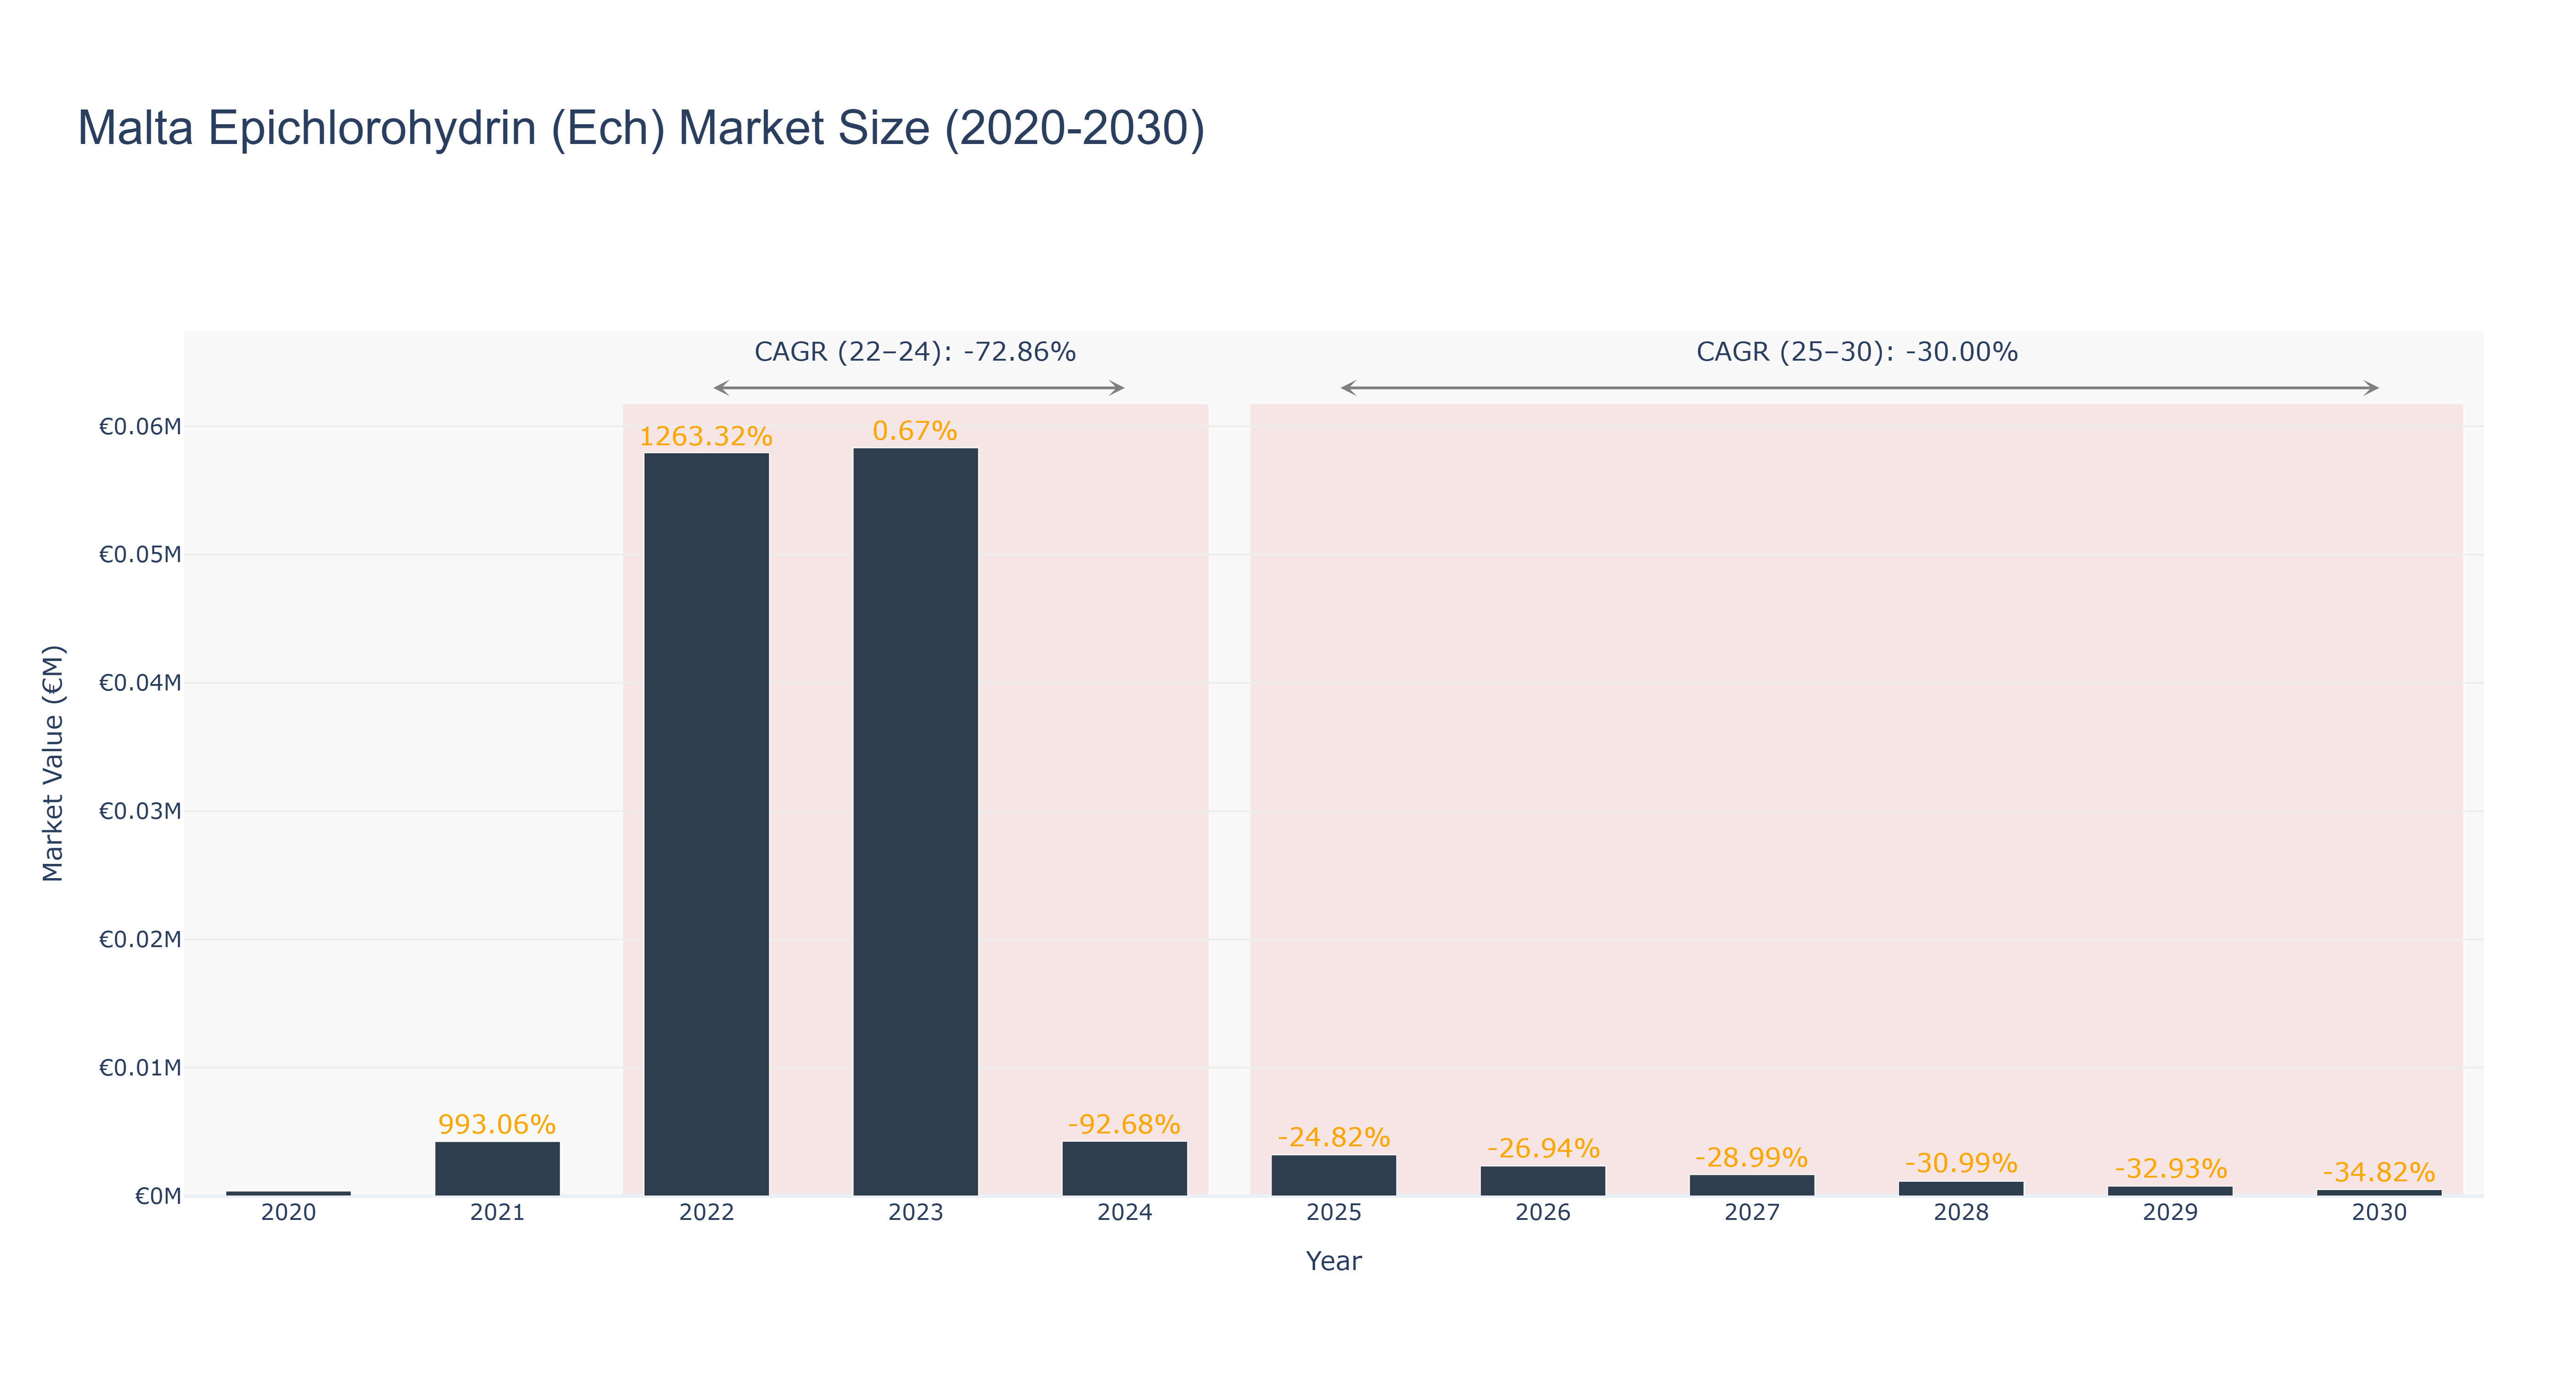
The Malta Epichlorohydrin (Ech) Market has exhibited a volatile trajectory, witnessing remarkable growth followed by significant declines. The market peaked in 2022 with a size of €57.94 thousand, reflecting an extraordinary growth rate of 1263.32% from the previous year. However, this momentum was short-lived, as the market size dropped sharply to €4.27 thousand in 2024, resulting in a negative CAGR of -72.86% for the actual period from 2022 to 2024. Looking ahead, the forecasted period from 2025 to 2030 anticipates further contraction, with projected market sizes declining to €502.10 thousand by 2030, representing a CAGR of -30.00%. The anticipated downturn can be attributed to fluctuating demand dynamics, regulatory challenges, and market saturation. While the potential for innovation exists, particularly in sustainable chemical processes, the market must navigate these challenges to stabilize and foster growth in the coming years.
Malta Epichlorohydrin (Ech) Market: Production & Trade Performance (2019-2025)
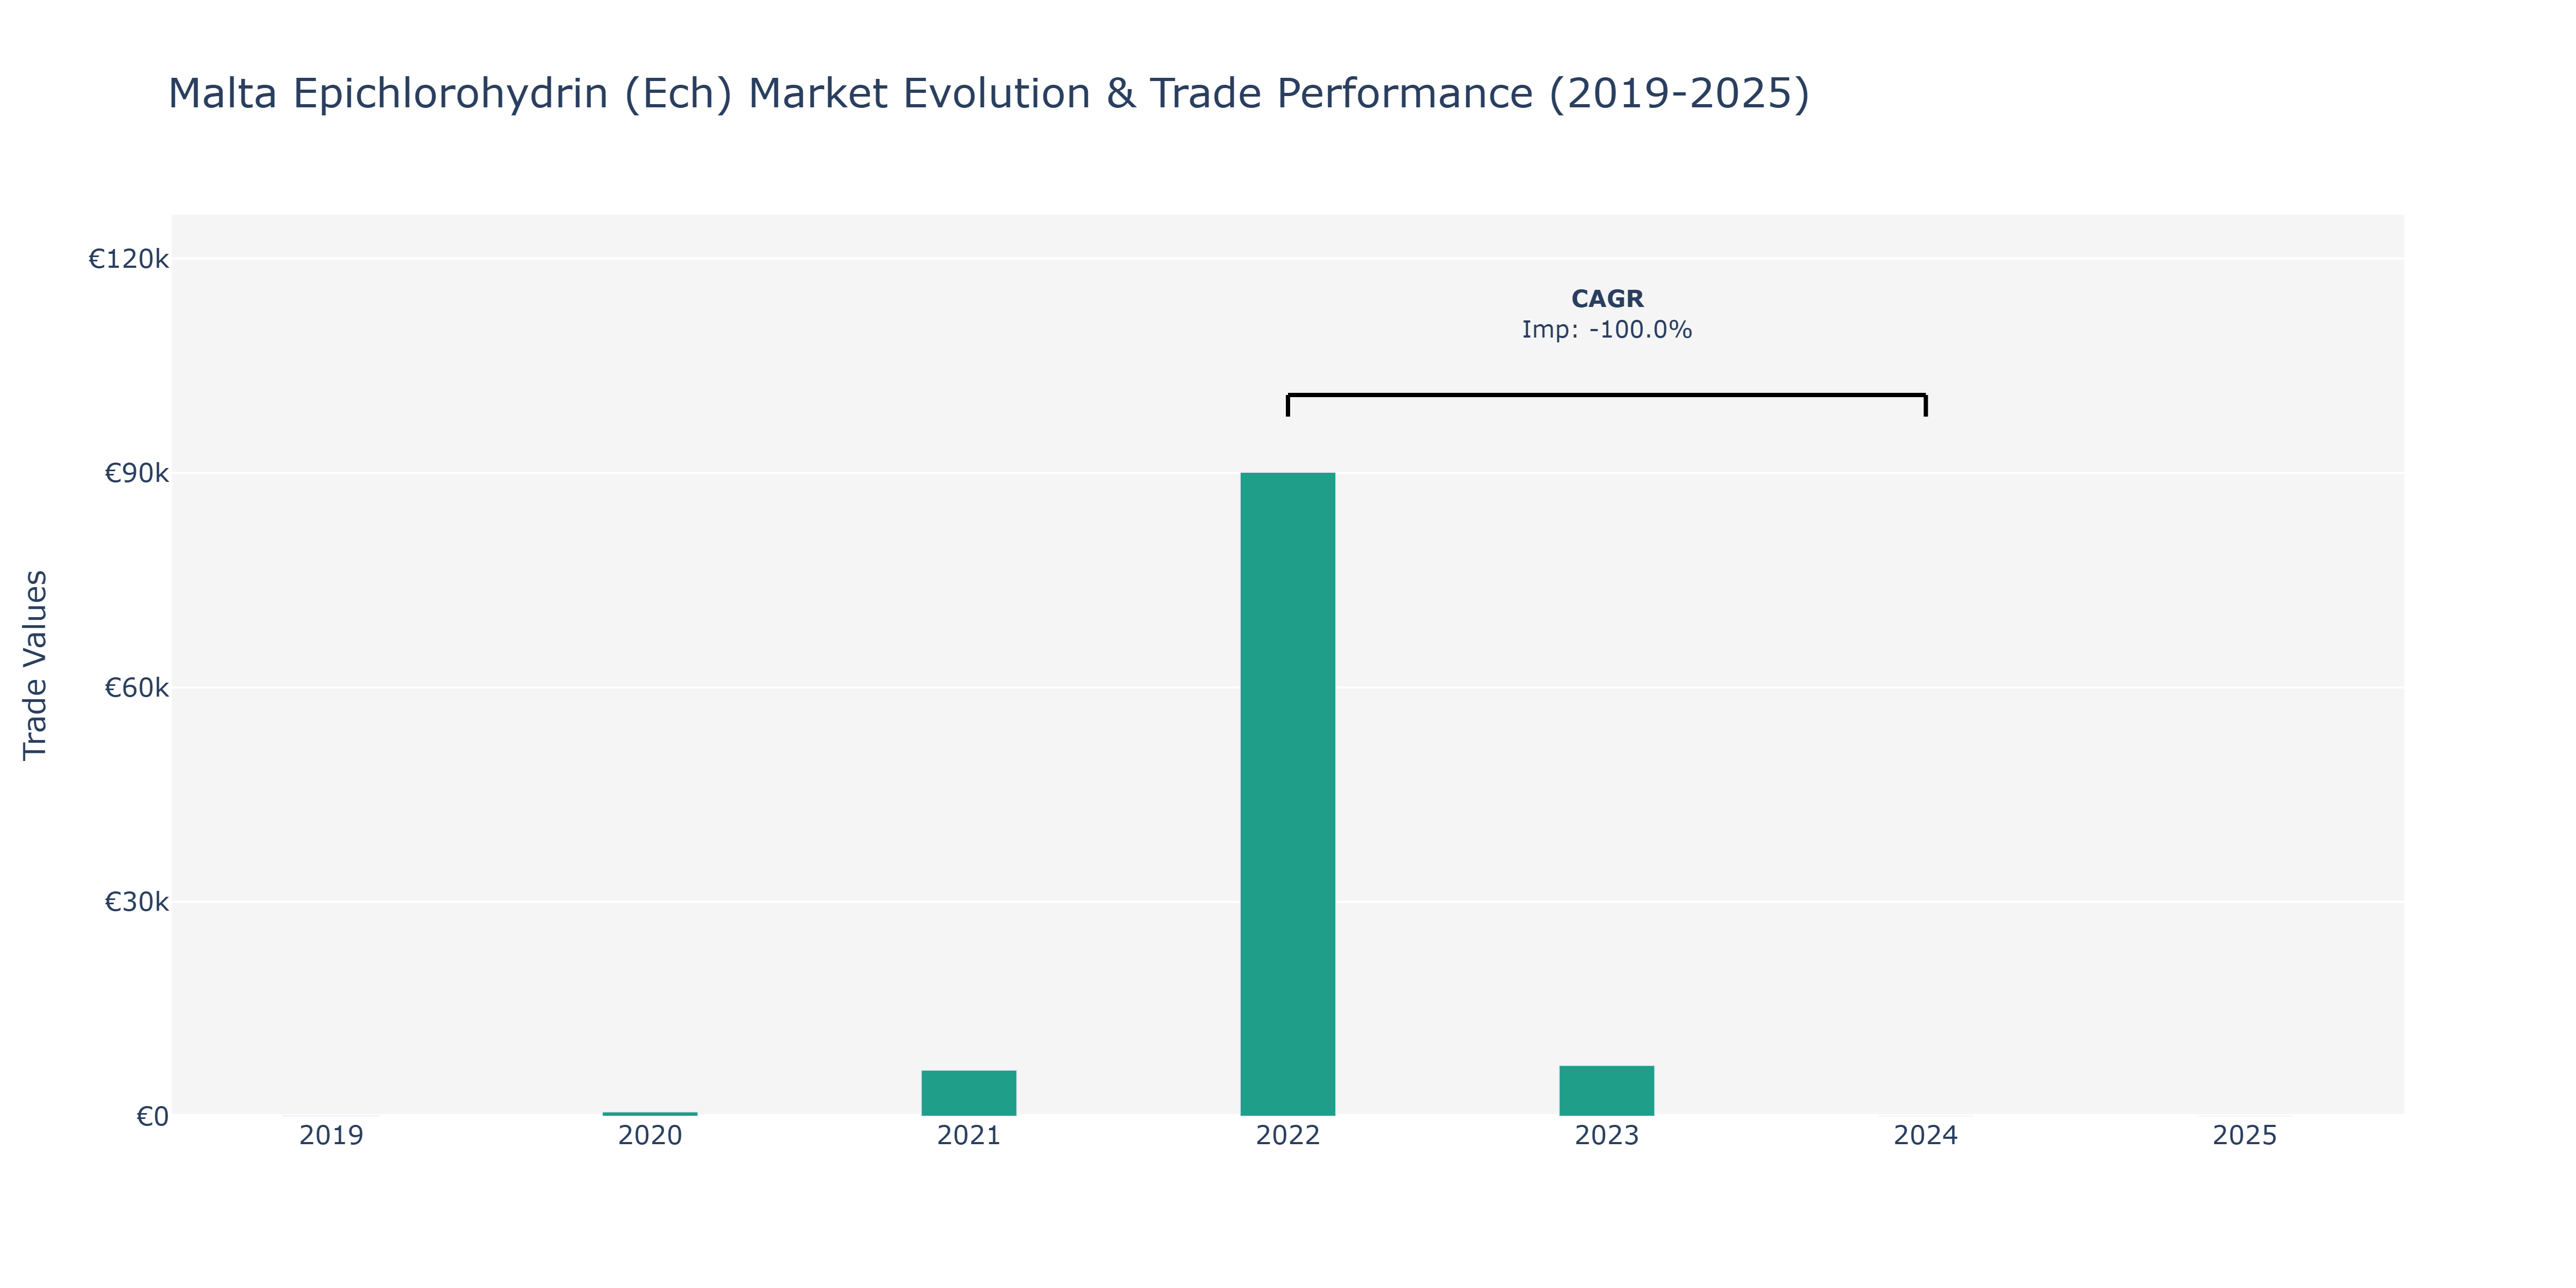
In the Malta Epichlorohydrin (Ech) Market, Imports showcased notable fluctuations over the years. Starting at €30.0 million in 2019, Imports surged significantly to €618.0 million in 2020, marking a considerable rise driven by potentially increased demand or supply chain dynamics. This upward trajectory continued in 2021, with Imports soaring to €6.46 thousand, possibly reflecting strategic market positioning or evolving industry regulations. The peak point was observed in 2022, with Imports reaching €90.1 thousand, indicating a substantial spike that could be attributed to emerging partnerships or technological advancements. However, in 2023, there was a sharp decline to €7.11 thousand, suggesting potential market corrections or external factors impacting trade dynamics. These fluctuations emphasize the market's sensitivity to various internal and external factors, highlighting the need for adaptive strategies to navigate evolving conditions in the Epichlorohydrin sector.
Key Highlights of the Report:
- Malta Epichlorohydrin (ECH) Market Outlook
- Market Size of Malta Epichlorohydrin (ECH) Market, 2024
- Forecast of Malta Epichlorohydrin (ECH) Market, 2031
- Historical Data and Forecast of Malta Epichlorohydrin (ECH) Revenues & Volume for the Period 2021-2031
- Malta Epichlorohydrin (ECH) Market Trend Evolution
- Malta Epichlorohydrin (ECH) Market Drivers and Challenges
- Malta Epichlorohydrin (ECH) Price Trends
- Malta Epichlorohydrin (ECH) Porter`s Five Forces
- Malta Epichlorohydrin (ECH) Industry Life Cycle
- Historical Data and Forecast of Malta Epichlorohydrin (ECH) Market Revenues & Volume By Applications for the Period 2021-2031
- Historical Data and Forecast of Malta Epichlorohydrin (ECH) Market Revenues & Volume By Epoxy Resins for the Period 2021-2031
- Historical Data and Forecast of Malta Epichlorohydrin (ECH) Market Revenues & Volume By Synthetic Glycerin for the Period 2021-2031
- Historical Data and Forecast of Malta Epichlorohydrin (ECH) Market Revenues & Volume By Water Treatment Chemicals for the Period 2021-2031
- Historical Data and Forecast of Malta Epichlorohydrin (ECH) Market Revenues & Volume By Pharmaceuticals for the Period 2021-2031
- Historical Data and Forecast of Malta Epichlorohydrin (ECH) Market Revenues & Volume By End Use for the Period 2021-2031
- Historical Data and Forecast of Malta Epichlorohydrin (ECH) Market Revenues & Volume By Paints & Applications for the Period 2021-2031
- Historical Data and Forecast of Malta Epichlorohydrin (ECH) Market Revenues & Volume By Electrical & Electronics for the Period 2021-2031
- Historical Data and Forecast of Malta Epichlorohydrin (ECH) Market Revenues & Volume By Construction for the Period 2021-2031
- Historical Data and Forecast of Malta Epichlorohydrin (ECH) Market Revenues & Volume By Wind Turbine for the Period 2021-2031
- Historical Data and Forecast of Malta Epichlorohydrin (ECH) Market Revenues & Volume By Composites for the Period 2021-2031
- Historical Data and Forecast of Malta Epichlorohydrin (ECH) Market Revenues & Volume By Adhesives for the Period 2021-2031
- Historical Data and Forecast of Malta Epichlorohydrin (ECH) Market Revenues & Volume By Others for the Period 2021-2031
- Malta Epichlorohydrin (ECH) Import Export Trade Statistics
- Market Opportunity Assessment By Applications
- Market Opportunity Assessment By End Use
- Malta Epichlorohydrin (ECH) Top Companies Market Share
- Malta Epichlorohydrin (ECH) Competitive Benchmarking By Technical and Operational Parameters
- Malta Epichlorohydrin (ECH) Company Profiles
- Malta Epichlorohydrin (ECH) Key Strategic Recommendations
Frequently Asked Questions About the Market Study (FAQs):
6Wresearch actively monitors the Malta Epichlorohydrin (ECH) Market and publishes its comprehensive annual report, highlighting emerging trends, growth drivers, revenue analysis, and forecast outlook. Our insights help businesses to make data-backed strategic decisions with ongoing market dynamics. Our analysts track relevent industries related to the Malta Epichlorohydrin (ECH) Market, allowing our clients with actionable intelligence and reliable forecasts tailored to emerging regional needs.
Yes, we provide customisation as per your requirements. To learn more, feel free to contact us on sales@6wresearch.com
1 Executive Summary |
2 Introduction |
2.1 Key Highlights of the Report |
2.2 Report Description |
2.3 Market Scope & Segmentation |
2.4 Research Methodology |
2.5 Assumptions |
3 Malta Epichlorohydrin (ECH) Market Overview |
3.1 Malta Country Macro Economic Indicators |
3.2 Malta Epichlorohydrin (ECH) Market Revenues & Volume, 2021 & 2031F |
3.3 Malta Epichlorohydrin (ECH) Market - Industry Life Cycle |
3.4 Malta Epichlorohydrin (ECH) Market - Porter's Five Forces |
3.5 Malta Epichlorohydrin (ECH) Market Revenues & Volume Share, By Applications, 2021 & 2031F |
3.6 Malta Epichlorohydrin (ECH) Market Revenues & Volume Share, By End Use, 2021 & 2031F |
4 Malta Epichlorohydrin (ECH) Market Dynamics |
4.1 Impact Analysis |
4.2 Market Drivers |
4.2.1 Increasing demand for epoxy resins in various industries such as construction, automotive, and electronics, which are major end-users of epichlorohydrin. |
4.2.2 Growing awareness and adoption of environmentally friendly products, as epichlorohydrin can be used in the production of biodegradable plastics. |
4.2.3 Rise in infrastructure development projects globally, leading to higher consumption of epoxy resins and subsequently, epichlorohydrin. |
4.3 Market Restraints |
4.3.1 Volatility in raw material prices, such as propylene and chlorine, which are key ingredients in the production of epichlorohydrin. |
4.3.2 Stringent regulations related to environmental pollution and worker safety, which may increase production costs and limit market growth. |
4.3.3 Competition from alternative chemicals or processes that can replace epichlorohydrin in certain applications, affecting market demand. |
5 Malta Epichlorohydrin (ECH) Market Trends |
6 Malta Epichlorohydrin (ECH) Market Segmentations |
6.1 Malta Epichlorohydrin (ECH) Market, By Applications |
6.1.1 Overview and Analysis |
6.1.2 Malta Epichlorohydrin (ECH) Market Revenues & Volume, By Epoxy Resins, 2021-2031F |
6.1.3 Malta Epichlorohydrin (ECH) Market Revenues & Volume, By Synthetic Glycerin, 2021-2031F |
6.1.4 Malta Epichlorohydrin (ECH) Market Revenues & Volume, By Water Treatment Chemicals, 2021-2031F |
6.1.5 Malta Epichlorohydrin (ECH) Market Revenues & Volume, By Pharmaceuticals, 2021-2031F |
6.2 Malta Epichlorohydrin (ECH) Market, By End Use |
6.2.1 Overview and Analysis |
6.2.2 Malta Epichlorohydrin (ECH) Market Revenues & Volume, By Paints & Applications, 2021-2031F |
6.2.3 Malta Epichlorohydrin (ECH) Market Revenues & Volume, By Electrical & Electronics, 2021-2031F |
6.2.4 Malta Epichlorohydrin (ECH) Market Revenues & Volume, By Construction, 2021-2031F |
6.2.5 Malta Epichlorohydrin (ECH) Market Revenues & Volume, By Wind Turbine, 2021-2031F |
6.2.6 Malta Epichlorohydrin (ECH) Market Revenues & Volume, By Composites, 2021-2031F |
6.2.7 Malta Epichlorohydrin (ECH) Market Revenues & Volume, By Adhesives, 2021-2031F |
7 Malta Epichlorohydrin (ECH) Market Import-Export Trade Statistics |
7.1 Malta Epichlorohydrin (ECH) Market Export to Major Countries |
7.2 Malta Epichlorohydrin (ECH) Market Imports from Major Countries |
8 Malta Epichlorohydrin (ECH) Market Key Performance Indicators |
8.1 Average selling price of epichlorohydrin, indicating market trends and demand-supply dynamics. |
8.2 Research and development investments in new applications or production processes for epichlorohydrin, reflecting potential market growth opportunities. |
8.3 Capacity utilization rates of epichlorohydrin manufacturers, showing the level of market activity and demand for the product. |
9 Malta Epichlorohydrin (ECH) Market - Opportunity Assessment |
9.1 Malta Epichlorohydrin (ECH) Market Opportunity Assessment, By Applications, 2021 & 2031F |
9.2 Malta Epichlorohydrin (ECH) Market Opportunity Assessment, By End Use, 2021 & 2031F |
10 Malta Epichlorohydrin (ECH) Market - Competitive Landscape |
10.1 Malta Epichlorohydrin (ECH) Market Revenue Share, By Companies, 2024 |
10.2 Malta Epichlorohydrin (ECH) Market Competitive Benchmarking, By Operating and Technical Parameters |
11 Company Profiles |
12 Recommendations | 13 Disclaimer |
Export potential assessment - trade Analytics for 2030
Export potential enables firms to identify high-growth global markets with greater confidence by combining advanced trade intelligence with a structured quantitative methodology. The framework analyzes emerging demand trends and country-level import patterns while integrating macroeconomic and trade datasets such as GDP and population forecasts, bilateral import–export flows, tariff structures, elasticity differentials between developed and developing economies, geographic distance, and import demand projections. Using weighted trade values from 2020–2024 as the base period to project country-to-country export potential for 2030, these inputs are operationalized through calculated drivers such as gravity model parameters, tariff impact factors, and projected GDP per-capita growth. Through an analysis of hidden potentials, demand hotspots, and market conditions that are most favorable to success, this method enables firms to focus on target countries, maximize returns, and global expansion with data, backed by accuracy.
By factoring in the projected importer demand gap that is currently unmet and could be potential opportunity, it identifies the potential for the Exporter (Country) among 190 countries, against the general trade analysis, which identifies the biggest importer or exporter.
To discover high-growth global markets and optimize your business strategy:
Click Here
Pricing
- Single User License$ 1,995
- Department License$ 2,400
- Site License$ 3,120
- Global License$ 3,795

Search
Thought Leadership and Analyst Meet


Our Clients
Latest Reports
- Philippines Polyhydroxybutyrate-co-Hydroxyvalerate Market (2026-2032) | Trends, Insights, Challenges, Restraints, Competition, Size, Value, Forecast, Pricing, Share, Outlook, Revenue, Investment Opportunities, Strategy, Drivers, Demand, Growth, segmentation, Analysis, Companies
- Peru Polyhydroxybutyrate-co-Hydroxyvalerate Market (2026-2032) | Growth, Demand, Challenges, Share, Trends, Analysis, Pricing, Investment Opportunities, Drivers, Value, Forecast, Competition, Size, Companies, Insights, Outlook, Restraints, segmentation, Revenue, Strategy
- Pakistan Polyhydroxybutyrate-co-Hydroxyvalerate Market (2026-2032) | Restraints, segmentation, Pricing, Forecast, Share, Strategy, Competition, Trends, Insights, Drivers, Challenges, Growth, Revenue, Outlook, Value, Investment Opportunities, Companies, Size, Analysis, Demand
- Oman Polyhydroxybutyrate-co-Hydroxyvalerate Market (2026-2032) | Drivers, segmentation, Insights, Competition, Pricing, Outlook, Size, Revenue, Challenges, Forecast, Analysis, Growth, Value, Share, Trends, Investment Opportunities, Strategy, Restraints, Companies, Demand
- Nigeria Polyhydroxybutyrate-co-Hydroxyvalerate Market (2026-2032) | Value, Investment Opportunities, Analysis, Revenue, Restraints, Pricing, Outlook, Competition, Demand, Growth, Forecast, Companies, Trends, Challenges, segmentation, Drivers, Insights, Share, Size, Strategy
- Nepal Polyhydroxybutyrate-co-Hydroxyvalerate Market (2026-2032) | Insights, Analysis, Drivers, Share, Revenue, Demand, segmentation, Investment Opportunities, Competition, Forecast, Growth, Pricing, Companies, Strategy, Trends, Restraints, Challenges, Outlook, Size, Value
- Myanmar Polyhydroxybutyrate-co-Hydroxyvalerate Market (2026-2032) | Outlook, Revenue, Strategy, Restraints, Drivers, segmentation, Share, Forecast, Competition, Insights, Growth, Pricing, Size, Demand, Value, Companies, Trends, Challenges, Investment Opportunities, Analysis
- Morocco Polyhydroxybutyrate-co-Hydroxyvalerate Market (2026-2032) | Outlook, Investment Opportunities, Restraints, Strategy, Forecast, Challenges, Drivers, Growth, Companies, segmentation, Trends, Size, Competition, Revenue, Demand, Insights, Share, Analysis, Value, Pricing
- Mexico Polyhydroxybutyrate-co-Hydroxyvalerate Market (2026-2032) | Size, Drivers, Outlook, Share, Strategy, Growth, Pricing, Challenges, Companies, Demand, Value, Investment Opportunities, Restraints, Trends, Forecast, segmentation, Analysis, Insights, Competition, Revenue
- Malaysia Polyhydroxybutyrate-co-Hydroxyvalerate Market (2026-2032) | Share, segmentation, Size, Companies, Analysis, Insights, Forecast, Value, Revenue, Drivers, Restraints, Challenges, Investment Opportunities, Trends, Competition, Strategy, Demand, Growth, Outlook, Pricing
Industry Events and Analyst Meet

HIMTEX 2026

India Refining Summit 2026

India EV Show 2026

EV tech India Expo 2026

Auto Tech Asia 2026
Whitepaper
- Middle East & Africa Commercial Security Market Click here to view more.
- Middle East & Africa Fire Safety Systems & Equipment Market Click here to view more.
- GCC Drone Market Click here to view more.
- Middle East Lighting Fixture Market Click here to view more.
- GCC Physical & Perimeter Security Market Click here to view more.
6WResearch In News
- Doha a strategic location for EV manufacturing hub: IPA Qatar
- Demand for luxury TVs surging in the GCC, says Samsung
- Empowering Growth: The Thriving Journey of Bangladesh’s Cable Industry
- Demand for luxury TVs surging in the GCC, says Samsung
- Video call with a traditional healer? Once unthinkable, it’s now common in South Africa
- Intelligent Buildings To Smooth GCC’s Path To Net Zero