Malta Humectants Market (2026-2032) | Share, Outlook, Value, Trends, Size, Industry, Analysis, Growth, Companies, Segmentation, Forecast & Revenue
Market Forecast By Type (Sugar Alcohol, Glycerol, Alpha Hydroxy Acid & Polysaccharides, Glycols), By Application (Food & Beverages, Oral & Personal Care, Pharmaceuticals, Animal Feed), By Source (Synthetic, Natural) And Competitive Landscape
| Product Code: ETC5814008 | Publication Date: Nov 2023 | Updated Date: Apr 2026 | Product Type: Market Research Report | |
| Publisher: 6Wresearch | Author: Ravi Bhandari | No. of Pages: 60 | No. of Figures: 30 | No. of Tables: 5 |
Malta Humectants Market Size (2020-2030)
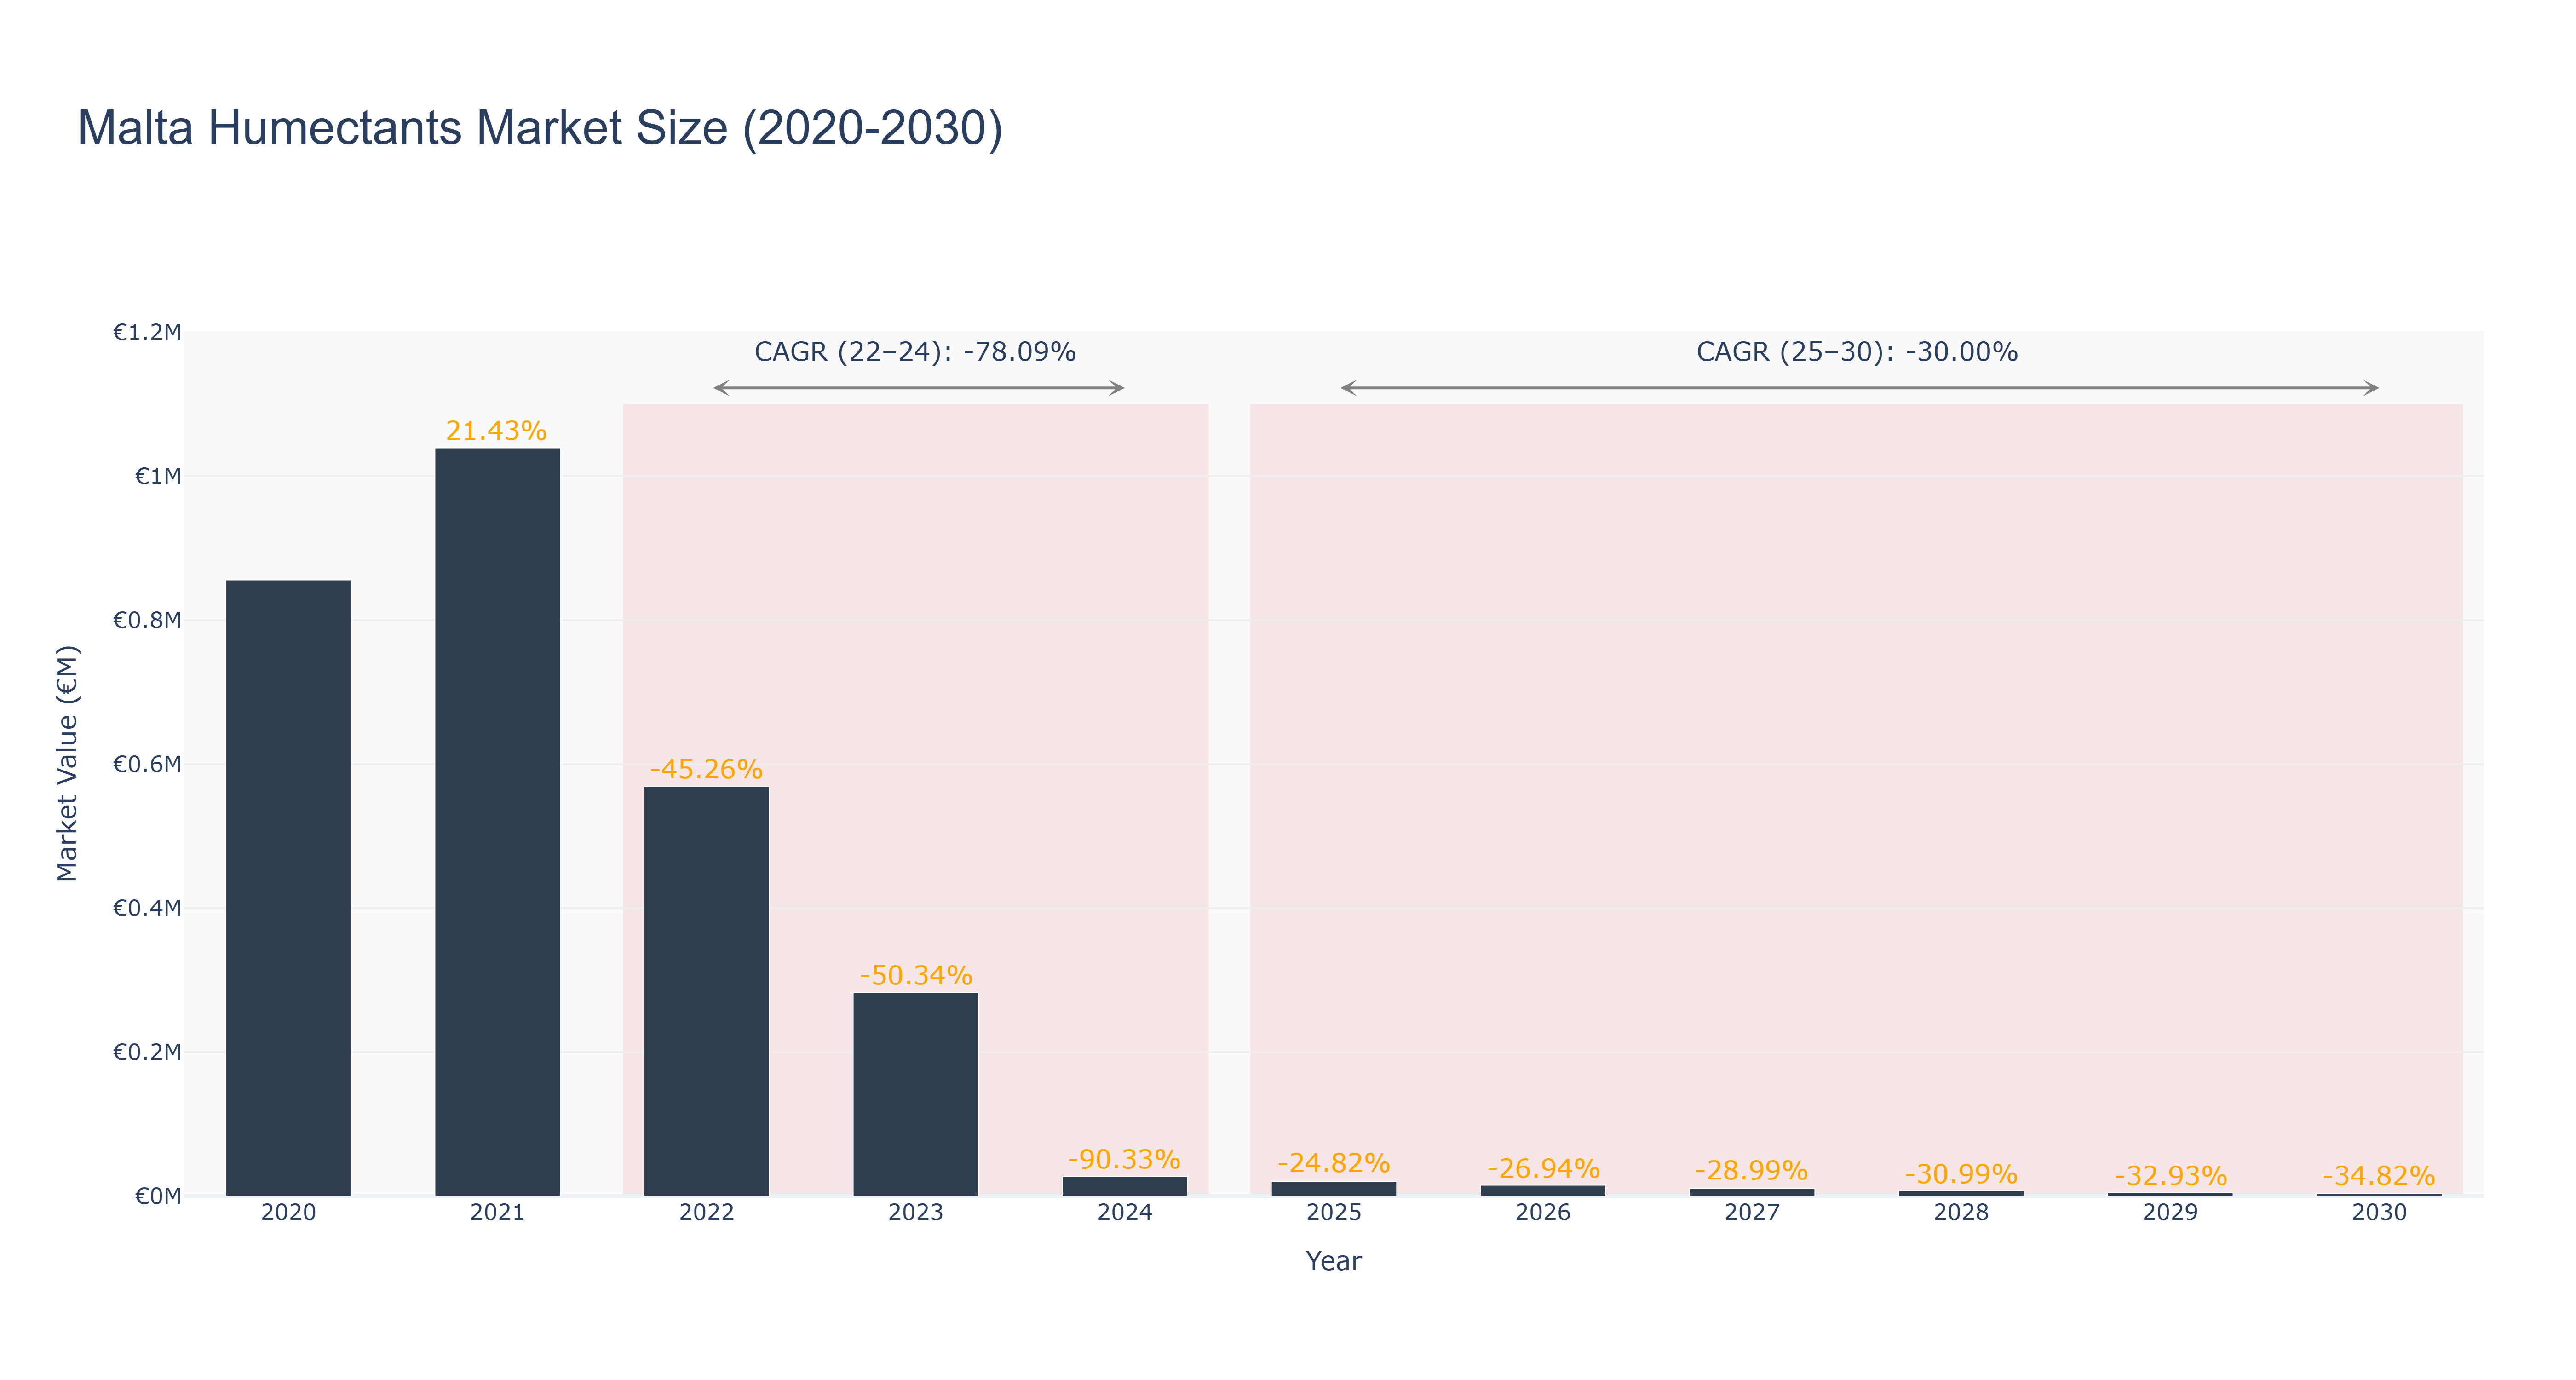
Malta Humectants Market has witnessed a significant decline in market size, reaching €0.02 million in 2025 with a negative CAGR of -26.94% from 2020 to 2026. The market is forecasted to continue shrinking, with a CAGR of -30.0% from 2025 to 2030. The peak market size was observed in 2021 at €1.04 million. The downturn in the market can be attributed to various factors such as changing consumer preferences, economic conditions, and technological advancements impacting the demand for humectants. Looking ahead, the market is expected to face further challenges but could potentially benefit from increased focus on sustainable and organic products. Recent developments suggest a shift towards eco-friendly humectants production methods, indicating a potential avenue for market recovery in the future.
Malta Humectants Market: Production & Trade Performance (2019-2025)
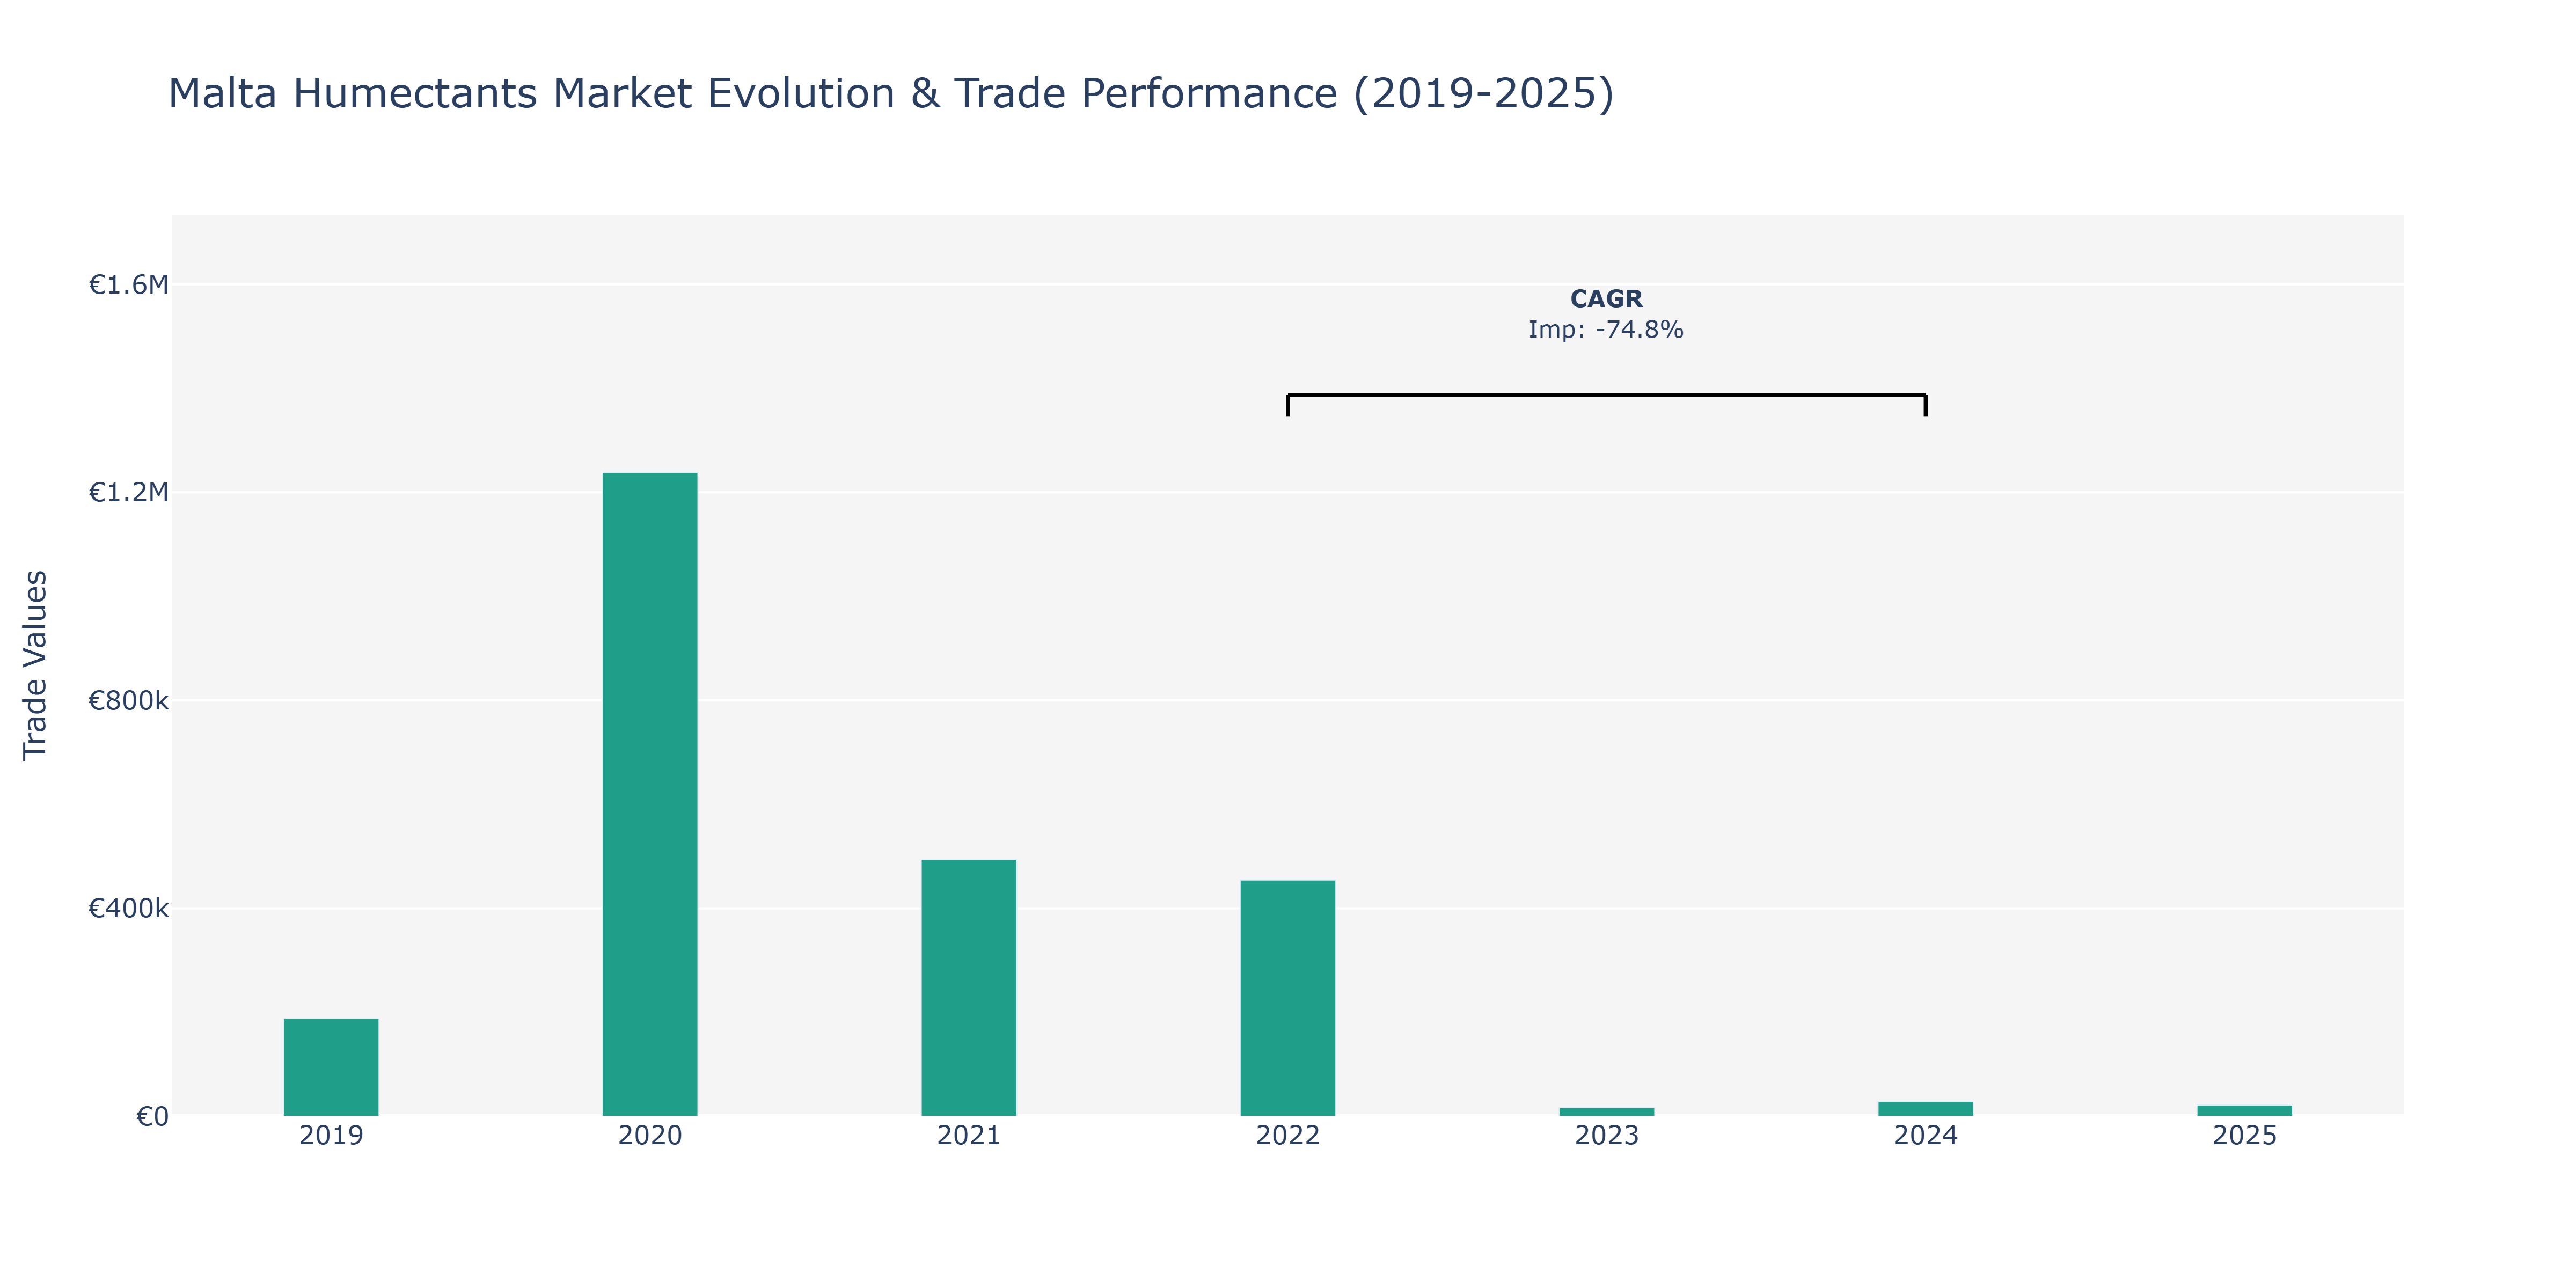
Malta's Humectants Market witnessed varying import levels over the years. In 2020, imports surged to €1.24 million from €188.43 thousand in 2019, indicating a substantial increase driven by heightened demand or supply chain adjustments. The subsequent years saw a notable decline, with imports dropping to €494.17 thousand in 2021 and further decreasing to €16.68 thousand in 2023. This sharp decrease could be attributed to factors like changing consumer preferences, economic conditions, or regulatory changes affecting the market dynamics. Despite a slight uptick to €28.84 thousand in 2024, the market remained significantly below the peak of 2020. The recovery to €21.68 thousand in 2025 suggests a gradual stabilization or strategic shifts within the industry, possibly influenced by emerging market trends or technological advancements enhancing product efficiency and sustainability.
Key Highlights of the Report:
- Malta Humectants Market Outlook
- Market Size of Malta Humectants Market, 2025
- Forecast of Malta Humectants Market, 2032
- Historical Data and Forecast of Malta Humectants Revenues & Volume for the Period 2022 - 2032F
- Malta Humectants Market Trend Evolution
- Malta Humectants Market Drivers and Challenges
- Malta Humectants Price Trends
- Malta Humectants Porter`s Five Forces
- Malta Humectants Industry Life Cycle
- Historical Data and Forecast of Malta Humectants Market Revenues & Volume By Type for the Period 2022 - 2032F
- Historical Data and Forecast of Malta Humectants Market Revenues & Volume By Sugar Alcohol for the Period 2022 - 2032F
- Historical Data and Forecast of Malta Humectants Market Revenues & Volume By Glycerol for the Period 2022 - 2032F
- Historical Data and Forecast of Malta Humectants Market Revenues & Volume By Alpha Hydroxy Acid & Polysaccharides for the Period 2022 - 2032F
- Historical Data and Forecast of Malta Humectants Market Revenues & Volume By Glycols for the Period 2022 - 2032F
- Historical Data and Forecast of Malta Humectants Market Revenues & Volume By Application for the Period 2022 - 2032F
- Historical Data and Forecast of Malta Humectants Market Revenues & Volume By Food & Beverages for the Period 2022 - 2032F
- Historical Data and Forecast of Malta Humectants Market Revenues & Volume By Oral & Personal Care for the Period 2022 - 2032F
- Historical Data and Forecast of Malta Humectants Market Revenues & Volume By Pharmaceuticals for the Period 2022 - 2032F
- Historical Data and Forecast of Malta Humectants Market Revenues & Volume By Animal Feed for the Period 2022 - 2032F
- Historical Data and Forecast of Malta Humectants Market Revenues & Volume By Source for the Period 2022 - 2032F
- Historical Data and Forecast of Malta Humectants Market Revenues & Volume By Synthetic for the Period 2022 - 2032F
- Historical Data and Forecast of Malta Humectants Market Revenues & Volume By Natural for the Period 2022 - 2032F
- Malta Humectants Import Export Trade Statistics
- Market Opportunity Assessment By Type
- Market Opportunity Assessment By Application
- Market Opportunity Assessment By Source
- Malta Humectants Top Companies Market Share
- Malta Humectants Competitive Benchmarking By Technical and Operational Parameters
- Malta Humectants Company Profiles
- Malta Humectants Key Strategic Recommendations
Frequently Asked Questions About the Market Study (FAQs):
6Wresearch actively monitors the Malta Humectants Market and publishes its comprehensive annual report, highlighting emerging trends, growth drivers, revenue analysis, and forecast outlook. Our insights help businesses to make data-backed strategic decisions with ongoing market dynamics. Our analysts track relevent industries related to the Malta Humectants Market, allowing our clients with actionable intelligence and reliable forecasts tailored to emerging regional needs.
Yes, we provide customisation as per your requirements. To learn more, feel free to contact us on sales@6wresearch.com
1 Executive Summary |
2 Introduction |
2.1 Key Highlights of the Report |
2.2 Report Description |
2.3 Market Scope & Segmentation |
2.4 Research Methodology |
2.5 Assumptions |
3 Malta Humectants Market Overview |
3.1 Malta Country Macro Economic Indicators |
3.2 Malta Humectants Market Revenues & Volume, 2022 & 2032F |
3.3 Malta Humectants Market - Industry Life Cycle |
3.4 Malta Humectants Market - Porter's Five Forces |
3.5 Malta Humectants Market Revenues & Volume Share, By Type, 2022 & 2032F |
3.6 Malta Humectants Market Revenues & Volume Share, By Application, 2022 & 2032F |
3.7 Malta Humectants Market Revenues & Volume Share, By Source, 2022 & 2032F |
4 Malta Humectants Market Dynamics |
4.1 Impact Analysis |
4.2 Market Drivers |
4.2.1 Increasing consumer awareness regarding the benefits of using humectants in personal care products |
4.2.2 Growing demand for natural and organic humectants in the market |
4.2.3 Rising disposable income leading to higher spending on premium skincare products |
4.3 Market Restraints |
4.3.1 Fluctuating prices of raw materials used in humectants production |
4.3.2 Stringent regulations and certifications required for the use of humectants in cosmetics |
4.3.3 Competition from synthetic alternatives to humectants |
5 Malta Humectants Market Trends |
6 Malta Humectants Market Segmentations |
6.1 Malta Humectants Market, By Type |
6.1.1 Overview and Analysis |
6.1.2 Malta Humectants Market Revenues & Volume, By Sugar Alcohol, 2022 - 2032F |
6.1.3 Malta Humectants Market Revenues & Volume, By Glycerol, 2022 - 2032F |
6.1.4 Malta Humectants Market Revenues & Volume, By Alpha Hydroxy Acid & Polysaccharides, 2022 - 2032F |
6.1.5 Malta Humectants Market Revenues & Volume, By Glycols, 2022 - 2032F |
6.2 Malta Humectants Market, By Application |
6.2.1 Overview and Analysis |
6.2.2 Malta Humectants Market Revenues & Volume, By Food & Beverages, 2022 - 2032F |
6.2.3 Malta Humectants Market Revenues & Volume, By Oral & Personal Care, 2022 - 2032F |
6.2.4 Malta Humectants Market Revenues & Volume, By Pharmaceuticals, 2022 - 2032F |
6.2.5 Malta Humectants Market Revenues & Volume, By Animal Feed, 2022 - 2032F |
6.3 Malta Humectants Market, By Source |
6.3.1 Overview and Analysis |
6.3.2 Malta Humectants Market Revenues & Volume, By Synthetic, 2022 - 2032F |
6.3.3 Malta Humectants Market Revenues & Volume, By Natural, 2022 - 2032F |
7 Malta Humectants Market Import-Export Trade Statistics |
7.1 Malta Humectants Market Export to Major Countries |
7.2 Malta Humectants Market Imports from Major Countries |
8 Malta Humectants Market Key Performance Indicators |
8.1 Consumer satisfaction and repeat purchase rates |
8.2 Number of new product launches incorporating malta humectants |
8.3 Growth in demand for malta humectants in different application areas |
9 Malta Humectants Market - Opportunity Assessment |
9.1 Malta Humectants Market Opportunity Assessment, By Type, 2022 & 2032F |
9.2 Malta Humectants Market Opportunity Assessment, By Application, 2022 & 2032F |
9.3 Malta Humectants Market Opportunity Assessment, By Source, 2022 & 2032F |
10 Malta Humectants Market - Competitive Landscape |
10.1 Malta Humectants Market Revenue Share, By Companies, 2025 |
10.2 Malta Humectants Market Competitive Benchmarking, By Operating and Technical Parameters |
11 Company Profiles |
12 Recommendations | 13 Disclaimer |
Export potential assessment - trade Analytics for 2030
Export potential enables firms to identify high-growth global markets with greater confidence by combining advanced trade intelligence with a structured quantitative methodology. The framework analyzes emerging demand trends and country-level import patterns while integrating macroeconomic and trade datasets such as GDP and population forecasts, bilateral import–export flows, tariff structures, elasticity differentials between developed and developing economies, geographic distance, and import demand projections. Using weighted trade values from 2020–2024 as the base period to project country-to-country export potential for 2030, these inputs are operationalized through calculated drivers such as gravity model parameters, tariff impact factors, and projected GDP per-capita growth. Through an analysis of hidden potentials, demand hotspots, and market conditions that are most favorable to success, this method enables firms to focus on target countries, maximize returns, and global expansion with data, backed by accuracy.
By factoring in the projected importer demand gap that is currently unmet and could be potential opportunity, it identifies the potential for the Exporter (Country) among 190 countries, against the general trade analysis, which identifies the biggest importer or exporter.
To discover high-growth global markets and optimize your business strategy:
Click Here
Pricing
- Single User License$ 1,995
- Department License$ 2,400
- Site License$ 3,120
- Global License$ 3,795

Search
Thought Leadership and Analyst Meet


Our Clients
Latest Reports
- Philippines Polyhydroxybutyrate-co-Hydroxyvalerate Market (2026-2032) | Trends, Insights, Challenges, Restraints, Competition, Size, Value, Forecast, Pricing, Share, Outlook, Revenue, Investment Opportunities, Strategy, Drivers, Demand, Growth, segmentation, Analysis, Companies
- Peru Polyhydroxybutyrate-co-Hydroxyvalerate Market (2026-2032) | Growth, Demand, Challenges, Share, Trends, Analysis, Pricing, Investment Opportunities, Drivers, Value, Forecast, Competition, Size, Companies, Insights, Outlook, Restraints, segmentation, Revenue, Strategy
- Pakistan Polyhydroxybutyrate-co-Hydroxyvalerate Market (2026-2032) | Restraints, segmentation, Pricing, Forecast, Share, Strategy, Competition, Trends, Insights, Drivers, Challenges, Growth, Revenue, Outlook, Value, Investment Opportunities, Companies, Size, Analysis, Demand
- Oman Polyhydroxybutyrate-co-Hydroxyvalerate Market (2026-2032) | Drivers, segmentation, Insights, Competition, Pricing, Outlook, Size, Revenue, Challenges, Forecast, Analysis, Growth, Value, Share, Trends, Investment Opportunities, Strategy, Restraints, Companies, Demand
- Nigeria Polyhydroxybutyrate-co-Hydroxyvalerate Market (2026-2032) | Value, Investment Opportunities, Analysis, Revenue, Restraints, Pricing, Outlook, Competition, Demand, Growth, Forecast, Companies, Trends, Challenges, segmentation, Drivers, Insights, Share, Size, Strategy
- Nepal Polyhydroxybutyrate-co-Hydroxyvalerate Market (2026-2032) | Insights, Analysis, Drivers, Share, Revenue, Demand, segmentation, Investment Opportunities, Competition, Forecast, Growth, Pricing, Companies, Strategy, Trends, Restraints, Challenges, Outlook, Size, Value
- Myanmar Polyhydroxybutyrate-co-Hydroxyvalerate Market (2026-2032) | Outlook, Revenue, Strategy, Restraints, Drivers, segmentation, Share, Forecast, Competition, Insights, Growth, Pricing, Size, Demand, Value, Companies, Trends, Challenges, Investment Opportunities, Analysis
- Morocco Polyhydroxybutyrate-co-Hydroxyvalerate Market (2026-2032) | Outlook, Investment Opportunities, Restraints, Strategy, Forecast, Challenges, Drivers, Growth, Companies, segmentation, Trends, Size, Competition, Revenue, Demand, Insights, Share, Analysis, Value, Pricing
- Mexico Polyhydroxybutyrate-co-Hydroxyvalerate Market (2026-2032) | Size, Drivers, Outlook, Share, Strategy, Growth, Pricing, Challenges, Companies, Demand, Value, Investment Opportunities, Restraints, Trends, Forecast, segmentation, Analysis, Insights, Competition, Revenue
- Malaysia Polyhydroxybutyrate-co-Hydroxyvalerate Market (2026-2032) | Share, segmentation, Size, Companies, Analysis, Insights, Forecast, Value, Revenue, Drivers, Restraints, Challenges, Investment Opportunities, Trends, Competition, Strategy, Demand, Growth, Outlook, Pricing
Industry Events and Analyst Meet

HIMTEX 2026

India Refining Summit 2026

India EV Show 2026

EV tech India Expo 2026

Auto Tech Asia 2026
Whitepaper
- Middle East & Africa Commercial Security Market Click here to view more.
- Middle East & Africa Fire Safety Systems & Equipment Market Click here to view more.
- GCC Drone Market Click here to view more.
- Middle East Lighting Fixture Market Click here to view more.
- GCC Physical & Perimeter Security Market Click here to view more.
6WResearch In News
- Doha a strategic location for EV manufacturing hub: IPA Qatar
- Demand for luxury TVs surging in the GCC, says Samsung
- Empowering Growth: The Thriving Journey of Bangladesh’s Cable Industry
- Demand for luxury TVs surging in the GCC, says Samsung
- Video call with a traditional healer? Once unthinkable, it’s now common in South Africa
- Intelligent Buildings To Smooth GCC’s Path To Net Zero