Malta Lecithin & Phospholipids Market (2026-2032) | Outlook, Forecast, Companies, Share, Growth, Segmentation, Size, Analysis, Value, Trends, Revenue & Industry
Market Forecast By Source (Soy, Sunflower, Rapeseed & canola, Egg, Other sources), By Type (Fluid, De-oiled, Modified), By Nature (GMO, Non-GMO), By Application (Food & beverages, Bakery products, Convenience foods, Confectioneries, Other food & beverage applications (dairy, fish & meat, spreads & margarine, soups, sauces, and gravies), Feed, Industrial, Healthcare) And Competitive Landscape
| Product Code: ETC5353847 | Publication Date: Nov 2023 | Updated Date: Apr 2026 | Product Type: Market Research Report | |
| Publisher: 6Wresearch | Author: Ravi Bhandari | No. of Pages: 60 | No. of Figures: 30 | No. of Tables: 5 |
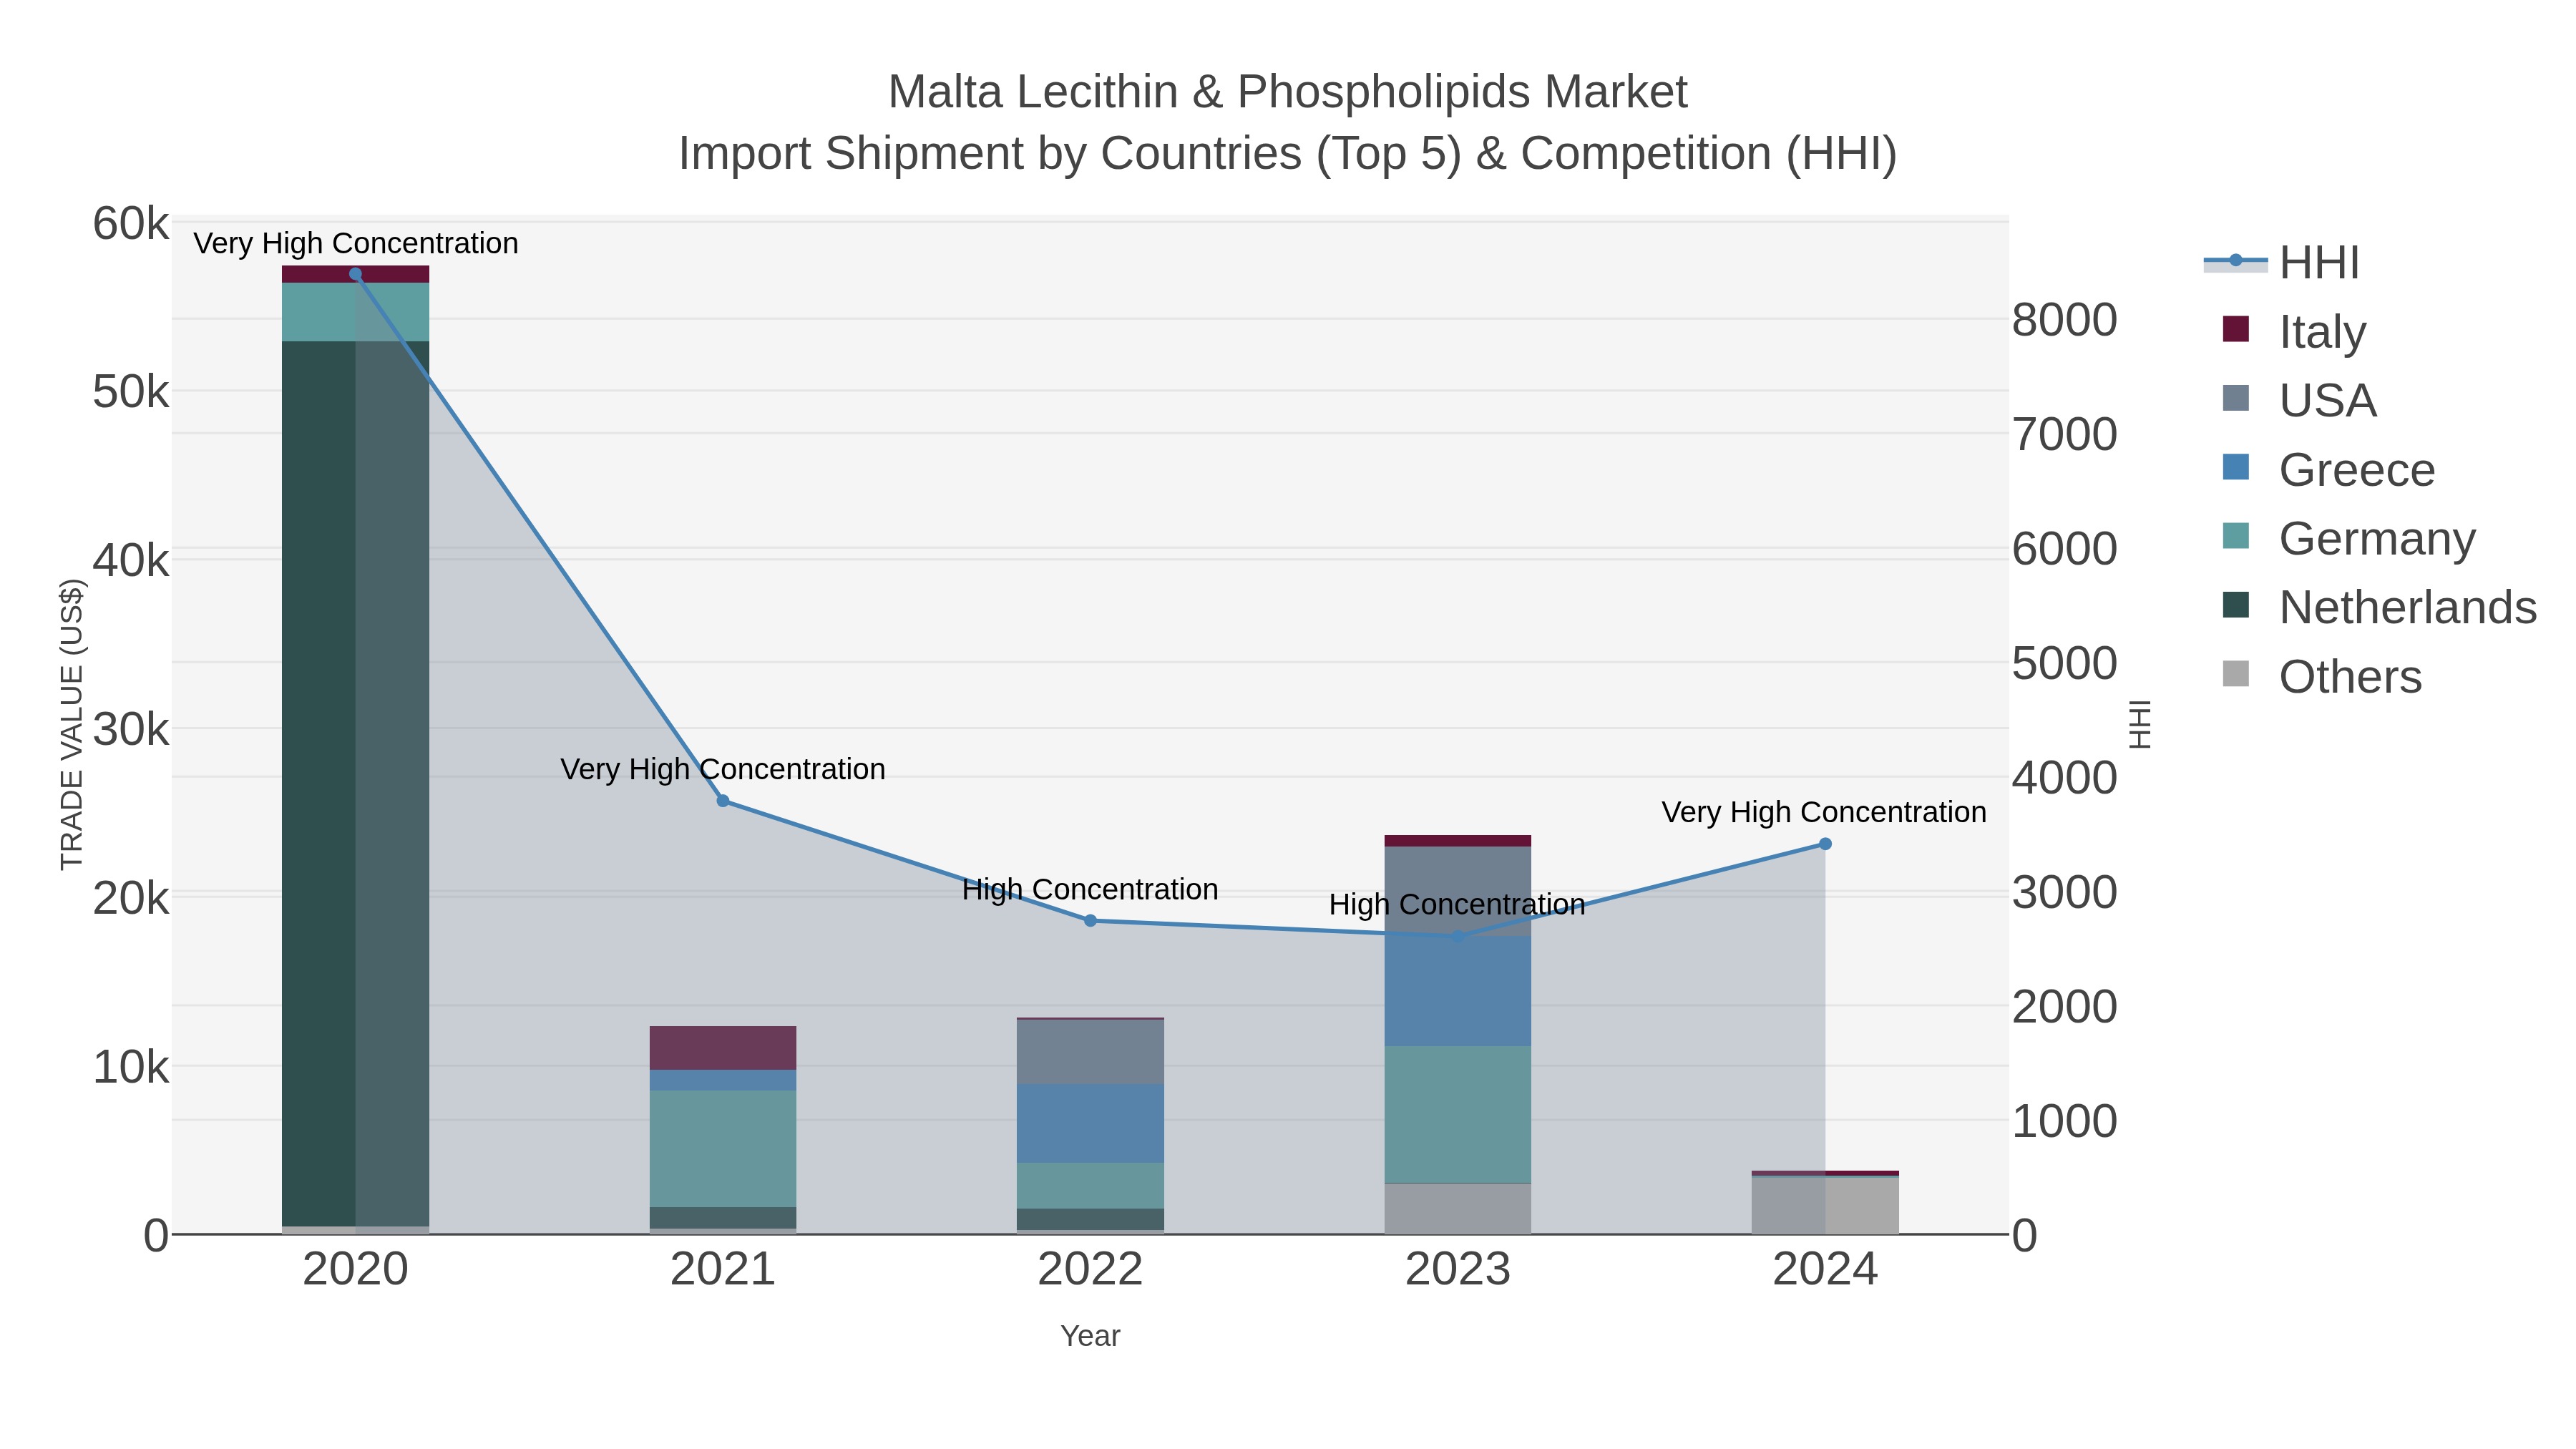
Malta Lecithin & Phospholipids Market Top 5 Importing Countries and Market Competition (HHI) Analysis
Malta import of lecithin & phospholipids in 2024 continued to be dominated by India, Spain, Italy, Metropolitan France, and Ireland. The Herfindahl-Hirschman Index (HHI) indicated a significant increase in market concentration from 2023 to 2024, reaching very high levels. The compound annual growth rate (CAGR) from 2020 to 2024 was notably negative at -49.3%, with a sharp decline in growth rate from 2023 to 2024 at -83.96%. This data suggests a challenging market environment for lecithin & phospholipids imports in Malta, potentially influenced by various economic factors and competitive dynamics.
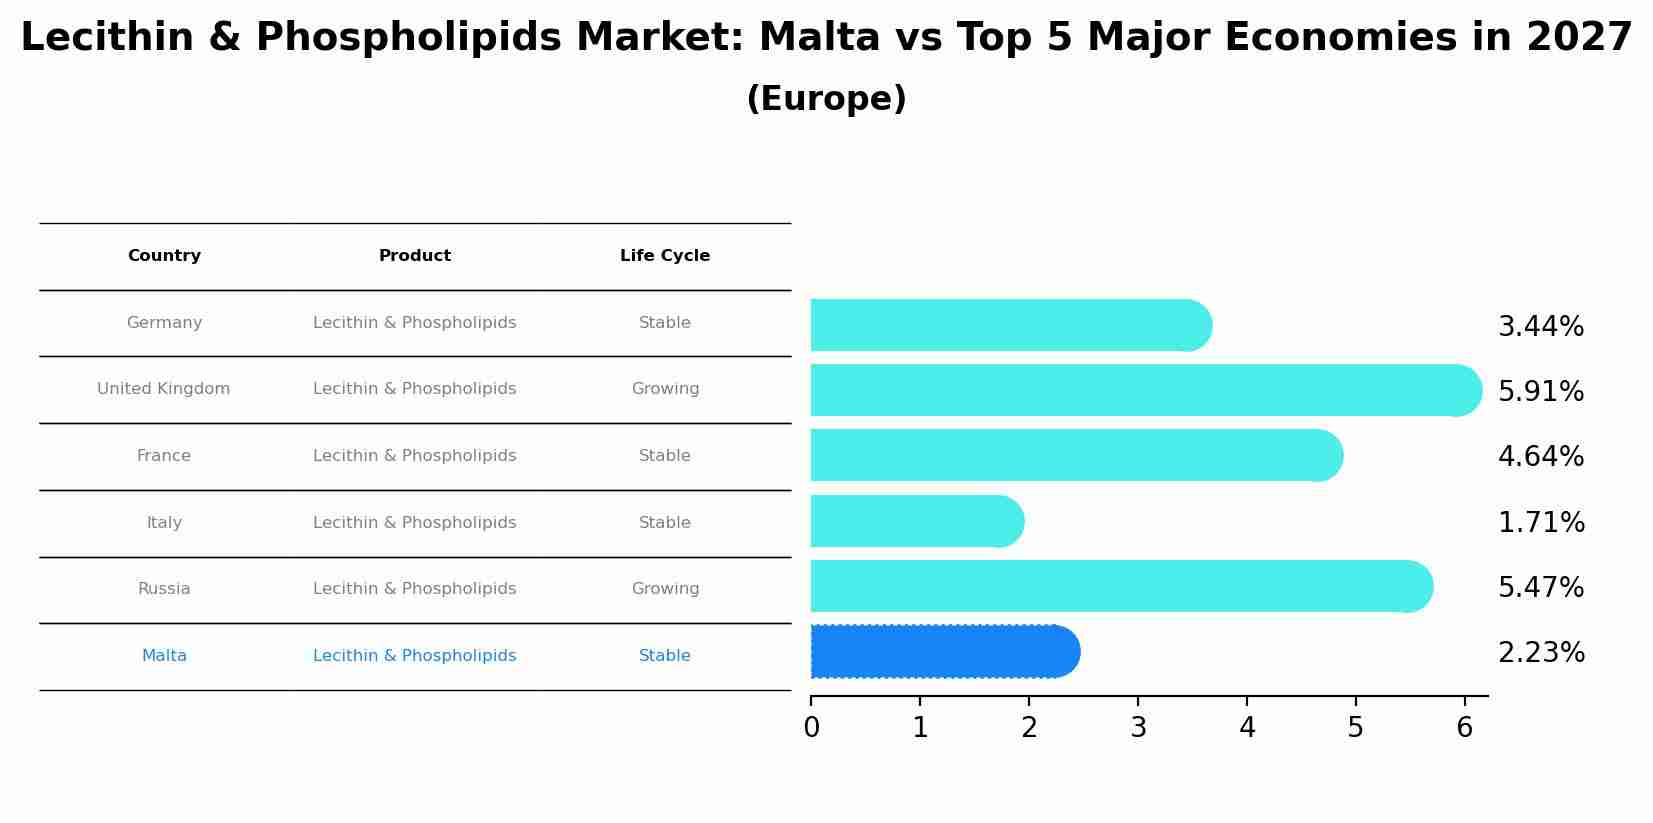
Lecithin & Phospholipids Market: Malta vs Top 5 Major Economies in 2027 (Europe)
Malta's Lecithin & Phospholipids market is anticipated to experience a stable growth rate of 2.23% by 2027, reflecting trends observed in the largest economy Germany, followed by United Kingdom, France, Italy and Russia.
Key Highlights of the Report:
- Malta Lecithin & Phospholipids Market Outlook
- Market Size of Malta Lecithin & Phospholipids Market, 2025
- Forecast of Malta Lecithin & Phospholipids Market, 2032
- Historical Data and Forecast of Malta Lecithin & Phospholipids Revenues & Volume for the Period 2022 - 2032F
- Malta Lecithin & Phospholipids Market Trend Evolution
- Malta Lecithin & Phospholipids Market Drivers and Challenges
- Malta Lecithin & Phospholipids Price Trends
- Malta Lecithin & Phospholipids Porter`s Five Forces
- Malta Lecithin & Phospholipids Industry Life Cycle
- Historical Data and Forecast of Malta Lecithin & Phospholipids Market Revenues & Volume By Source for the Period 2022 - 2032F
- Historical Data and Forecast of Malta Lecithin & Phospholipids Market Revenues & Volume By Soy for the Period 2022 - 2032F
- Historical Data and Forecast of Malta Lecithin & Phospholipids Market Revenues & Volume By Sunflower for the Period 2022 - 2032F
- Historical Data and Forecast of Malta Lecithin & Phospholipids Market Revenues & Volume By Rapeseed & canola for the Period 2022 - 2032F
- Historical Data and Forecast of Malta Lecithin & Phospholipids Market Revenues & Volume By Egg for the Period 2022 - 2032F
- Historical Data and Forecast of Malta Lecithin & Phospholipids Market Revenues & Volume By Other sources for the Period 2022 - 2032F
- Historical Data and Forecast of Malta Lecithin & Phospholipids Market Revenues & Volume By Type for the Period 2022 - 2032F
- Historical Data and Forecast of Malta Lecithin & Phospholipids Market Revenues & Volume By Fluid for the Period 2022 - 2032F
- Historical Data and Forecast of Malta Lecithin & Phospholipids Market Revenues & Volume By De-oiled for the Period 2022 - 2032F
- Historical Data and Forecast of Malta Lecithin & Phospholipids Market Revenues & Volume By Modified for the Period 2022 - 2032F
- Historical Data and Forecast of Malta Lecithin & Phospholipids Market Revenues & Volume By Nature for the Period 2022 - 2032F
- Historical Data and Forecast of Malta Lecithin & Phospholipids Market Revenues & Volume By GMO for the Period 2022 - 2032F
- Historical Data and Forecast of Malta Lecithin & Phospholipids Market Revenues & Volume By Non-GMO for the Period 2022 - 2032F
- Historical Data and Forecast of Malta Lecithin & Phospholipids Market Revenues & Volume By Application for the Period 2022 - 2032F
- Historical Data and Forecast of Malta Lecithin & Phospholipids Market Revenues & Volume By Food & beverages for the Period 2022 - 2032F
- Historical Data and Forecast of Malta Lecithin & Phospholipids Market Revenues & Volume By Bakery products for the Period 2022 - 2032F
- Historical Data and Forecast of Malta Lecithin & Phospholipids Market Revenues & Volume By Convenience foods for the Period 2022 - 2032F
- Historical Data and Forecast of Malta Lecithin & Phospholipids Market Revenues & Volume By Confectioneries for the Period 2022 - 2032F
- Historical Data and Forecast of Malta Lecithin & Phospholipids Market Revenues & Volume By Other food & beverage applications (dairy, fish & meat, spreads & margarine, soups, sauces, and gravies) for the Period 2022 - 2032F
- Historical Data and Forecast of Malta Lecithin & Phospholipids Market Revenues & Volume By Feed for the Period 2022 - 2032F
- Historical Data and Forecast of Malta Lecithin & Phospholipids Market Revenues & Volume By Industrial for the Period 2022 - 2032F
- Historical Data and Forecast of Malta Lecithin & Phospholipids Market Revenues & Volume By Healthcare for the Period 2022 - 2032F
- Malta Lecithin & Phospholipids Import Export Trade Statistics
- Market Opportunity Assessment By Source
- Market Opportunity Assessment By Type
- Market Opportunity Assessment By Nature
- Market Opportunity Assessment By Application
- Malta Lecithin & Phospholipids Top Companies Market Share
- Malta Lecithin & Phospholipids Competitive Benchmarking By Technical and Operational Parameters
- Malta Lecithin & Phospholipids Company Profiles
- Malta Lecithin & Phospholipids Key Strategic Recommendations
Frequently Asked Questions About the Market Study (FAQs):
6Wresearch actively monitors the Malta Lecithin & Phospholipids Market and publishes its comprehensive annual report, highlighting emerging trends, growth drivers, revenue analysis, and forecast outlook. Our insights help businesses to make data-backed strategic decisions with ongoing market dynamics. Our analysts track relevent industries related to the Malta Lecithin & Phospholipids Market, allowing our clients with actionable intelligence and reliable forecasts tailored to emerging regional needs.
Yes, we provide customisation as per your requirements. To learn more, feel free to contact us on sales@6wresearch.com
1 Executive Summary |
2 Introduction |
2.1 Key Highlights of the Report |
2.2 Report Description |
2.3 Market Scope & Segmentation |
2.4 Research Methodology |
2.5 Assumptions |
3 Malta Lecithin & Phospholipids Market Overview |
3.1 Malta Country Macro Economic Indicators |
3.2 Malta Lecithin & Phospholipids Market Revenues & Volume, 2022 & 2032F |
3.3 Malta Lecithin & Phospholipids Market - Industry Life Cycle |
3.4 Malta Lecithin & Phospholipids Market - Porter's Five Forces |
3.5 Malta Lecithin & Phospholipids Market Revenues & Volume Share, By Source, 2022 & 2032F |
3.6 Malta Lecithin & Phospholipids Market Revenues & Volume Share, By Type, 2022 & 2032F |
3.7 Malta Lecithin & Phospholipids Market Revenues & Volume Share, By Nature, 2022 & 2032F |
3.8 Malta Lecithin & Phospholipids Market Revenues & Volume Share, By Application, 2022 & 2032F |
4 Malta Lecithin & Phospholipids Market Dynamics |
4.1 Impact Analysis |
4.2 Market Drivers |
4.2.1 Increasing awareness about the health benefits of lecithin and phospholipids |
4.2.2 Growing demand for natural and organic ingredients in the food and beverage industry |
4.2.3 Rising prevalence of chronic diseases driving the demand for functional food ingredients |
4.3 Market Restraints |
4.3.1 Fluctuating prices of raw materials impacting production costs |
4.3.2 Stringent regulations related to the use of lecithin and phospholipids in different industries |
4.3.3 Intense competition from substitute ingredients in the market |
5 Malta Lecithin & Phospholipids Market Trends |
6 Malta Lecithin & Phospholipids Market Segmentations |
6.1 Malta Lecithin & Phospholipids Market, By Source |
6.1.1 Overview and Analysis |
6.1.2 Malta Lecithin & Phospholipids Market Revenues & Volume, By Soy, 2022 - 2032F |
6.1.3 Malta Lecithin & Phospholipids Market Revenues & Volume, By Sunflower, 2022 - 2032F |
6.1.4 Malta Lecithin & Phospholipids Market Revenues & Volume, By Rapeseed & canola, 2022 - 2032F |
6.1.5 Malta Lecithin & Phospholipids Market Revenues & Volume, By Egg, 2022 - 2032F |
6.1.6 Malta Lecithin & Phospholipids Market Revenues & Volume, By Other sources, 2022 - 2032F |
6.2 Malta Lecithin & Phospholipids Market, By Type |
6.2.1 Overview and Analysis |
6.2.2 Malta Lecithin & Phospholipids Market Revenues & Volume, By Fluid, 2022 - 2032F |
6.2.3 Malta Lecithin & Phospholipids Market Revenues & Volume, By De-oiled, 2022 - 2032F |
6.2.4 Malta Lecithin & Phospholipids Market Revenues & Volume, By Modified, 2022 - 2032F |
6.3 Malta Lecithin & Phospholipids Market, By Nature |
6.3.1 Overview and Analysis |
6.3.2 Malta Lecithin & Phospholipids Market Revenues & Volume, By GMO, 2022 - 2032F |
6.3.3 Malta Lecithin & Phospholipids Market Revenues & Volume, By Non-GMO, 2022 - 2032F |
6.4 Malta Lecithin & Phospholipids Market, By Application |
6.4.1 Overview and Analysis |
6.4.2 Malta Lecithin & Phospholipids Market Revenues & Volume, By Food & beverages, 2022 - 2032F |
6.4.3 Malta Lecithin & Phospholipids Market Revenues & Volume, By Bakery products, 2022 - 2032F |
6.4.4 Malta Lecithin & Phospholipids Market Revenues & Volume, By Convenience foods, 2022 - 2032F |
6.4.5 Malta Lecithin & Phospholipids Market Revenues & Volume, By Confectioneries, 2022 - 2032F |
6.4.6 Malta Lecithin & Phospholipids Market Revenues & Volume, By Other food & beverage applications (dairy, fish & meat, spreads & margarine, soups, sauces, and gravies), 2022 - 2032F |
6.4.7 Malta Lecithin & Phospholipids Market Revenues & Volume, By Feed, 2022 - 2032F |
6.4.8 Malta Lecithin & Phospholipids Market Revenues & Volume, By Healthcare, 2022 - 2032F |
6.4.9 Malta Lecithin & Phospholipids Market Revenues & Volume, By Healthcare, 2022 - 2032F |
7 Malta Lecithin & Phospholipids Market Import-Export Trade Statistics |
7.1 Malta Lecithin & Phospholipids Market Export to Major Countries |
7.2 Malta Lecithin & Phospholipids Market Imports from Major Countries |
8 Malta Lecithin & Phospholipids Market Key Performance Indicators |
8.1 Research and development investment in innovative lecithin and phospholipids applications |
8.2 Number of new product launches featuring lecithin and phospholipids |
8.3 Adoption rate of lecithin and phospholipids in new industry sectors |
8.4 Sustainability initiatives in the sourcing and production of lecithin and phospholipids |
8.5 Customer satisfaction and retention rates for companies offering lecithin and phospholipids |
9 Malta Lecithin & Phospholipids Market - Opportunity Assessment |
9.1 Malta Lecithin & Phospholipids Market Opportunity Assessment, By Source, 2022 & 2032F |
9.2 Malta Lecithin & Phospholipids Market Opportunity Assessment, By Type, 2022 & 2032F |
9.3 Malta Lecithin & Phospholipids Market Opportunity Assessment, By Nature, 2022 & 2032F |
9.4 Malta Lecithin & Phospholipids Market Opportunity Assessment, By Application, 2022 & 2032F |
10 Malta Lecithin & Phospholipids Market - Competitive Landscape |
10.1 Malta Lecithin & Phospholipids Market Revenue Share, By Companies, 2025 |
10.2 Malta Lecithin & Phospholipids Market Competitive Benchmarking, By Operating and Technical Parameters |
11 Company Profiles |
12 Recommendations | 13 Disclaimer |
Global Go To Market Strategy - 2030
Export potential enables firms to identify high-growth global markets with greater confidence by combining advanced trade intelligence with a structured quantitative methodology. The framework analyzes emerging demand trends and country-level import patterns while integrating macroeconomic and trade datasets such as GDP and population forecasts, bilateral import–export flows, tariff structures, elasticity differentials between developed and developing economies, geographic distance, and import demand projections. Using weighted trade values from 2020–2024 as the base period to project country-to-country export potential for 2030, these inputs are operationalized through calculated drivers such as gravity model parameters, tariff impact factors, and projected GDP per-capita growth. Through an analysis of hidden potentials, demand hotspots, and market conditions that are most favorable to success, this method enables firms to focus on target countries, maximize returns, and global expansion with data, backed by accuracy.
By factoring in the projected importer demand gap that is currently unmet and could be potential opportunity, it identifies the potential for the Exporter (Country) among 190 countries, against the general trade analysis, which identifies the biggest importer or exporter.
To discover high-growth global markets and optimize your business strategy:
Click Here
Pricing
- Single User License$ 1,995
- Department License$ 2,400
- Site License$ 3,120
- Global License$ 3,795

Leadership Perspectives from Industry Events
Search
Thought Leadership and Analyst Meet


Our Clients
6WResearch In News
- Doha a strategic location for EV manufacturing hub: IPA Qatar
- Demand for luxury TVs surging in the GCC, says Samsung
- Empowering Growth: The Thriving Journey of Bangladesh’s Cable Industry
- Demand for luxury TVs surging in the GCC, says Samsung
- Video call with a traditional healer? Once unthinkable, it’s now common in South Africa
- Intelligent Buildings To Smooth GCC’s Path To Net Zero
Latest Reports
- Taiwan Airport Wireless Infrastructure Market (2026-2032)
- Vietnam Airport Wireless Infrastructure Market (2026-2032)
- Thailand Airport Wireless Infrastructure Market (2026-2032)
- South Korea Airport Wireless Infrastructure Market (2026-2032)
- Romania Airport Wireless Infrastructure Market (2026-2032)
- Qatar Airport Wireless Infrastructure Market (2026-2032)
- Philippines Airport Wireless Infrastructure Market (2026-2032)
- Japan Airport Wireless Infrastructure Market (2026-2032)
- Taiwan Airport Winter Services Market (2026-2032)
- Vietnam Airport Winter Services Market (2026-2032)
Industry Events and Analyst Meet

HIMTEX 2026

India Refining Summit 2026

India EV Show 2026

EV tech India Expo 2026

Auto Tech Asia 2026
Whitepaper
- Middle East & Africa Commercial Security Market Click here to view more.
- Middle East & Africa Fire Safety Systems & Equipment Market Click here to view more.
- GCC Drone Market Click here to view more.
- Middle East Lighting Fixture Market Click here to view more.
- GCC Physical & Perimeter Security Market Click here to view more.