Malta Mini Powder Puff Market (2026-2032) | Analysis, Industry, Forecast, Value, Segmentation, Revenue, Share, Outlook, Growth, Trends, Size & Companies
Market Forecast By Product Type (Wet Puff, Dry Puff), By Applications (Daliy Use, Performing Use) And Competitive Landscape
| Product Code: ETC5100748 | Publication Date: Nov 2023 | Updated Date: Apr 2026 | Product Type: Market Research Report | |
| Publisher: 6Wresearch | Author: Shubham Padhi | No. of Pages: 60 | No. of Figures: 30 | No. of Tables: 5 |
Malta Mini Powder Puff Market Size (2020-2030)
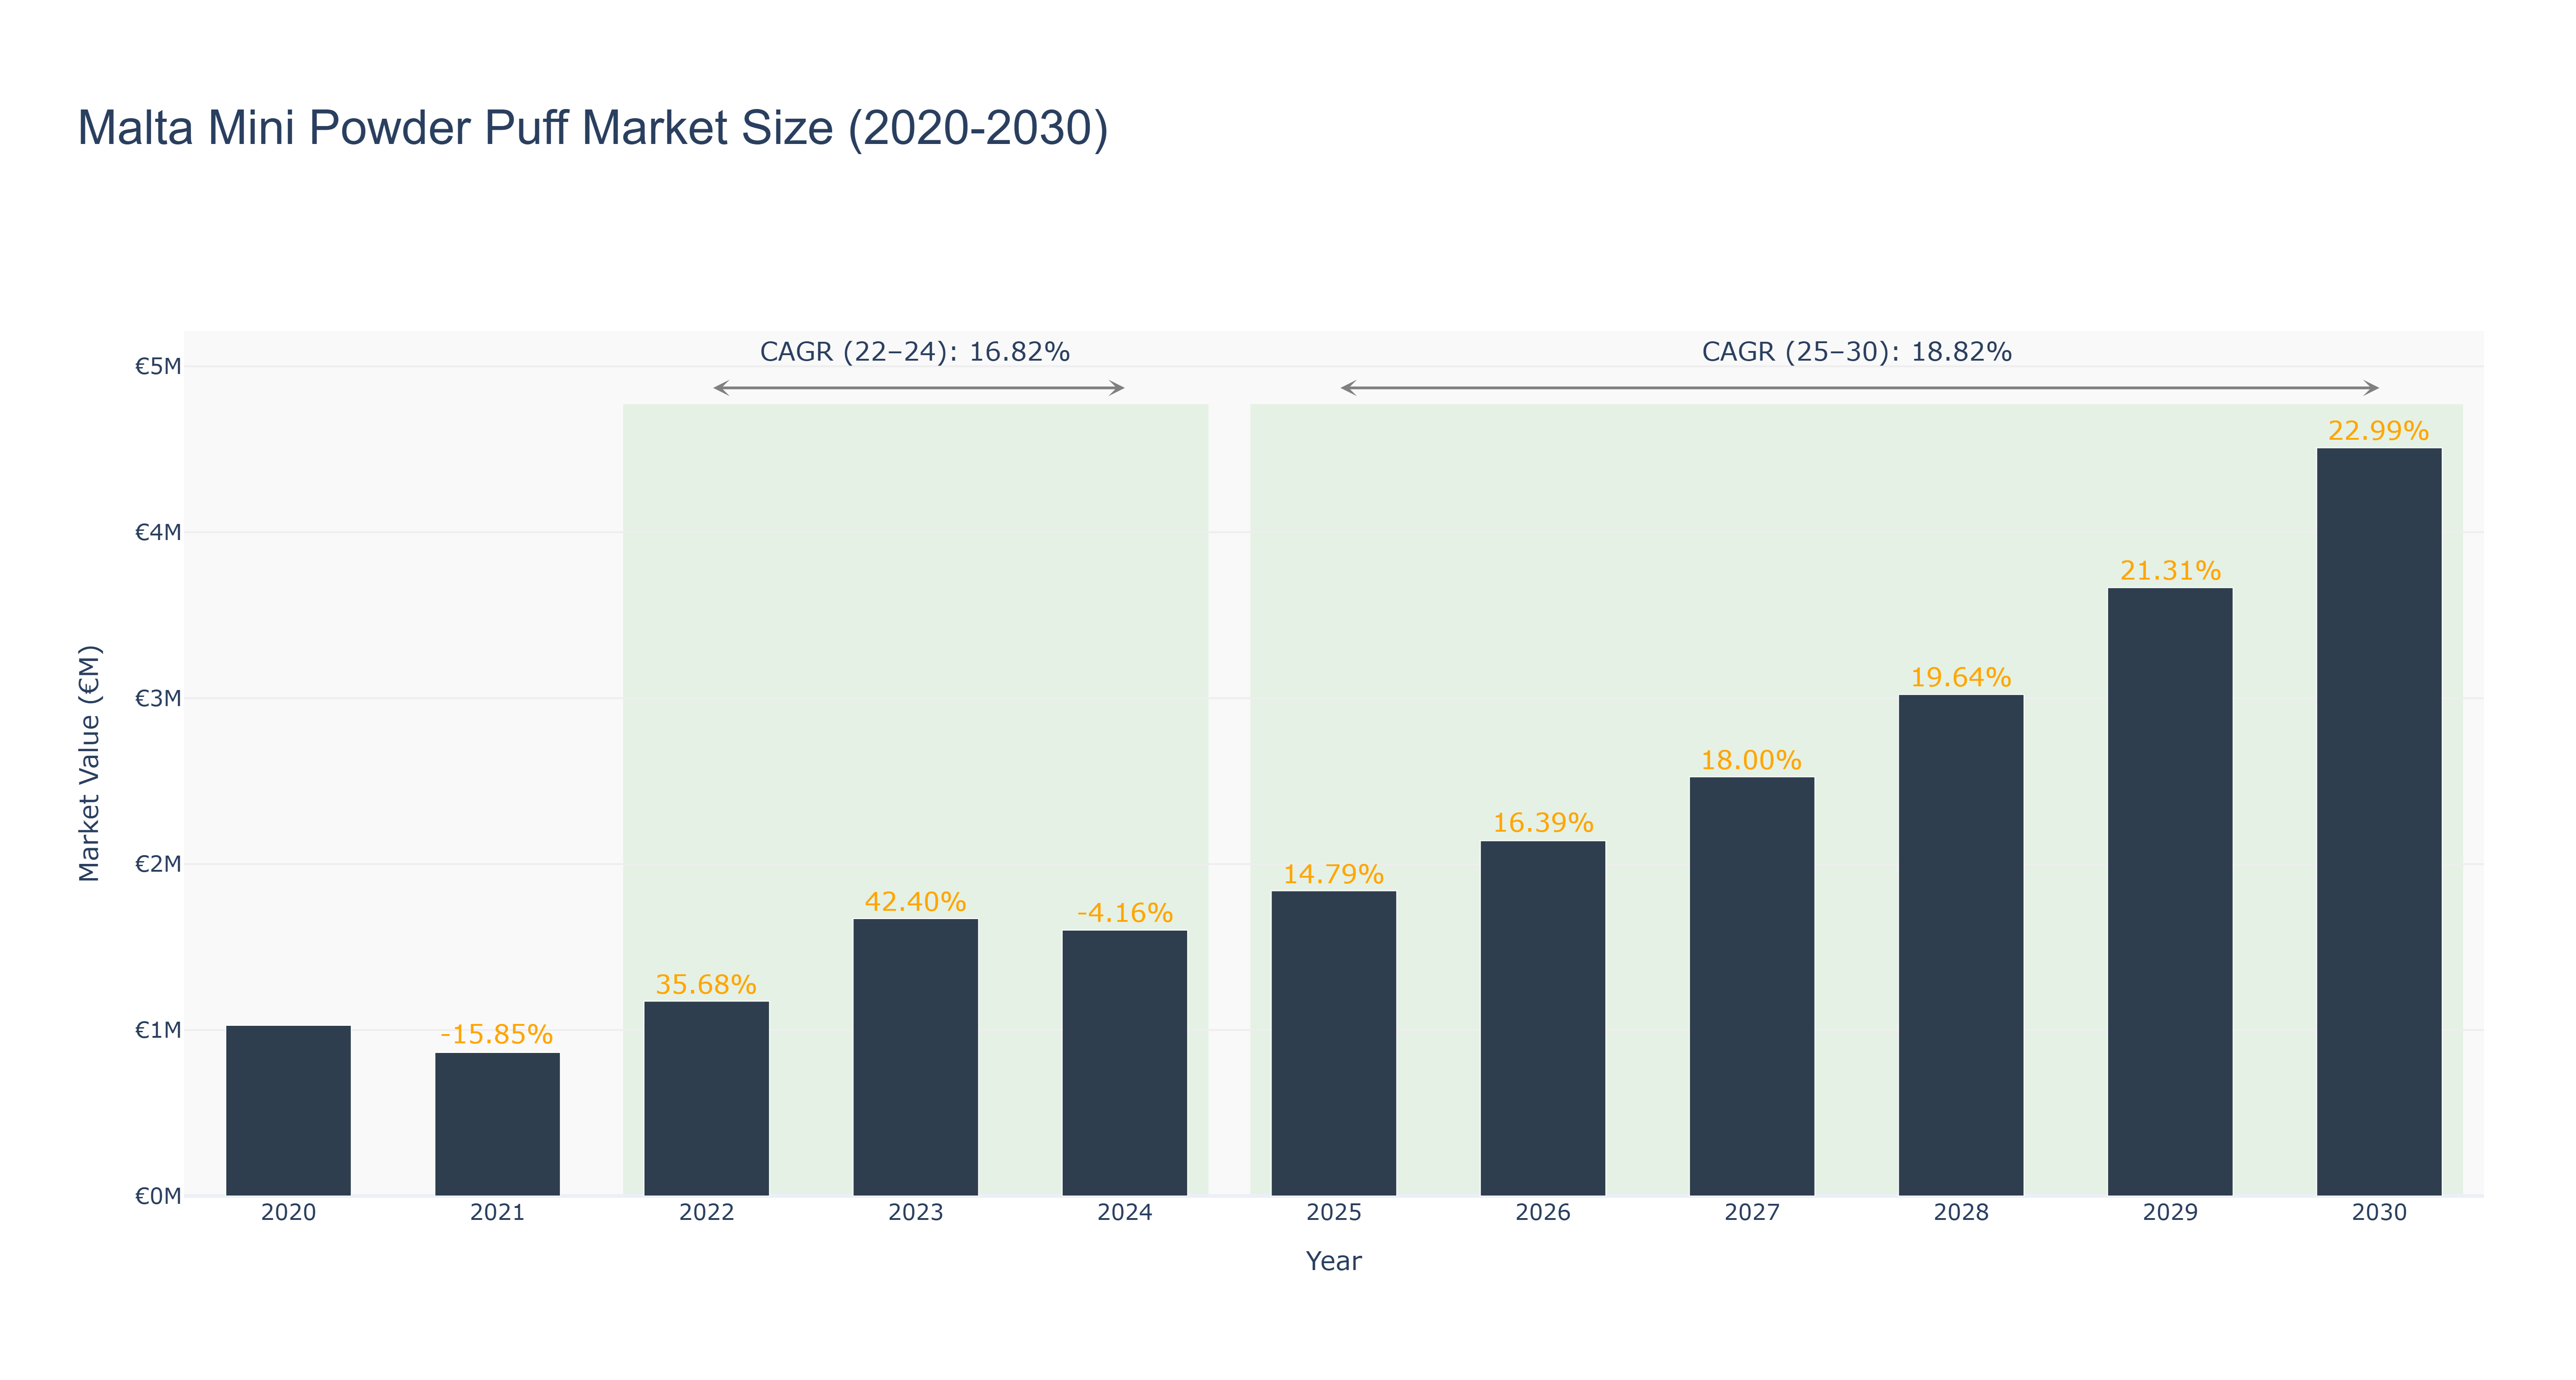
Malta Mini Powder Puff Market has shown a positive growth trend over the years. The peak market size of €4.51 million is projected for 2030, with consistent growth from €1.03 million in 2020. The market experienced fluctuations, with a decline in 2024 due to a -4.16% growth rate, followed by a significant increase in 2025 at 14.79%. The market is currently experiencing steady growth in 2026, with a market size of €2.14 million. This growth can be attributed to increasing consumer demand for mini powder puff products and innovative marketing strategies by key players. Moving forward, the market is expected to continue its growth trajectory, with a forecasted CAGR of 18.82% from 2025 to 2030. Recent developments include collaborations with influencers for product promotion and plans for expanding product lines to cater to a wider consumer base.
Malta Mini Powder Puff Market: Production & Trade Performance (2019-2025)
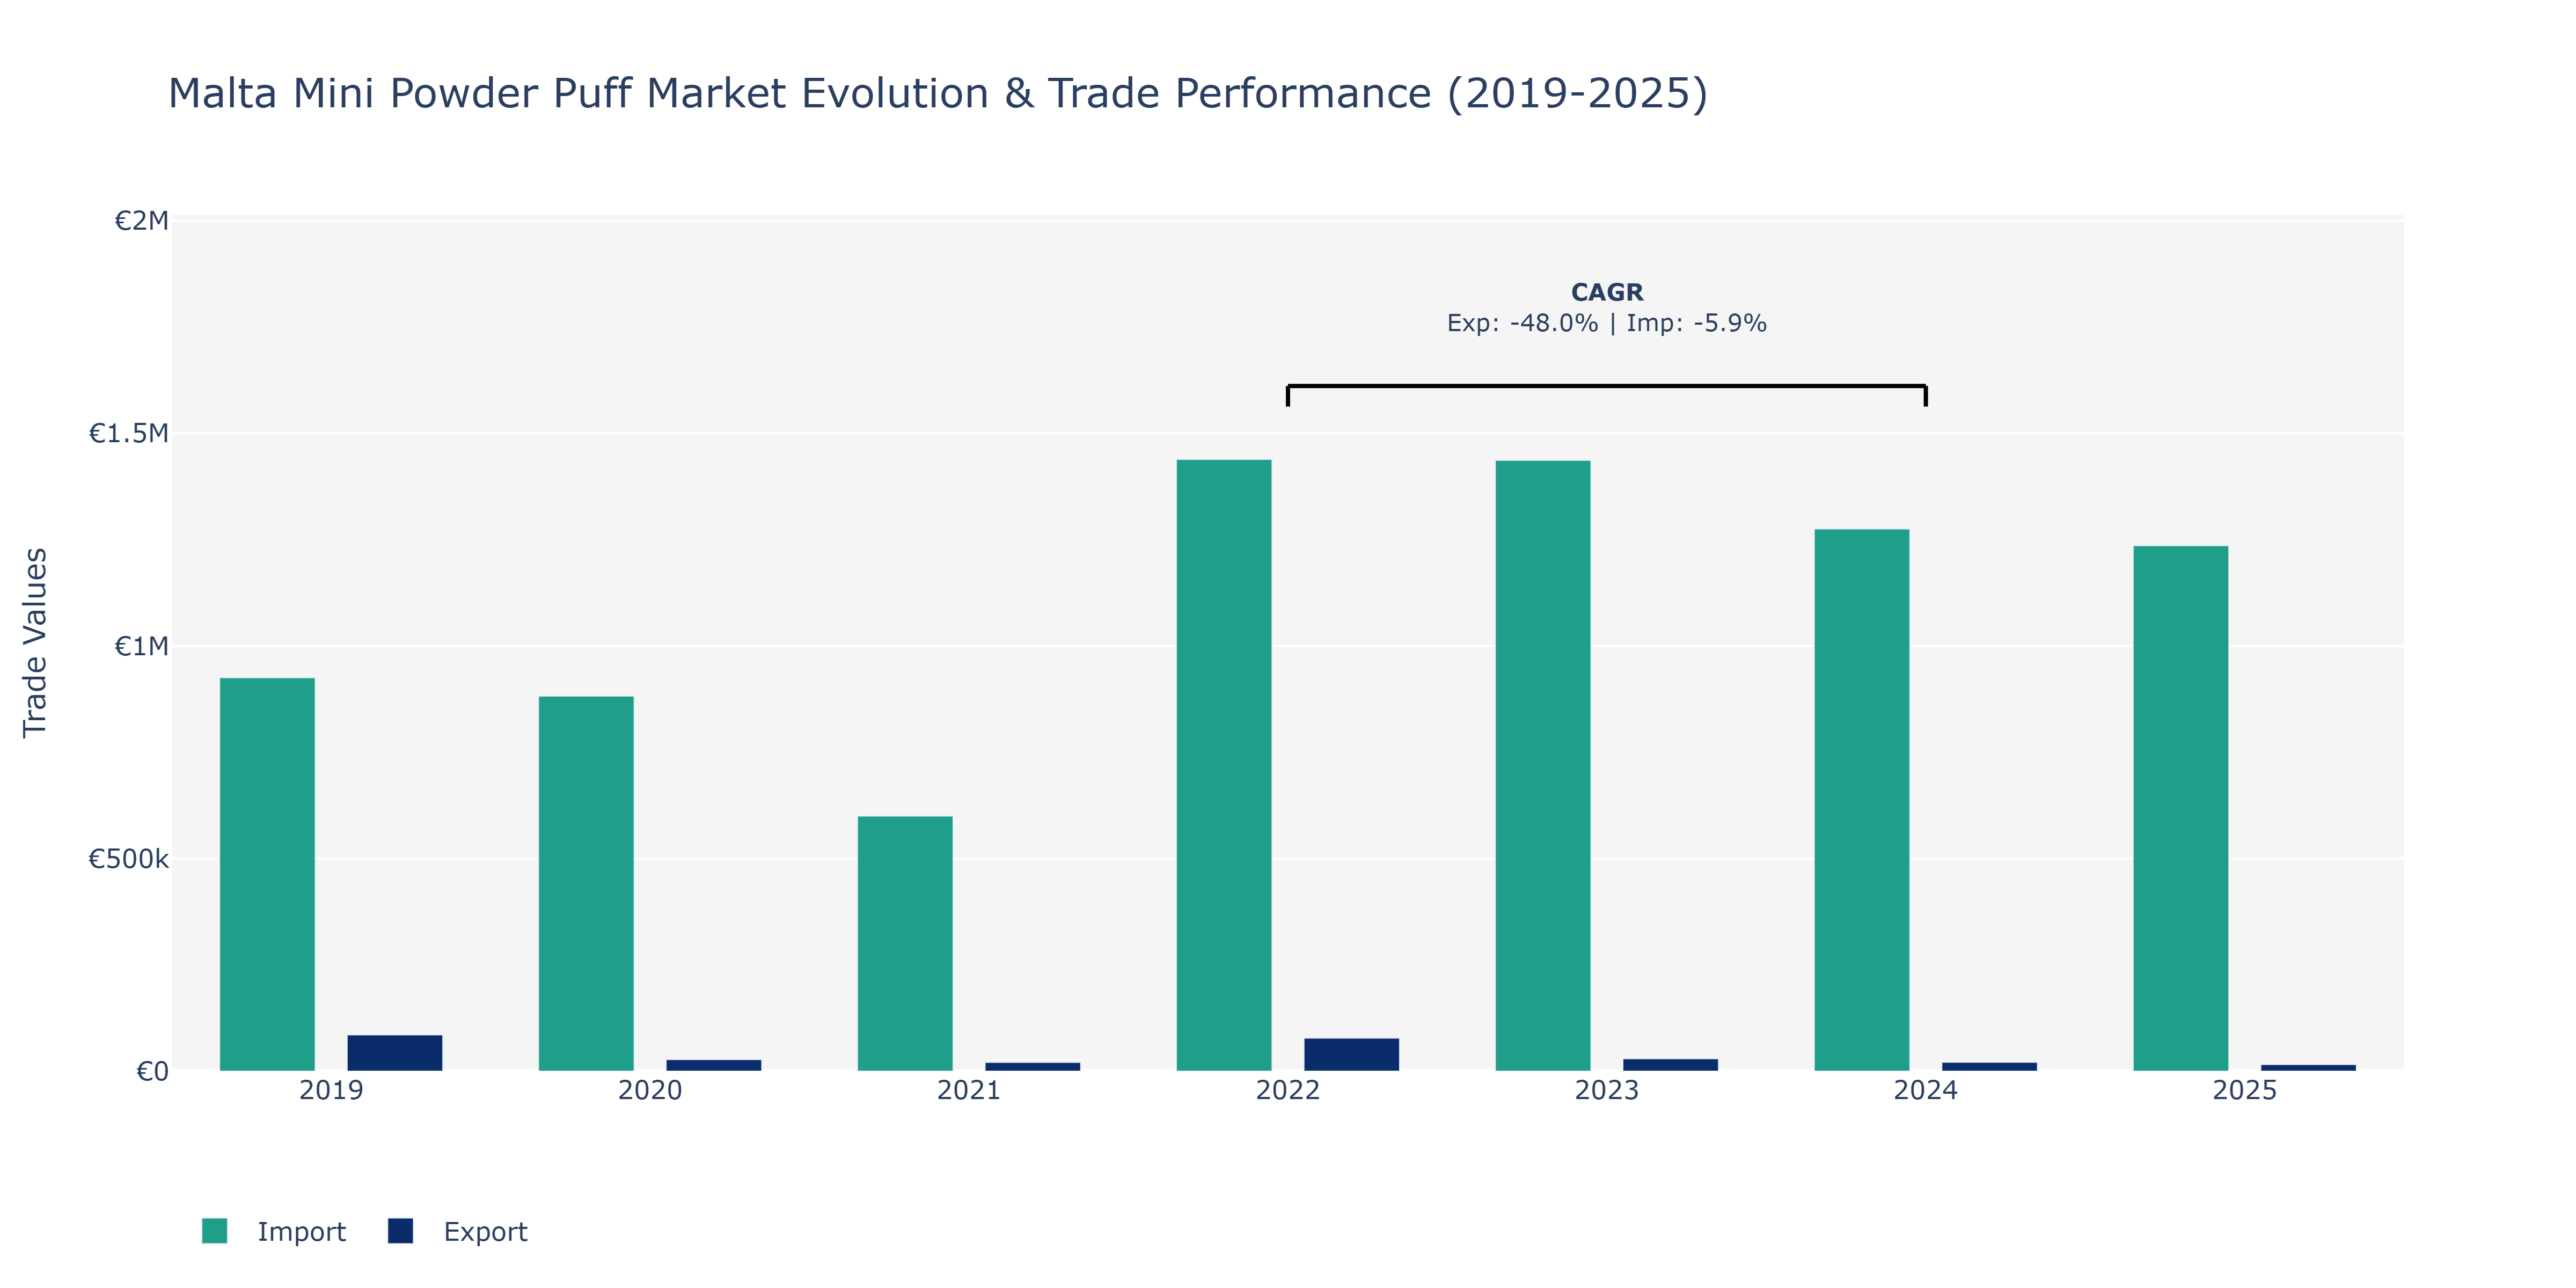
In the Malta Mini Powder Puff Market, exports experienced a fluctuating trend over the years. Starting at €85.47 thousand in 2019, exports dramatically dropped to €27.42 thousand in 2020, before showing a partial recovery in 2021 at €20.92 thousand. The peak export value of €78.06 thousand was achieved in 2022 but declined in the following years, reaching €15.89 thousand in 2025. These fluctuations can be attributed to shifts in consumer preferences, global economic conditions, and possibly changes in production capabilities. On the other hand, imports consistently exceeded exports throughout the period, with a peak of €1.44 million in 2023. This continuous high level of imports indicates a strong demand for imported mini powder puffs in Malta, potentially driven by a lack of domestic production capacity or specific market preferences. Foreign trade policies, innovations in product design, and market competition may have influenced these import trends.
Key Highlights of the Report:
- Malta Mini Powder Puff Market Outlook
- Market Size of Malta Mini Powder Puff Market, 2025
- Forecast of Malta Mini Powder Puff Market, 2032
- Historical Data and Forecast of Malta Mini Powder Puff Revenues & Volume for the Period 2022 - 2032F
- Malta Mini Powder Puff Market Trend Evolution
- Malta Mini Powder Puff Market Drivers and Challenges
- Malta Mini Powder Puff Price Trends
- Malta Mini Powder Puff Porter`s Five Forces
- Malta Mini Powder Puff Industry Life Cycle
- Historical Data and Forecast of Malta Mini Powder Puff Market Revenues & Volume By Product Type for the Period 2022 - 2032F
- Historical Data and Forecast of Malta Mini Powder Puff Market Revenues & Volume By Wet Puff for the Period 2022 - 2032F
- Historical Data and Forecast of Malta Mini Powder Puff Market Revenues & Volume By Dry Puff for the Period 2022 - 2032F
- Historical Data and Forecast of Malta Mini Powder Puff Market Revenues & Volume By Applications for the Period 2022 - 2032F
- Historical Data and Forecast of Malta Mini Powder Puff Market Revenues & Volume By Daliy Use for the Period 2022 - 2032F
- Historical Data and Forecast of Malta Mini Powder Puff Market Revenues & Volume By Performing Use for the Period 2022 - 2032F
- Malta Mini Powder Puff Import Export Trade Statistics
- Market Opportunity Assessment By Product Type
- Market Opportunity Assessment By Applications
- Malta Mini Powder Puff Top Companies Market Share
- Malta Mini Powder Puff Competitive Benchmarking By Technical and Operational Parameters
- Malta Mini Powder Puff Company Profiles
- Malta Mini Powder Puff Key Strategic Recommendations
Frequently Asked Questions About the Market Study (FAQs):
6Wresearch actively monitors the Malta Mini Powder Puff Market and publishes its comprehensive annual report, highlighting emerging trends, growth drivers, revenue analysis, and forecast outlook. Our insights help businesses to make data-backed strategic decisions with ongoing market dynamics. Our analysts track relevent industries related to the Malta Mini Powder Puff Market, allowing our clients with actionable intelligence and reliable forecasts tailored to emerging regional needs.
Yes, we provide customisation as per your requirements. To learn more, feel free to contact us on sales@6wresearch.com
1 Executive Summary |
2 Introduction |
2.1 Key Highlights of the Report |
2.2 Report Description |
2.3 Market Scope & Segmentation |
2.4 Research Methodology |
2.5 Assumptions |
3 Malta Mini Powder Puff Market Overview |
3.1 Malta Country Macro Economic Indicators |
3.2 Malta Mini Powder Puff Market Revenues & Volume, 2022 & 2032F |
3.3 Malta Mini Powder Puff Market - Industry Life Cycle |
3.4 Malta Mini Powder Puff Market - Porter's Five Forces |
3.5 Malta Mini Powder Puff Market Revenues & Volume Share, By Product Type, 2022 & 2032F |
3.6 Malta Mini Powder Puff Market Revenues & Volume Share, By Applications, 2022 & 2032F |
4 Malta Mini Powder Puff Market Dynamics |
4.1 Impact Analysis |
4.2 Market Drivers |
4.2.1 Increasing consumer awareness about the benefits of using mini powder puffs for makeup application |
4.2.2 Growing demand for travel-friendly beauty products |
4.2.3 Rise in online beauty tutorials and social media influencers promoting makeup tools like mini powder puffs |
4.3 Market Restraints |
4.3.1 Intense competition from other makeup applicators such as brushes and sponges |
4.3.2 Limited availability of high-quality mini powder puffs in the market |
4.3.3 Fluctuating raw material prices affecting production costs |
5 Malta Mini Powder Puff Market Trends |
6 Malta Mini Powder Puff Market Segmentations |
6.1 Malta Mini Powder Puff Market, By Product Type |
6.1.1 Overview and Analysis |
6.1.2 Malta Mini Powder Puff Market Revenues & Volume, By Wet Puff, 2022 - 2032F |
6.1.3 Malta Mini Powder Puff Market Revenues & Volume, By Dry Puff, 2022 - 2032F |
6.2 Malta Mini Powder Puff Market, By Applications |
6.2.1 Overview and Analysis |
6.2.2 Malta Mini Powder Puff Market Revenues & Volume, By Daliy Use, 2022 - 2032F |
6.2.3 Malta Mini Powder Puff Market Revenues & Volume, By Performing Use, 2022 - 2032F |
7 Malta Mini Powder Puff Market Import-Export Trade Statistics |
7.1 Malta Mini Powder Puff Market Export to Major Countries |
7.2 Malta Mini Powder Puff Market Imports from Major Countries |
8 Malta Mini Powder Puff Market Key Performance Indicators |
8.1 Customer satisfaction scores related to mini powder puff quality and usability |
8.2 Social media engagement metrics like likes, shares, and comments on posts featuring mini powder puffs |
8.3 Number of collaborations with beauty influencers or makeup artists for mini powder puff endorsements |
9 Malta Mini Powder Puff Market - Opportunity Assessment |
9.1 Malta Mini Powder Puff Market Opportunity Assessment, By Product Type, 2022 & 2032F |
9.2 Malta Mini Powder Puff Market Opportunity Assessment, By Applications, 2022 & 2032F |
10 Malta Mini Powder Puff Market - Competitive Landscape |
10.1 Malta Mini Powder Puff Market Revenue Share, By Companies, 2025 |
10.2 Malta Mini Powder Puff Market Competitive Benchmarking, By Operating and Technical Parameters |
11 Company Profiles |
12 Recommendations | 13 Disclaimer |
Global Go To Market Strategy - 2030
Export potential enables firms to identify high-growth global markets with greater confidence by combining advanced trade intelligence with a structured quantitative methodology. The framework analyzes emerging demand trends and country-level import patterns while integrating macroeconomic and trade datasets such as GDP and population forecasts, bilateral import–export flows, tariff structures, elasticity differentials between developed and developing economies, geographic distance, and import demand projections. Using weighted trade values from 2020–2024 as the base period to project country-to-country export potential for 2030, these inputs are operationalized through calculated drivers such as gravity model parameters, tariff impact factors, and projected GDP per-capita growth. Through an analysis of hidden potentials, demand hotspots, and market conditions that are most favorable to success, this method enables firms to focus on target countries, maximize returns, and global expansion with data, backed by accuracy.
By factoring in the projected importer demand gap that is currently unmet and could be potential opportunity, it identifies the potential for the Exporter (Country) among 190 countries, against the general trade analysis, which identifies the biggest importer or exporter.
To discover high-growth global markets and optimize your business strategy:
Click Here
Pricing
- Single User License$ 1,995
- Department License$ 2,400
- Site License$ 3,120
- Global License$ 3,795

Leadership Perspectives from Industry Events
Search
Thought Leadership and Analyst Meet


Our Clients
6WResearch In News
- India Export Attractiveness Tracker 2026
- India Air Conditioner Market Set for Strong Rebound in 2026 After Weather-Led Correction and GST-Driven Recovery: 6Wresearch
- ADAS in India: How Automatic Emergency Braking, Blind Spot Detection & Driver Monitoring are Transforming Road Safety
- Doha a strategic location for EV manufacturing hub: IPA Qatar
- Demand for luxury TVs surging in the GCC, says Samsung
- Empowering Growth: The Thriving Journey of Bangladesh’s Cable Industry
Latest Reports
- Nicaragua RPG Gaming Market (2026-2032)
- New Zealand RPG Gaming Market (2026-2032)
- Netherlands RPG Gaming Market (2026-2032)
- Nauru RPG Gaming Market (2026-2032)
- Namibia RPG Gaming Market (2026-2032)
- Mozambique RPG Gaming Market (2026-2032)
- Montenegro RPG Gaming Market (2026-2032)
- Mongolia RPG Gaming Market (2026-2032)
- Monaco RPG Gaming Market (2026-2032)
- Micronesia RPG Gaming Market (2026-2032)
Industry Events and Analyst Meet

EV India Expo 2026

HIMTEX 2026

India Refining Summit 2026

India EV Show 2026

EV tech India Expo 2026
Whitepaper
- Middle East & Africa Commercial Security Market Click here to view more.
- Middle East & Africa Fire Safety Systems & Equipment Market Click here to view more.
- GCC Drone Market Click here to view more.
- Middle East Lighting Fixture Market Click here to view more.
- GCC Physical & Perimeter Security Market Click here to view more.