Malta Natural Vanillin Market (2026-2032) | Growth, Industry, Forecast, Size, Value, Share, Outlook, Segmentation, Analysis, Trends, Companies & Revenue
Market Forecast By Source (Vanilla Bean Extract, Ferulic Acid Synthesis, Eugenol Synthesis), By Application (Food & Beverages, Pharmaceuticals, Cosmetics & Personal Care) And Competitive Landscape
| Product Code: ETC5790999 | Publication Date: Nov 2023 | Updated Date: Apr 2026 | Product Type: Market Research Report | |
| Publisher: 6Wresearch | Author: Ravi Bhandari | No. of Pages: 60 | No. of Figures: 30 | No. of Tables: 5 |
Malta Natural Vanillin Market Size (2020-2030)
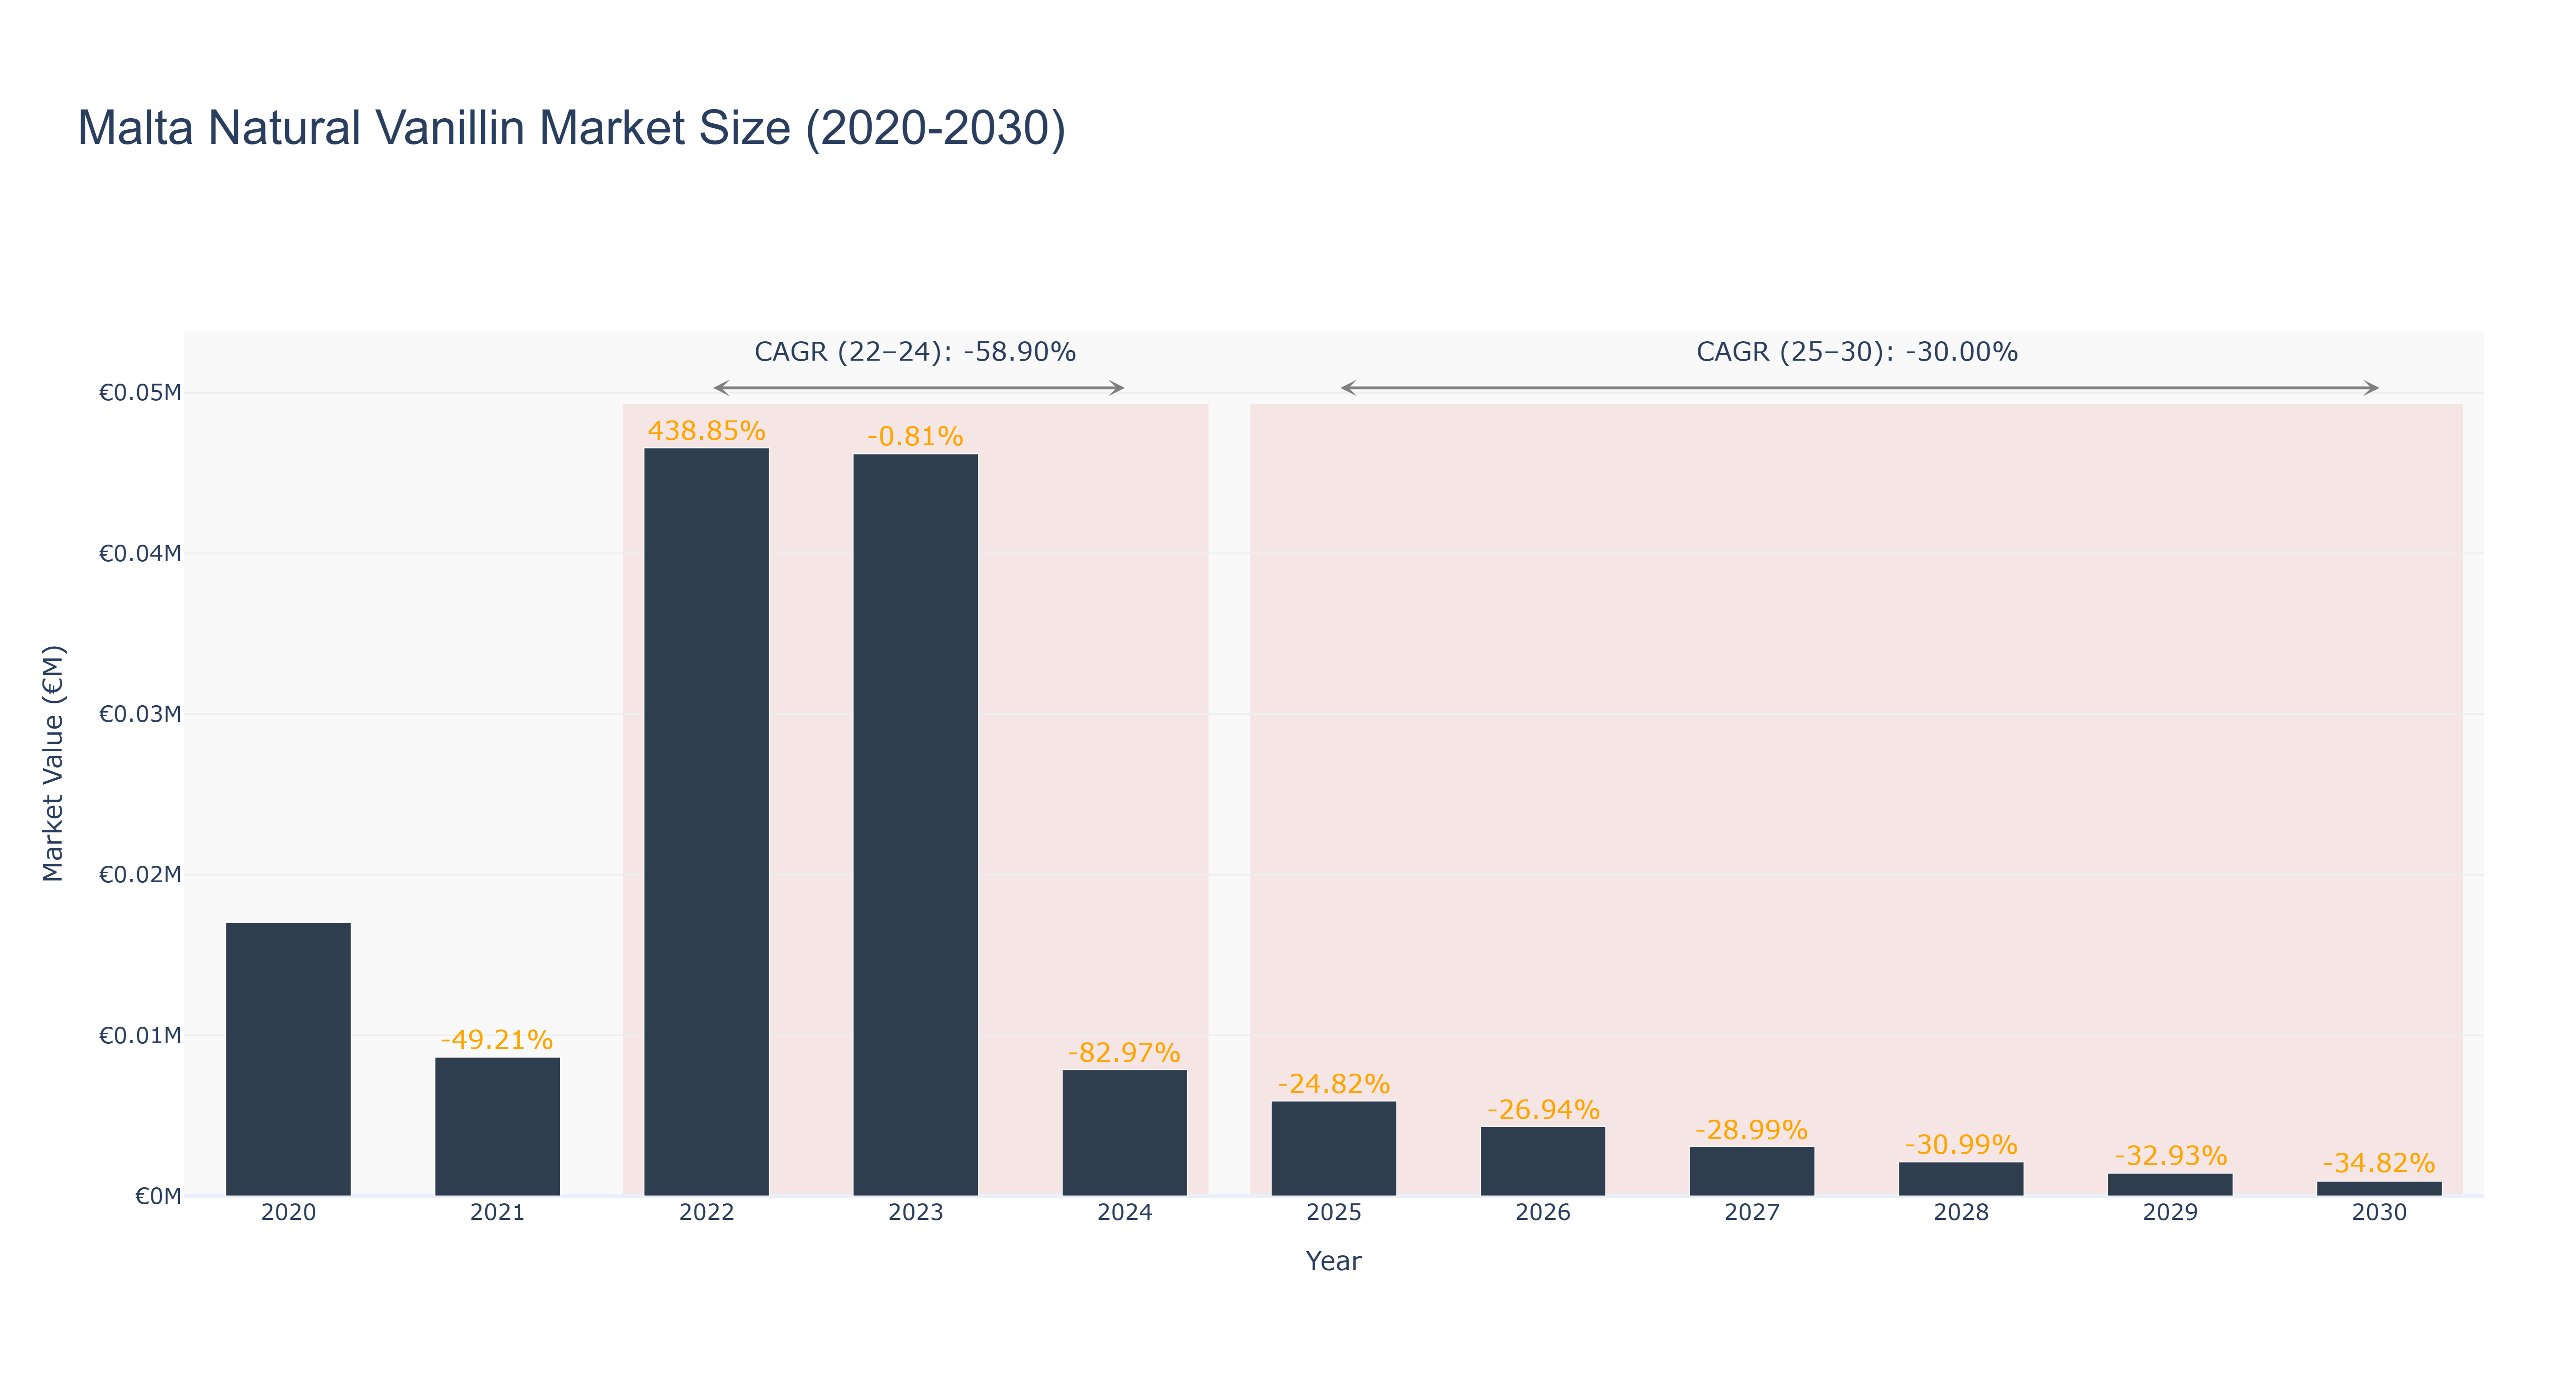
The Malta Natural Vanillin Market has experienced significant volatility, marked by a peak market size of €46.57 thousand in 2022, following a substantial decline to €8.64 thousand in 2021 and a slight decrease to €46.19 thousand in 2023. The actual market data from 2022 to 2024 reflects a dramatic CAGR of -58.90%, indicating serious challenges within the sector. The forecasted period from 2025 to 2030 suggests a continued downward trend, with projected market sizes decreasing from €5.91 thousand in 2025 to €925.32 by 2030, resulting in a CAGR of -30.00%. This decline can be attributed to factors such as fluctuating consumer preferences, competition from synthetic alternatives, and potential regulatory changes impacting natural flavoring sources. While there are no specific upcoming projects noted for the Maltese market, broader trends in sustainability and natural ingredients could influence future recovery efforts within the industry.
Malta Natural Vanillin Market: Production & Trade Performance (2019-2025)
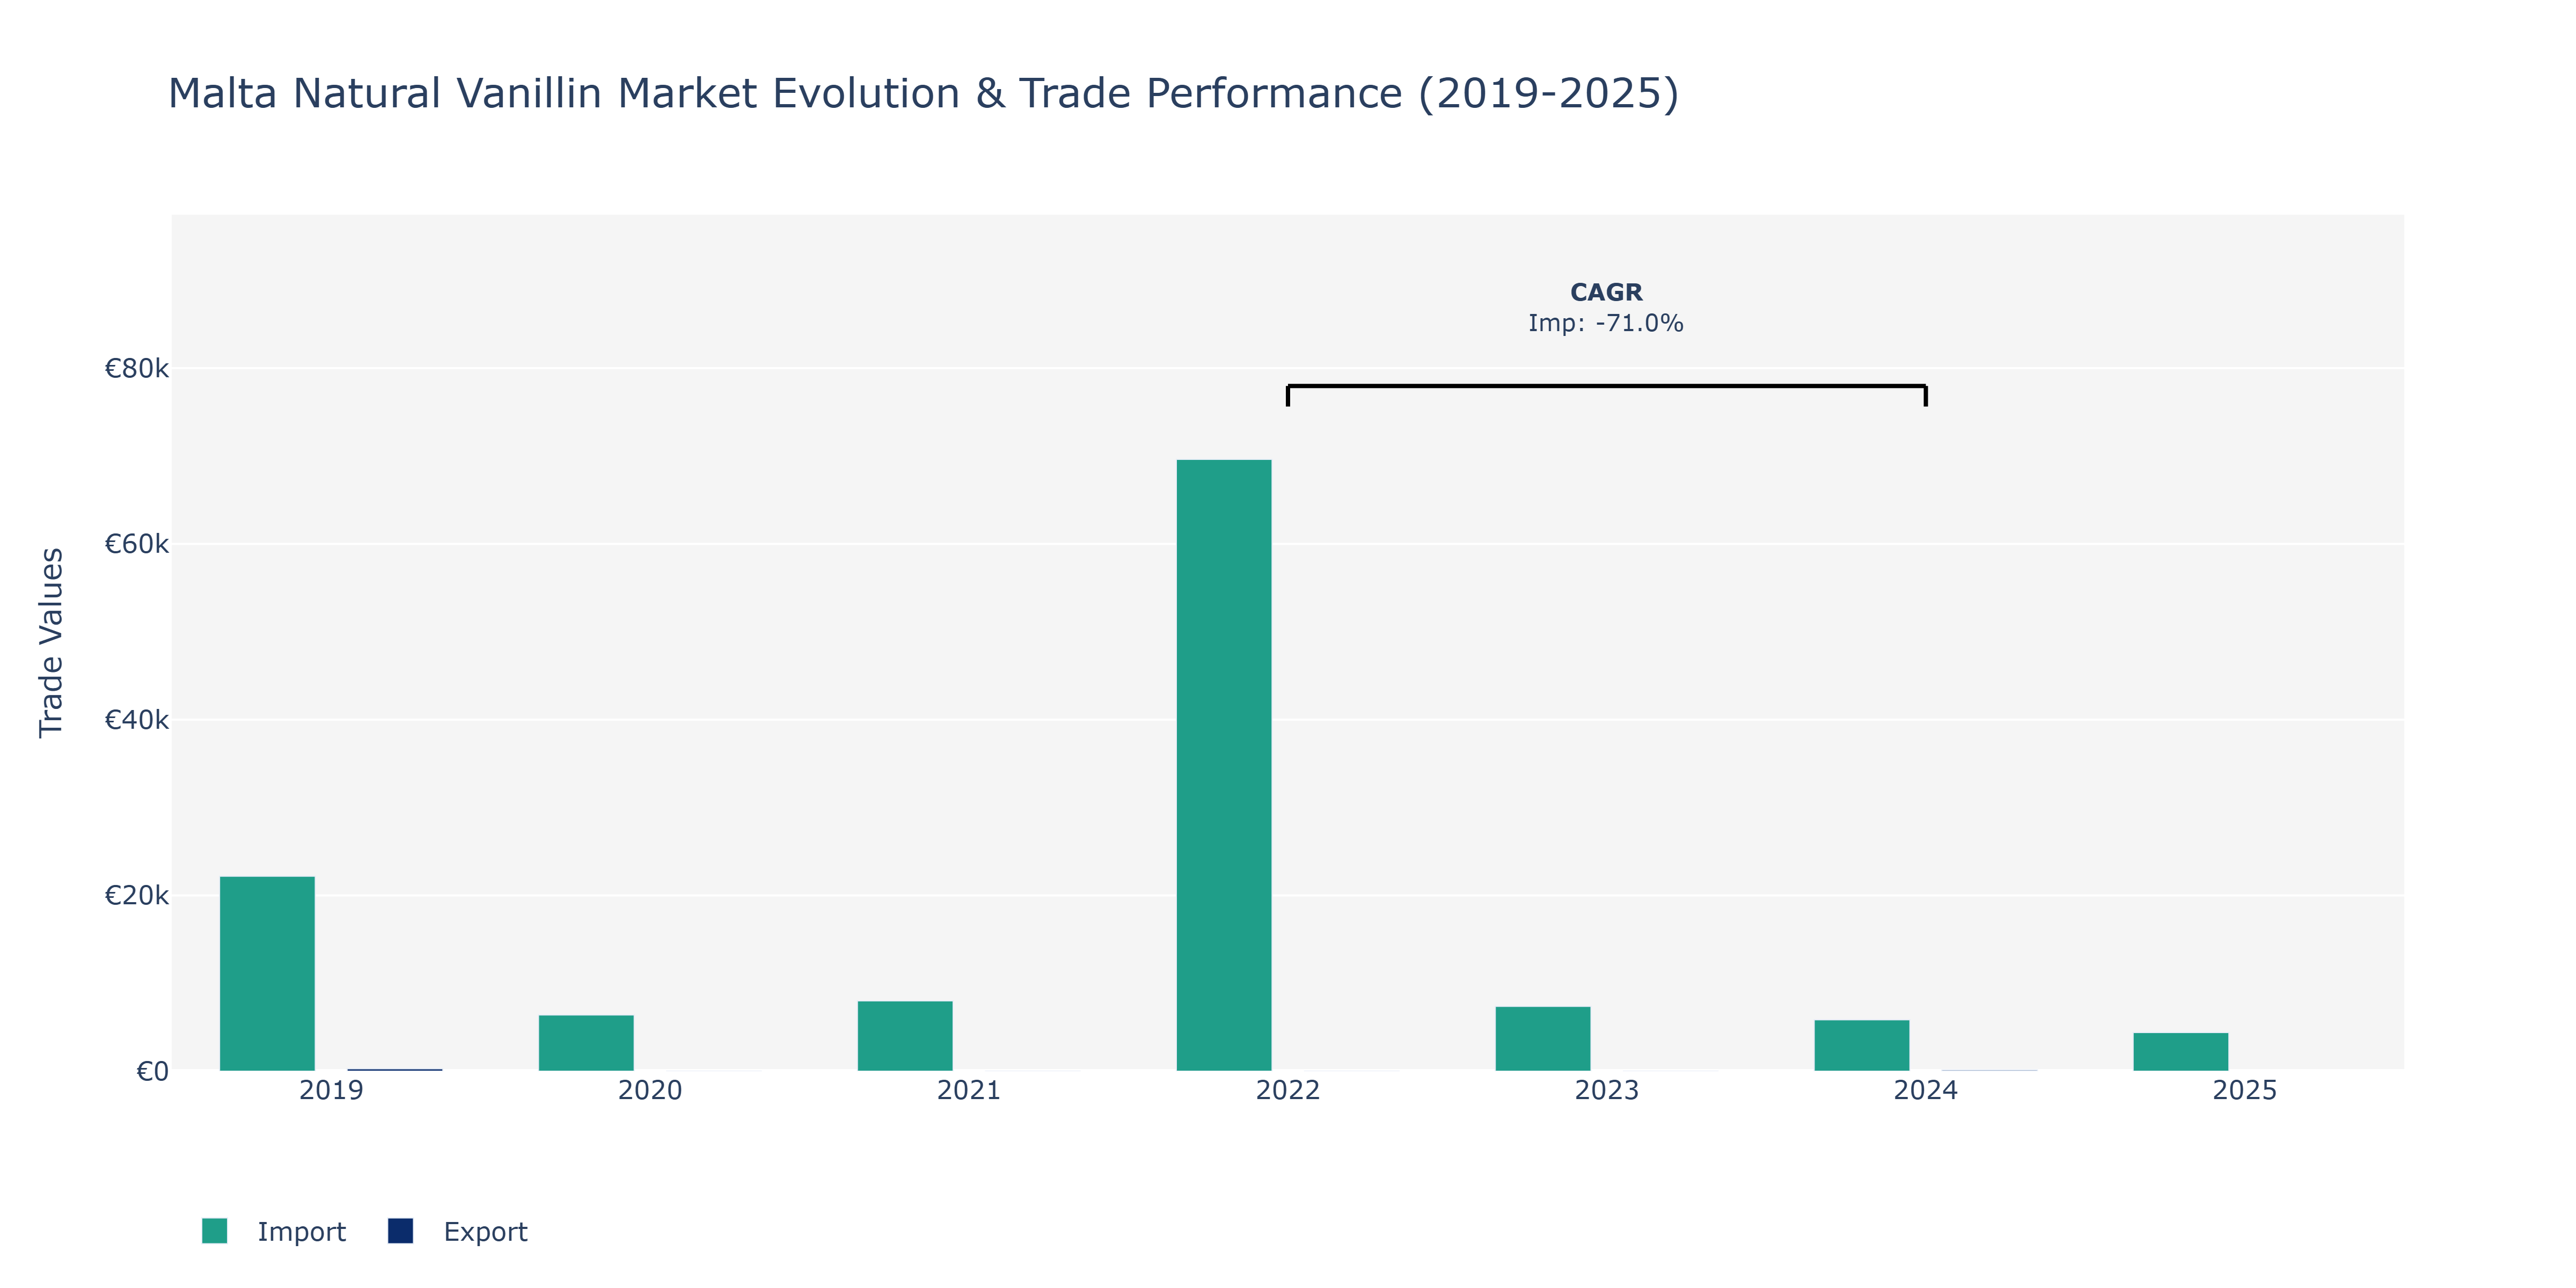
In the Malta Natural Vanillin Market, from 2019 to 2025, the exports of natural vanillin displayed a fluctuating pattern. In 2019, exports stood at €270 million, dropping significantly in 2024 to €135 million. This decline may be attributed to various factors such as changes in global demand, pricing dynamics, or shifts in production capacity. On the import side, the market witnessed substantial growth from 2019 to 2022, with imports soaring from €22.18 thousand to €69.62 thousand. This remarkable surge could be linked to increased domestic consumption, expanding product portfolios, or enhanced trade relations. However, a noticeable decline occurred in 2023 with imports falling to €7.38 thousand followed by a further decrease in 2025 to €4.39 thousand. Such fluctuations in imports might be influenced by regulatory changes, supply chain disruptions, or evolving consumer preferences. These trends highlight the market's sensitivity to various external factors, necessitating stakeholders to adapt strategies to navigate through dynamic market conditions.
Key Highlights of the Report:
- Malta Natural Vanillin Market Outlook
- Market Size of Malta Natural Vanillin Market, 2025
- Forecast of Malta Natural Vanillin Market, 2032
- Historical Data and Forecast of Malta Natural Vanillin Revenues & Volume for the Period 2022 - 2032F
- Malta Natural Vanillin Market Trend Evolution
- Malta Natural Vanillin Market Drivers and Challenges
- Malta Natural Vanillin Price Trends
- Malta Natural Vanillin Porter`s Five Forces
- Malta Natural Vanillin Industry Life Cycle
- Historical Data and Forecast of Malta Natural Vanillin Market Revenues & Volume By Source for the Period 2022 - 2032F
- Historical Data and Forecast of Malta Natural Vanillin Market Revenues & Volume By Vanilla Bean Extract for the Period 2022 - 2032F
- Historical Data and Forecast of Malta Natural Vanillin Market Revenues & Volume By Ferulic Acid Synthesis for the Period 2022 - 2032F
- Historical Data and Forecast of Malta Natural Vanillin Market Revenues & Volume By Eugenol Synthesis for the Period 2022 - 2032F
- Historical Data and Forecast of Malta Natural Vanillin Market Revenues & Volume By Application for the Period 2022 - 2032F
- Historical Data and Forecast of Malta Natural Vanillin Market Revenues & Volume By Food & Beverages for the Period 2022 - 2032F
- Historical Data and Forecast of Malta Natural Vanillin Market Revenues & Volume By Pharmaceuticals for the Period 2022 - 2032F
- Historical Data and Forecast of Malta Natural Vanillin Market Revenues & Volume By Cosmetics & Personal Care for the Period 2022 - 2032F
- Malta Natural Vanillin Import Export Trade Statistics
- Market Opportunity Assessment By Source
- Market Opportunity Assessment By Application
- Malta Natural Vanillin Top Companies Market Share
- Malta Natural Vanillin Competitive Benchmarking By Technical and Operational Parameters
- Malta Natural Vanillin Company Profiles
- Malta Natural Vanillin Key Strategic Recommendations
Frequently Asked Questions About the Market Study (FAQs):
6Wresearch actively monitors the Malta Natural Vanillin Market and publishes its comprehensive annual report, highlighting emerging trends, growth drivers, revenue analysis, and forecast outlook. Our insights help businesses to make data-backed strategic decisions with ongoing market dynamics. Our analysts track relevent industries related to the Malta Natural Vanillin Market, allowing our clients with actionable intelligence and reliable forecasts tailored to emerging regional needs.
Yes, we provide customisation as per your requirements. To learn more, feel free to contact us on sales@6wresearch.com
1 Executive Summary |
2 Introduction |
2.1 Key Highlights of the Report |
2.2 Report Description |
2.3 Market Scope & Segmentation |
2.4 Research Methodology |
2.5 Assumptions |
3 Malta Natural Vanillin Market Overview |
3.1 Malta Country Macro Economic Indicators |
3.2 Malta Natural Vanillin Market Revenues & Volume, 2022 & 2032F |
3.3 Malta Natural Vanillin Market - Industry Life Cycle |
3.4 Malta Natural Vanillin Market - Porter's Five Forces |
3.5 Malta Natural Vanillin Market Revenues & Volume Share, By Source, 2022 & 2032F |
3.6 Malta Natural Vanillin Market Revenues & Volume Share, By Application, 2022 & 2032F |
4 Malta Natural Vanillin Market Dynamics |
4.1 Impact Analysis |
4.2 Market Drivers |
4.2.1 Increasing consumer preference for natural ingredients in food and beverages |
4.2.2 Growing awareness about the health benefits of natural vanillin |
4.2.3 Rise in demand for organic and clean label products |
4.3 Market Restraints |
4.3.1 Fluctuating prices of raw materials used in the production of natural vanillin |
4.3.2 Stringent regulations and certifications required for natural vanillin production |
4.3.3 Limited availability of natural sources of vanillin |
5 Malta Natural Vanillin Market Trends |
6 Malta Natural Vanillin Market Segmentations |
6.1 Malta Natural Vanillin Market, By Source |
6.1.1 Overview and Analysis |
6.1.2 Malta Natural Vanillin Market Revenues & Volume, By Vanilla Bean Extract, 2022 - 2032F |
6.1.3 Malta Natural Vanillin Market Revenues & Volume, By Ferulic Acid Synthesis, 2022 - 2032F |
6.1.4 Malta Natural Vanillin Market Revenues & Volume, By Eugenol Synthesis, 2022 - 2032F |
6.2 Malta Natural Vanillin Market, By Application |
6.2.1 Overview and Analysis |
6.2.2 Malta Natural Vanillin Market Revenues & Volume, By Food & Beverages, 2022 - 2032F |
6.2.3 Malta Natural Vanillin Market Revenues & Volume, By Pharmaceuticals, 2022 - 2032F |
6.2.4 Malta Natural Vanillin Market Revenues & Volume, By Cosmetics & Personal Care, 2022 - 2032F |
7 Malta Natural Vanillin Market Import-Export Trade Statistics |
7.1 Malta Natural Vanillin Market Export to Major Countries |
7.2 Malta Natural Vanillin Market Imports from Major Countries |
8 Malta Natural Vanillin Market Key Performance Indicators |
8.1 Percentage of food and beverage products using natural vanillin as an ingredient |
8.2 Number of new product launches featuring natural vanillin |
8.3 Consumer surveys indicating preference for natural vanillin in products |
9 Malta Natural Vanillin Market - Opportunity Assessment |
9.1 Malta Natural Vanillin Market Opportunity Assessment, By Source, 2022 & 2032F |
9.2 Malta Natural Vanillin Market Opportunity Assessment, By Application, 2022 & 2032F |
10 Malta Natural Vanillin Market - Competitive Landscape |
10.1 Malta Natural Vanillin Market Revenue Share, By Companies, 2025 |
10.2 Malta Natural Vanillin Market Competitive Benchmarking, By Operating and Technical Parameters |
11 Company Profiles |
12 Recommendations | 13 Disclaimer |
Global Go To Market Strategy - 2030
Export potential enables firms to identify high-growth global markets with greater confidence by combining advanced trade intelligence with a structured quantitative methodology. The framework analyzes emerging demand trends and country-level import patterns while integrating macroeconomic and trade datasets such as GDP and population forecasts, bilateral import–export flows, tariff structures, elasticity differentials between developed and developing economies, geographic distance, and import demand projections. Using weighted trade values from 2020–2024 as the base period to project country-to-country export potential for 2030, these inputs are operationalized through calculated drivers such as gravity model parameters, tariff impact factors, and projected GDP per-capita growth. Through an analysis of hidden potentials, demand hotspots, and market conditions that are most favorable to success, this method enables firms to focus on target countries, maximize returns, and global expansion with data, backed by accuracy.
By factoring in the projected importer demand gap that is currently unmet and could be potential opportunity, it identifies the potential for the Exporter (Country) among 190 countries, against the general trade analysis, which identifies the biggest importer or exporter.
To discover high-growth global markets and optimize your business strategy:
Click Here
Pricing
- Single User License$ 1,995
- Department License$ 2,400
- Site License$ 3,120
- Global License$ 3,795

Leadership Perspectives from Industry Events
Search
Thought Leadership and Analyst Meet


Our Clients
6WResearch In News
- Doha a strategic location for EV manufacturing hub: IPA Qatar
- Demand for luxury TVs surging in the GCC, says Samsung
- Empowering Growth: The Thriving Journey of Bangladesh’s Cable Industry
- Demand for luxury TVs surging in the GCC, says Samsung
- Video call with a traditional healer? Once unthinkable, it’s now common in South Africa
- Intelligent Buildings To Smooth GCC’s Path To Net Zero
Latest Reports
- New Zealand Aseptic Manufacturing Market (2026-2032)
- Netherlands Aseptic Manufacturing Market (2026-2032)
- Nauru Aseptic Manufacturing Market (2026-2032)
- Namibia Aseptic Manufacturing Market (2026-2032)
- Mozambique Aseptic Manufacturing Market (2026-2032)
- Montenegro Aseptic Manufacturing Market (2026-2032)
- Mongolia Aseptic Manufacturing Market (2026-2032)
- Monaco Aseptic Manufacturing Market (2026-2032)
- Micronesia Aseptic Manufacturing Market (2026-2032)
- Mauritius Aseptic Manufacturing Market (2026-2032)
Industry Events and Analyst Meet

HIMTEX 2026

India Refining Summit 2026

India EV Show 2026

EV tech India Expo 2026

Auto Tech Asia 2026
Whitepaper
- Middle East & Africa Commercial Security Market Click here to view more.
- Middle East & Africa Fire Safety Systems & Equipment Market Click here to view more.
- GCC Drone Market Click here to view more.
- Middle East Lighting Fixture Market Click here to view more.
- GCC Physical & Perimeter Security Market Click here to view more.