Malta Oilfield Stimulation Chemicals Market (2026-2032) | Value, Revenue, Companies, Size, Industry, Analysis, Share, Forecast, Growth, Segmentation, Outlook & Trends
Market Forecast By Types (Gelling Agents, Surfactants, Friction reducers, Corrosion , Scale Inhibitors, Acids), By Application (Hydraulic Fracturing, Matrix Acidization, Acid Fracking) And Competitive Landscape
| Product Code: ETC5662787 | Publication Date: Nov 2023 | Updated Date: Apr 2026 | Product Type: Market Research Report | |
| Publisher: 6Wresearch | Author: Ravi Bhandari | No. of Pages: 60 | No. of Figures: 30 | No. of Tables: 5 |
Malta Oilfield Stimulation Chemicals Market Size (2020-2030)
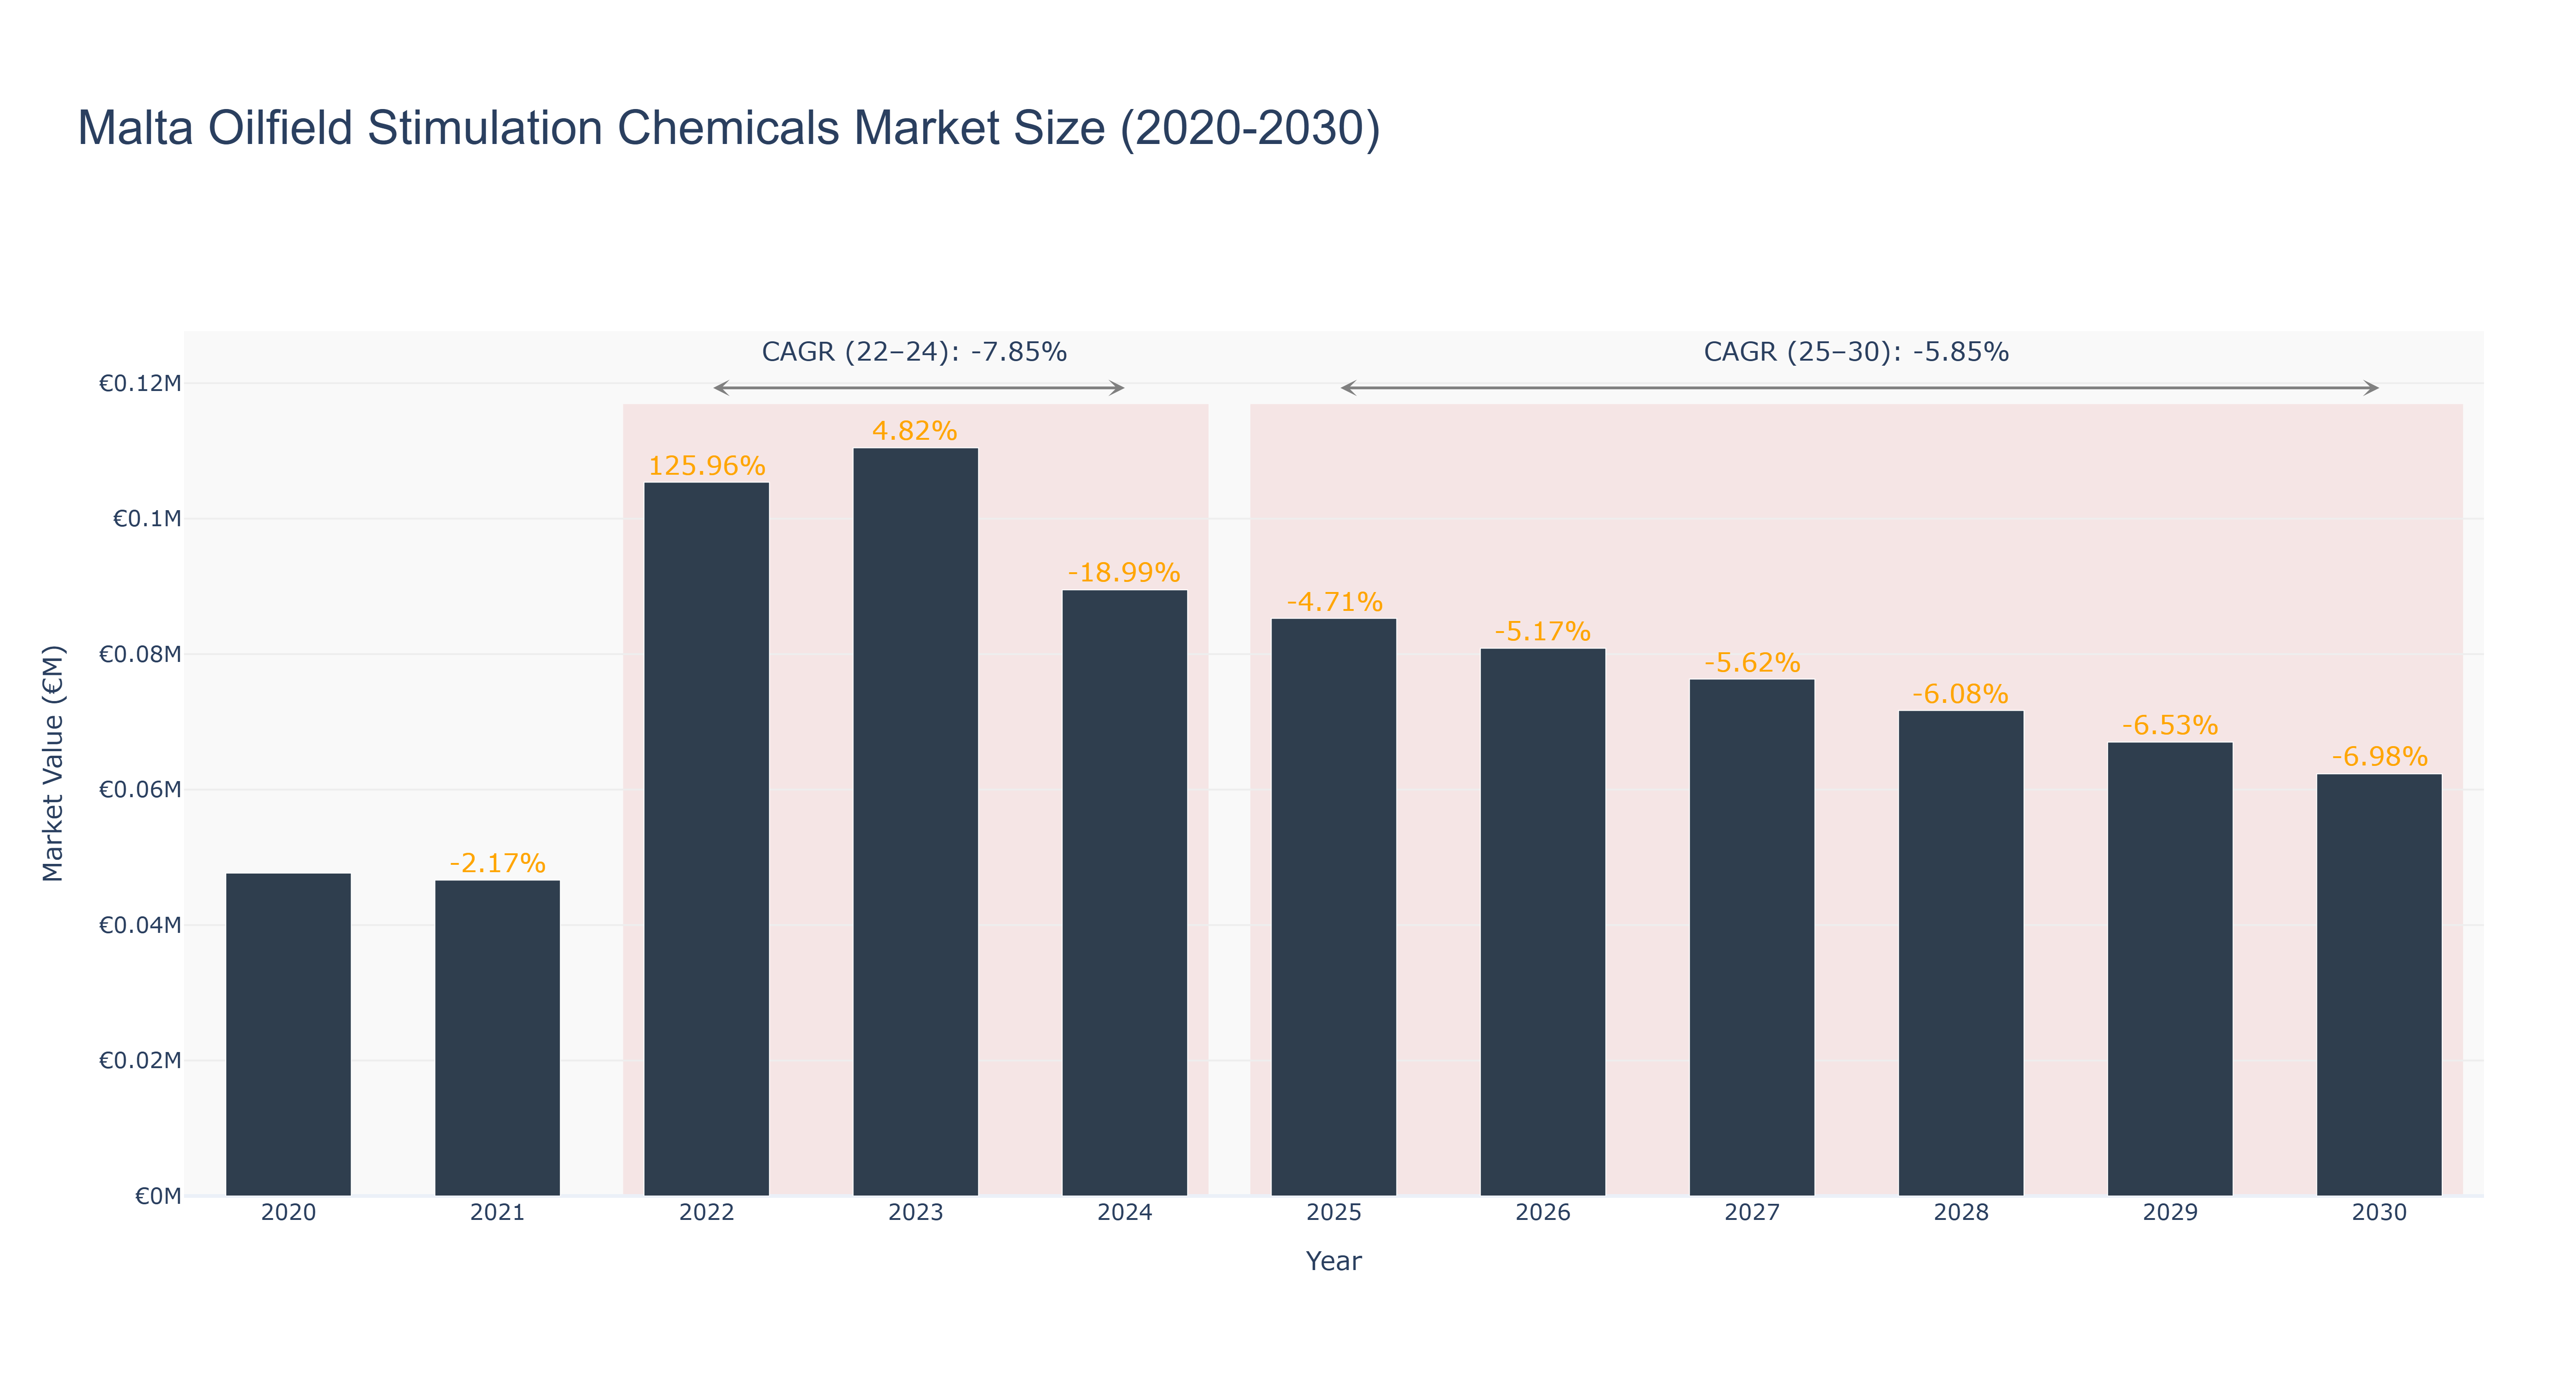
The Malta Oilfield Stimulation Chemicals Market experienced significant fluctuations from 2020 to 2024, peaking in 2022 with a market size of €105.38 thousand, followed by a notable decline in 2024 to €89.49 thousand. This period showed a Compound Annual Growth Rate (CAGR) of -7.85%, reflecting volatility influenced by global market dynamics and shifting demand for oilfield services. The forecasted outlook from 2025 to 2030 suggests continued contraction, with projected market sizes decreasing to €62.33 thousand by 2030, resulting in a CAGR of -5.85%. Factors contributing to this decline include potential regulatory changes, market saturation, and increased competition from alternative energy sources. While specific upcoming projects in Malta's oilfield sector remain uncertain, the broader industry may face challenges that could further impact growth trajectories, emphasizing the need for strategic adaptation within this evolving market landscape.
Malta Oilfield Stimulation Chemicals Market: Production & Trade Performance (2019-2025)
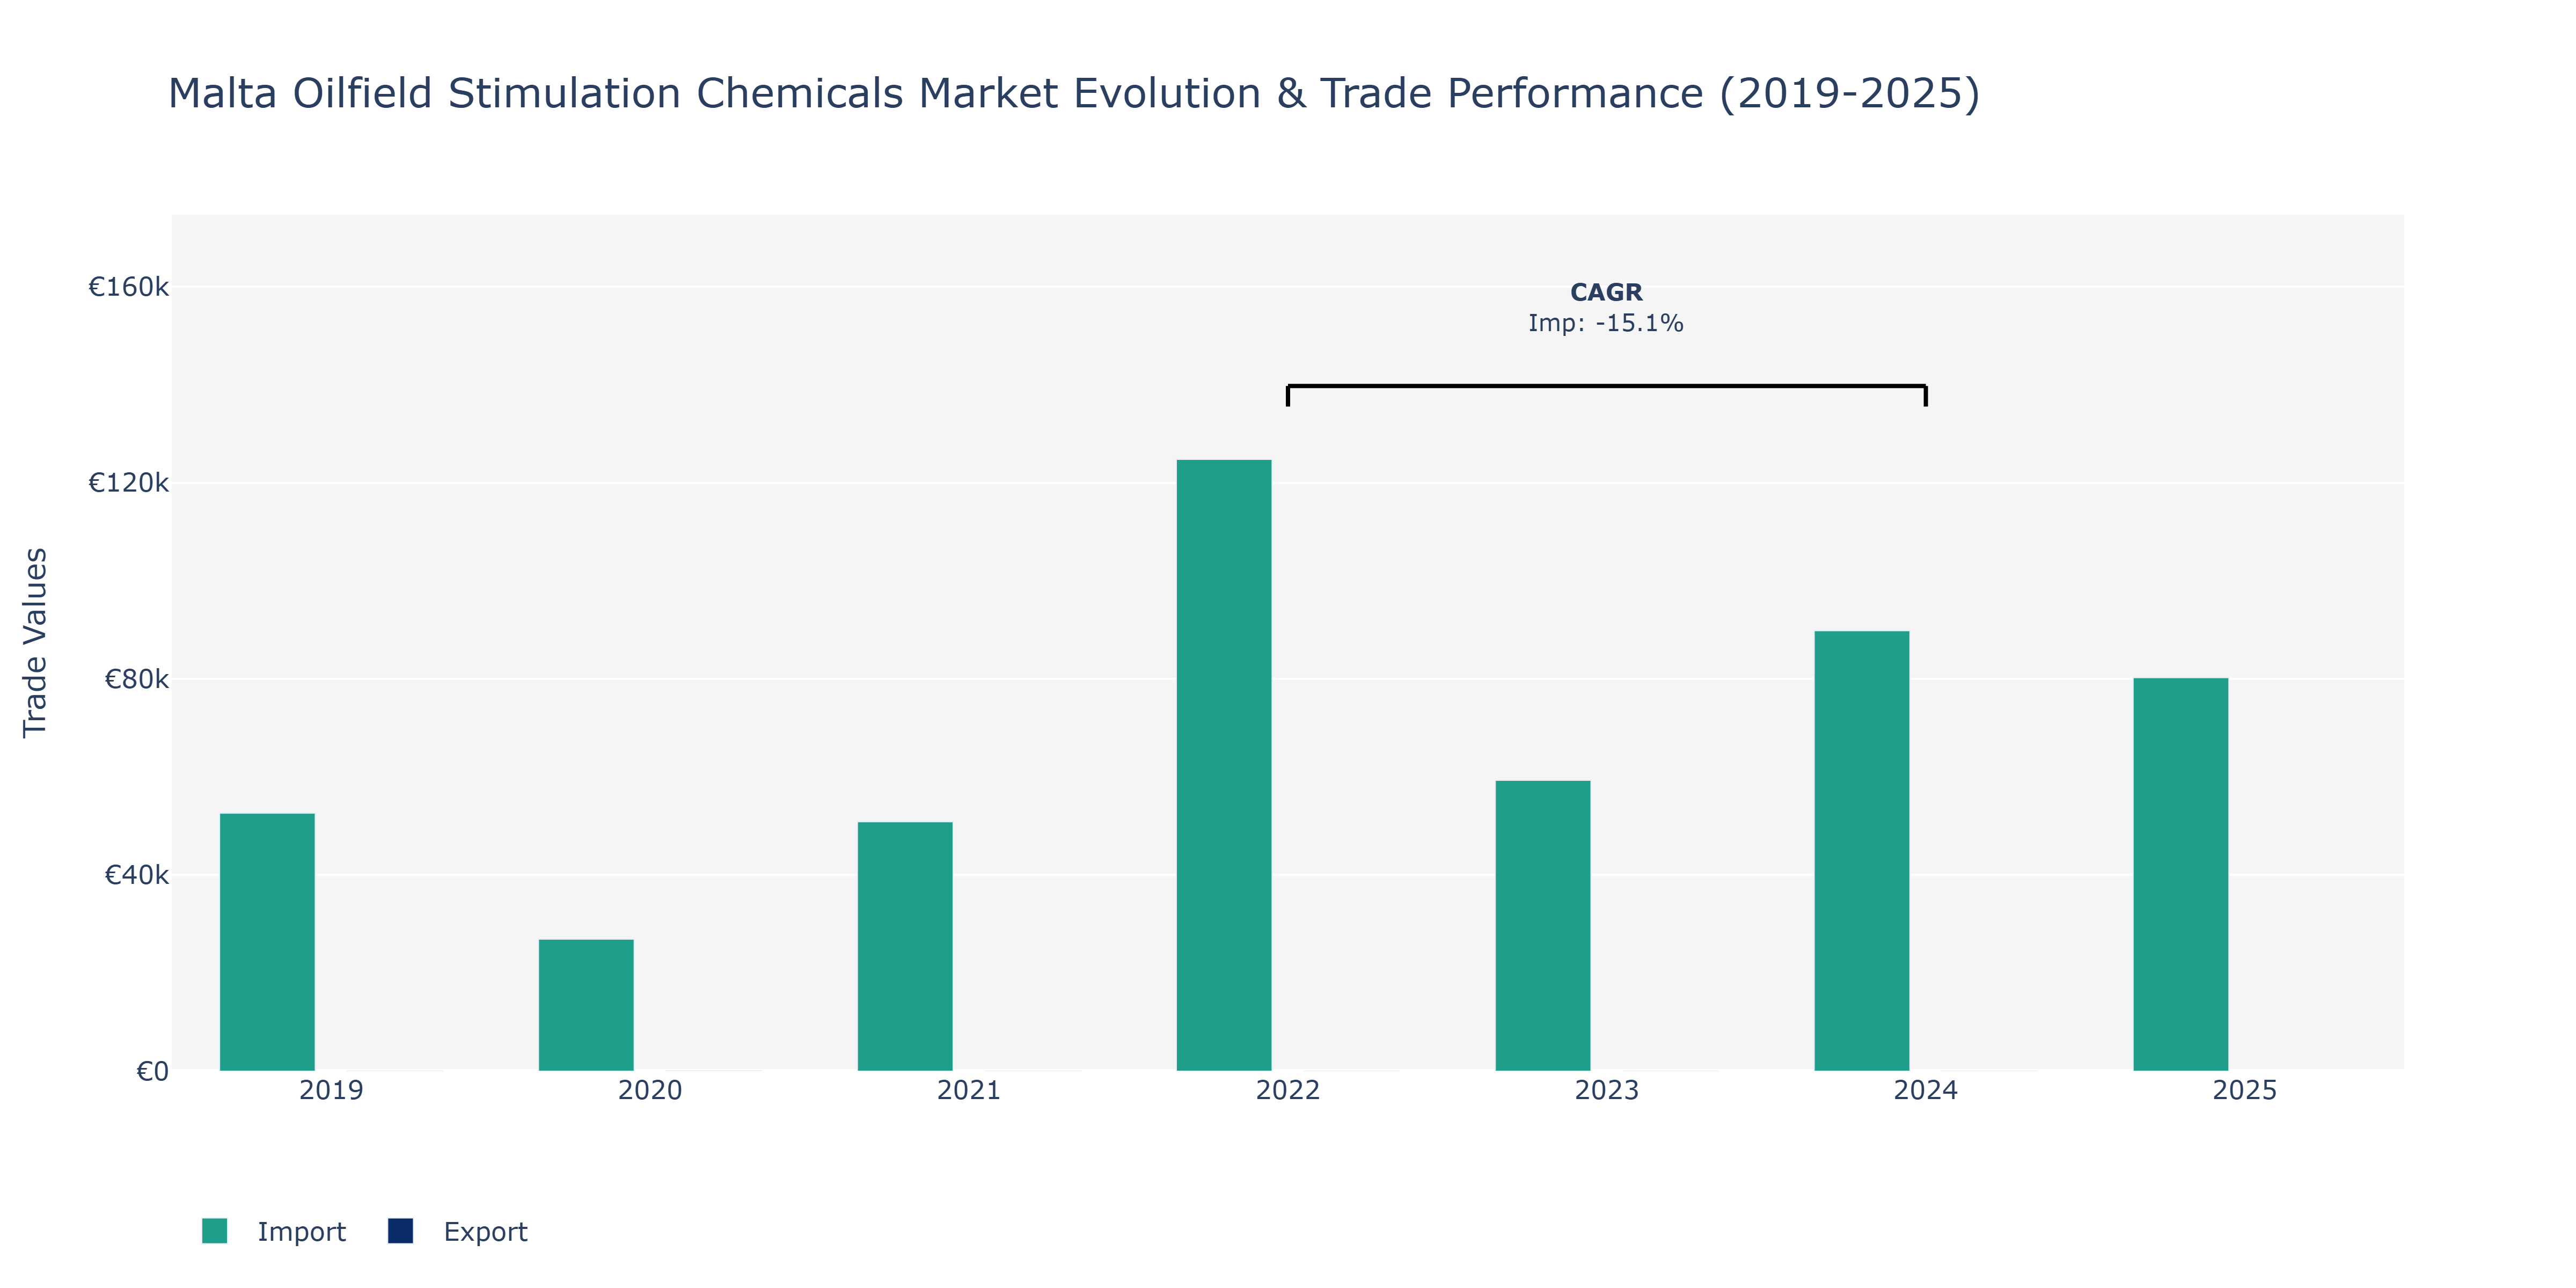
The Malta Oilfield Stimulation Chemicals Market witnessed notable fluctuations in Exports and Imports between 2019 and 2025. In 2019, Exports stood at €40 thousand, increasing by 100% to reach €80 thousand in 2020, before experiencing a sharp decline to €15 thousand in 2021. Subsequently, Exports dropped further to €14 thousand in 2024. On the other hand, Imports started at €52.61 thousand in 2019, decreased to €26.94 thousand in 2020, and then surged to €50.87 thousand in 2021. The peak Import value of €124.78 thousand was observed in 2022, coinciding with a negative CAGR of -15.15% between 2022 and 2024. Import values decreased to €59.32 thousand in 2023, €89.84 thousand in 2024, and €80.25 thousand in 2025. These fluctuations can be attributed to global oil demand dynamics, geopolitical factors affecting trade patterns, and the evolving regulatory landscape impacting the oil and gas industry. As the market continues to adapt to changing market conditions, companies operating in the Malta Oilfield Stimulation Chemicals Market may need to focus on enhancing supply chain resilience and fostering strategic partnerships to navigate uncertainties and optimize trade flows.
Key Highlights of the Report:
- Malta Oilfield Stimulation Chemicals Market Outlook
- Market Size of Malta Oilfield Stimulation Chemicals Market, 2025
- Forecast of Malta Oilfield Stimulation Chemicals Market, 2032
- Historical Data and Forecast of Malta Oilfield Stimulation Chemicals Revenues & Volume for the Period 2022 - 2032F
- Malta Oilfield Stimulation Chemicals Market Trend Evolution
- Malta Oilfield Stimulation Chemicals Market Drivers and Challenges
- Malta Oilfield Stimulation Chemicals Price Trends
- Malta Oilfield Stimulation Chemicals Porter`s Five Forces
- Malta Oilfield Stimulation Chemicals Industry Life Cycle
- Historical Data and Forecast of Malta Oilfield Stimulation Chemicals Market Revenues & Volume By Types for the Period 2022 - 2032F
- Historical Data and Forecast of Malta Oilfield Stimulation Chemicals Market Revenues & Volume By Gelling Agents for the Period 2022 - 2032F
- Historical Data and Forecast of Malta Oilfield Stimulation Chemicals Market Revenues & Volume By Surfactants for the Period 2022 - 2032F
- Historical Data and Forecast of Malta Oilfield Stimulation Chemicals Market Revenues & Volume By Friction reducers for the Period 2022 - 2032F
- Historical Data and Forecast of Malta Oilfield Stimulation Chemicals Market Revenues & Volume By Corrosion for the Period 2022 - 2032F
- Historical Data and Forecast of Malta Oilfield Stimulation Chemicals Market Revenues & Volume By Scale Inhibitors for the Period 2022 - 2032F
- Historical Data and Forecast of Malta Oilfield Stimulation Chemicals Market Revenues & Volume By Acids for the Period 2022 - 2032F
- Historical Data and Forecast of Malta Oilfield Stimulation Chemicals Market Revenues & Volume By Application for the Period 2022 - 2032F
- Historical Data and Forecast of Malta Oilfield Stimulation Chemicals Market Revenues & Volume By Hydraulic Fracturing for the Period 2022 - 2032F
- Historical Data and Forecast of Malta Oilfield Stimulation Chemicals Market Revenues & Volume By Matrix Acidization for the Period 2022 - 2032F
- Historical Data and Forecast of Malta Oilfield Stimulation Chemicals Market Revenues & Volume By Acid Fracking for the Period 2022 - 2032F
- Malta Oilfield Stimulation Chemicals Import Export Trade Statistics
- Market Opportunity Assessment By Types
- Market Opportunity Assessment By Application
- Malta Oilfield Stimulation Chemicals Top Companies Market Share
- Malta Oilfield Stimulation Chemicals Competitive Benchmarking By Technical and Operational Parameters
- Malta Oilfield Stimulation Chemicals Company Profiles
- Malta Oilfield Stimulation Chemicals Key Strategic Recommendations
Frequently Asked Questions About the Market Study (FAQs):
6Wresearch actively monitors the Malta Oilfield Stimulation Chemicals Market and publishes its comprehensive annual report, highlighting emerging trends, growth drivers, revenue analysis, and forecast outlook. Our insights help businesses to make data-backed strategic decisions with ongoing market dynamics. Our analysts track relevent industries related to the Malta Oilfield Stimulation Chemicals Market, allowing our clients with actionable intelligence and reliable forecasts tailored to emerging regional needs.
Yes, we provide customisation as per your requirements. To learn more, feel free to contact us on sales@6wresearch.com
1 Executive Summary |
2 Introduction |
2.1 Key Highlights of the Report |
2.2 Report Description |
2.3 Market Scope & Segmentation |
2.4 Research Methodology |
2.5 Assumptions |
3 Malta Oilfield Stimulation Chemicals Market Overview |
3.1 Malta Country Macro Economic Indicators |
3.2 Malta Oilfield Stimulation Chemicals Market Revenues & Volume, 2022 & 2032F |
3.3 Malta Oilfield Stimulation Chemicals Market - Industry Life Cycle |
3.4 Malta Oilfield Stimulation Chemicals Market - Porter's Five Forces |
3.5 Malta Oilfield Stimulation Chemicals Market Revenues & Volume Share, By Types, 2022 & 2032F |
3.6 Malta Oilfield Stimulation Chemicals Market Revenues & Volume Share, By Application, 2022 & 2032F |
4 Malta Oilfield Stimulation Chemicals Market Dynamics |
4.1 Impact Analysis |
4.2 Market Drivers |
4.2.1 Increasing demand for oil and gas production in Malta |
4.2.2 Technological advancements in oilfield stimulation chemicals |
4.2.3 Government initiatives to boost oilfield activities in the region |
4.3 Market Restraints |
4.3.1 Stringent environmental regulations impacting the use of certain chemicals |
4.3.2 Volatility in oil prices affecting investment in oilfield stimulation activities |
5 Malta Oilfield Stimulation Chemicals Market Trends |
6 Malta Oilfield Stimulation Chemicals Market Segmentations |
6.1 Malta Oilfield Stimulation Chemicals Market, By Types |
6.1.1 Overview and Analysis |
6.1.2 Malta Oilfield Stimulation Chemicals Market Revenues & Volume, By Gelling Agents, 2022 - 2032F |
6.1.3 Malta Oilfield Stimulation Chemicals Market Revenues & Volume, By Surfactants, 2022 - 2032F |
6.1.4 Malta Oilfield Stimulation Chemicals Market Revenues & Volume, By Friction reducers, 2022 - 2032F |
6.1.5 Malta Oilfield Stimulation Chemicals Market Revenues & Volume, By Corrosion , 2022 - 2032F |
6.1.6 Malta Oilfield Stimulation Chemicals Market Revenues & Volume, By Scale Inhibitors, 2022 - 2032F |
6.1.7 Malta Oilfield Stimulation Chemicals Market Revenues & Volume, By Acids, 2022 - 2032F |
6.2 Malta Oilfield Stimulation Chemicals Market, By Application |
6.2.1 Overview and Analysis |
6.2.2 Malta Oilfield Stimulation Chemicals Market Revenues & Volume, By Hydraulic Fracturing, 2022 - 2032F |
6.2.3 Malta Oilfield Stimulation Chemicals Market Revenues & Volume, By Matrix Acidization, 2022 - 2032F |
6.2.4 Malta Oilfield Stimulation Chemicals Market Revenues & Volume, By Acid Fracking, 2022 - 2032F |
7 Malta Oilfield Stimulation Chemicals Market Import-Export Trade Statistics |
7.1 Malta Oilfield Stimulation Chemicals Market Export to Major Countries |
7.2 Malta Oilfield Stimulation Chemicals Market Imports from Major Countries |
8 Malta Oilfield Stimulation Chemicals Market Key Performance Indicators |
8.1 Research and development investment in new oilfield stimulation chemical technologies |
8.2 Adoption rate of environmentally friendly oilfield stimulation chemicals |
8.3 Number of new oilfield stimulation projects initiated in Malta. |
9 Malta Oilfield Stimulation Chemicals Market - Opportunity Assessment |
9.1 Malta Oilfield Stimulation Chemicals Market Opportunity Assessment, By Types, 2022 & 2032F |
9.2 Malta Oilfield Stimulation Chemicals Market Opportunity Assessment, By Application, 2022 & 2032F |
10 Malta Oilfield Stimulation Chemicals Market - Competitive Landscape |
10.1 Malta Oilfield Stimulation Chemicals Market Revenue Share, By Companies, 2025 |
10.2 Malta Oilfield Stimulation Chemicals Market Competitive Benchmarking, By Operating and Technical Parameters |
11 Company Profiles |
12 Recommendations | 13 Disclaimer |
Global Go To Market Strategy - 2030
Export potential enables firms to identify high-growth global markets with greater confidence by combining advanced trade intelligence with a structured quantitative methodology. The framework analyzes emerging demand trends and country-level import patterns while integrating macroeconomic and trade datasets such as GDP and population forecasts, bilateral import–export flows, tariff structures, elasticity differentials between developed and developing economies, geographic distance, and import demand projections. Using weighted trade values from 2020–2024 as the base period to project country-to-country export potential for 2030, these inputs are operationalized through calculated drivers such as gravity model parameters, tariff impact factors, and projected GDP per-capita growth. Through an analysis of hidden potentials, demand hotspots, and market conditions that are most favorable to success, this method enables firms to focus on target countries, maximize returns, and global expansion with data, backed by accuracy.
By factoring in the projected importer demand gap that is currently unmet and could be potential opportunity, it identifies the potential for the Exporter (Country) among 190 countries, against the general trade analysis, which identifies the biggest importer or exporter.
To discover high-growth global markets and optimize your business strategy:
Click Here
Pricing
- Single User License$ 1,995
- Department License$ 2,400
- Site License$ 3,120
- Global License$ 3,795

Leadership Perspectives from Industry Events
Search
Thought Leadership and Analyst Meet


Our Clients
6WResearch In News
- India Export Attractiveness Tracker 2026
- India Air Conditioner Market Set for Strong Rebound in 2026 After Weather-Led Correction and GST-Driven Recovery: 6Wresearch
- ADAS in India: How Automatic Emergency Braking, Blind Spot Detection & Driver Monitoring are Transforming Road Safety
- Doha a strategic location for EV manufacturing hub: IPA Qatar
- Demand for luxury TVs surging in the GCC, says Samsung
- Empowering Growth: The Thriving Journey of Bangladesh’s Cable Industry
Latest Reports
- Qatar Access and Home Network Market (2026-2032)
- Nicaragua RPG Gaming Market (2026-2032)
- New Zealand RPG Gaming Market (2026-2032)
- Netherlands RPG Gaming Market (2026-2032)
- Nauru RPG Gaming Market (2026-2032)
- Namibia RPG Gaming Market (2026-2032)
- Mozambique RPG Gaming Market (2026-2032)
- Montenegro RPG Gaming Market (2026-2032)
- Mongolia RPG Gaming Market (2026-2032)
- Monaco RPG Gaming Market (2026-2032)
Industry Events and Analyst Meet

EV India Expo 2026

HIMTEX 2026

India Refining Summit 2026

India EV Show 2026

EV tech India Expo 2026
Whitepaper
- Middle East & Africa Commercial Security Market Click here to view more.
- Middle East & Africa Fire Safety Systems & Equipment Market Click here to view more.
- GCC Drone Market Click here to view more.
- Middle East Lighting Fixture Market Click here to view more.
- GCC Physical & Perimeter Security Market Click here to view more.