Malta Orange Juice Market (2026-2032) | Outlook, Segmentation, Share, Growth, Revenue, Analysis, Industry, Value, Size, Trends, Forecast & Companies
Market Forecast By Product Type (Frozen Concentrated Orange Juice, Not From Concentrate, Canned Orange Juice, Fresh-Squeezed Orange juice, Dehydrated Orange Juice, Others), By Packaging (Tetra Pak, PP Material Bottle, Metal Can, Others), By Distribution Channel (Offline Channel, Online Channel) And Competitive Landscape
| Product Code: ETC5018687 | Publication Date: Nov 2023 | Updated Date: Apr 2026 | Product Type: Market Research Report | |
| Publisher: 6Wresearch | Author: Shubham Padhi | No. of Pages: 60 | No. of Figures: 30 | No. of Tables: 5 |
Malta Orange Juice Market Size (2020-2030)
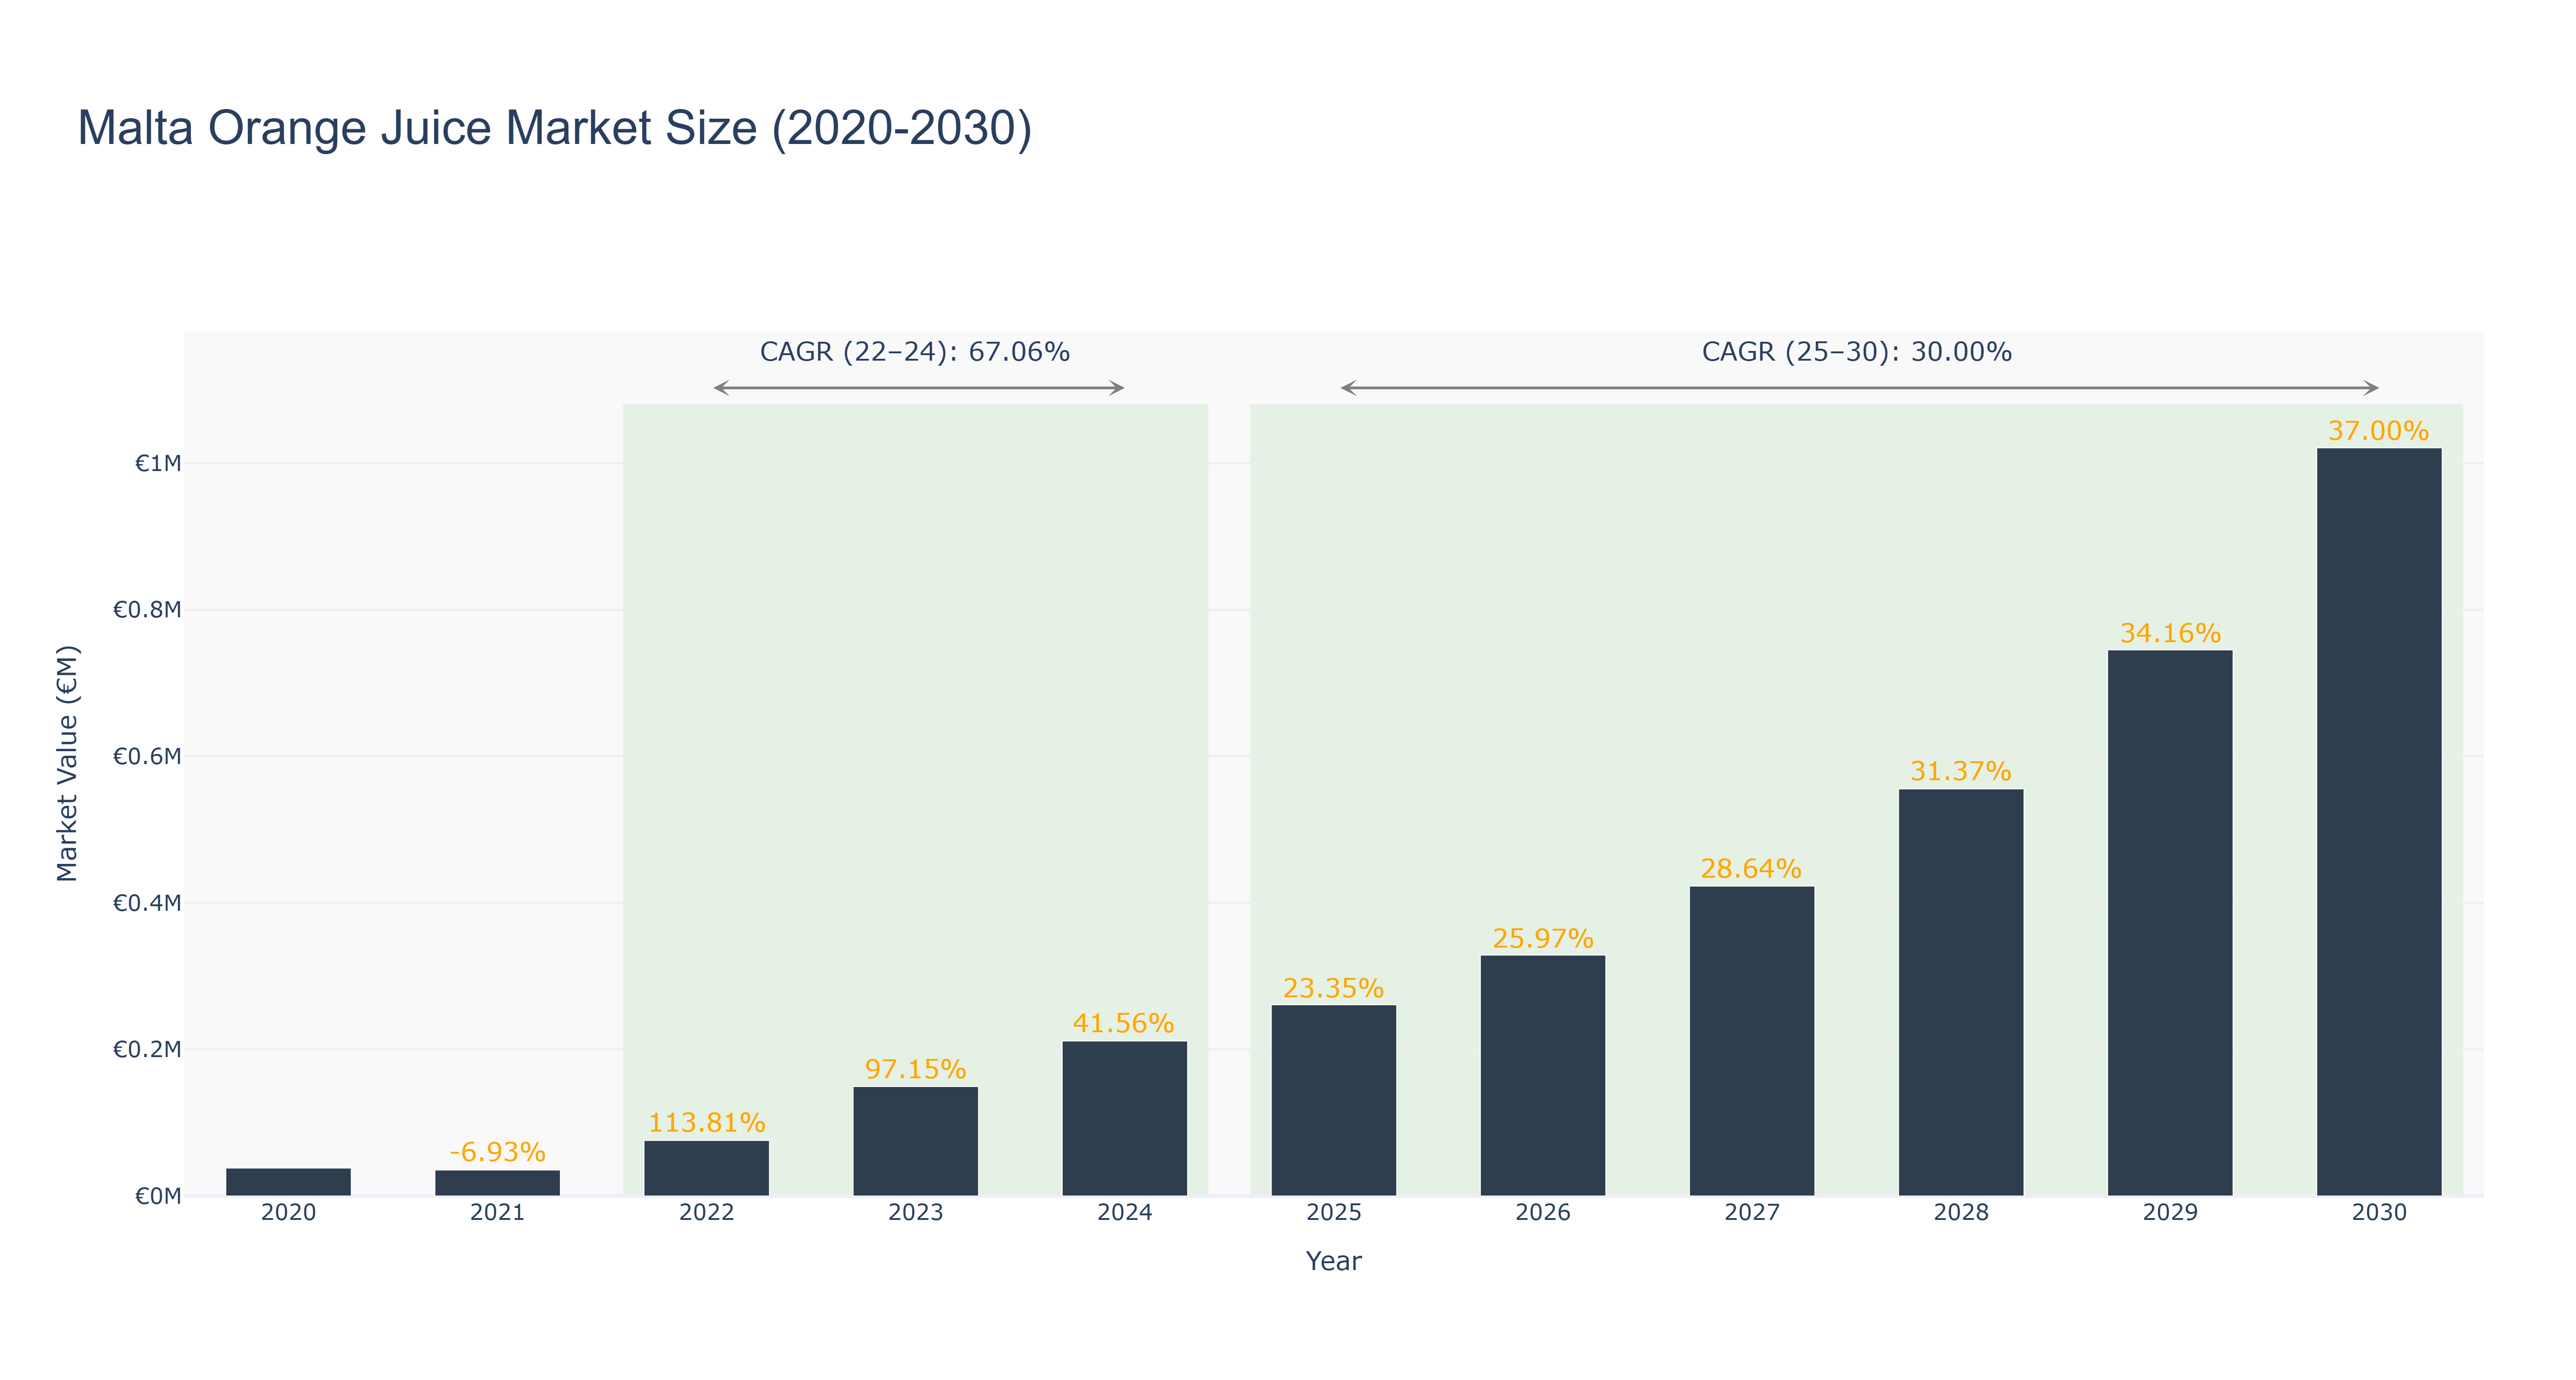
Malta Orange Juice Market has shown a steady growth trajectory over the past decade. The peak market size of €1.02 million was achieved in 2030, with consistent growth year over year. From 2020 to 2024, the market size increased from €0.04 million to €0.21 million due to a combination of increasing consumer demand and strategic marketing efforts. The forecasted market size from 2025 to 2030 is expected to see further growth, with a CAGR of 30.0%. The CAGR from 2022-24 was notably high at 67.06%, indicating a period of rapid expansion. Industry drivers such as health-conscious consumer trends and innovative product offerings have contributed to this positive trend. Looking ahead, upcoming developments in sustainable packaging and enhanced distribution channels are poised to fuel continued growth in the Malta Orange Juice Market.
Malta Orange Juice Market: Production & Trade Performance (2019-2025)
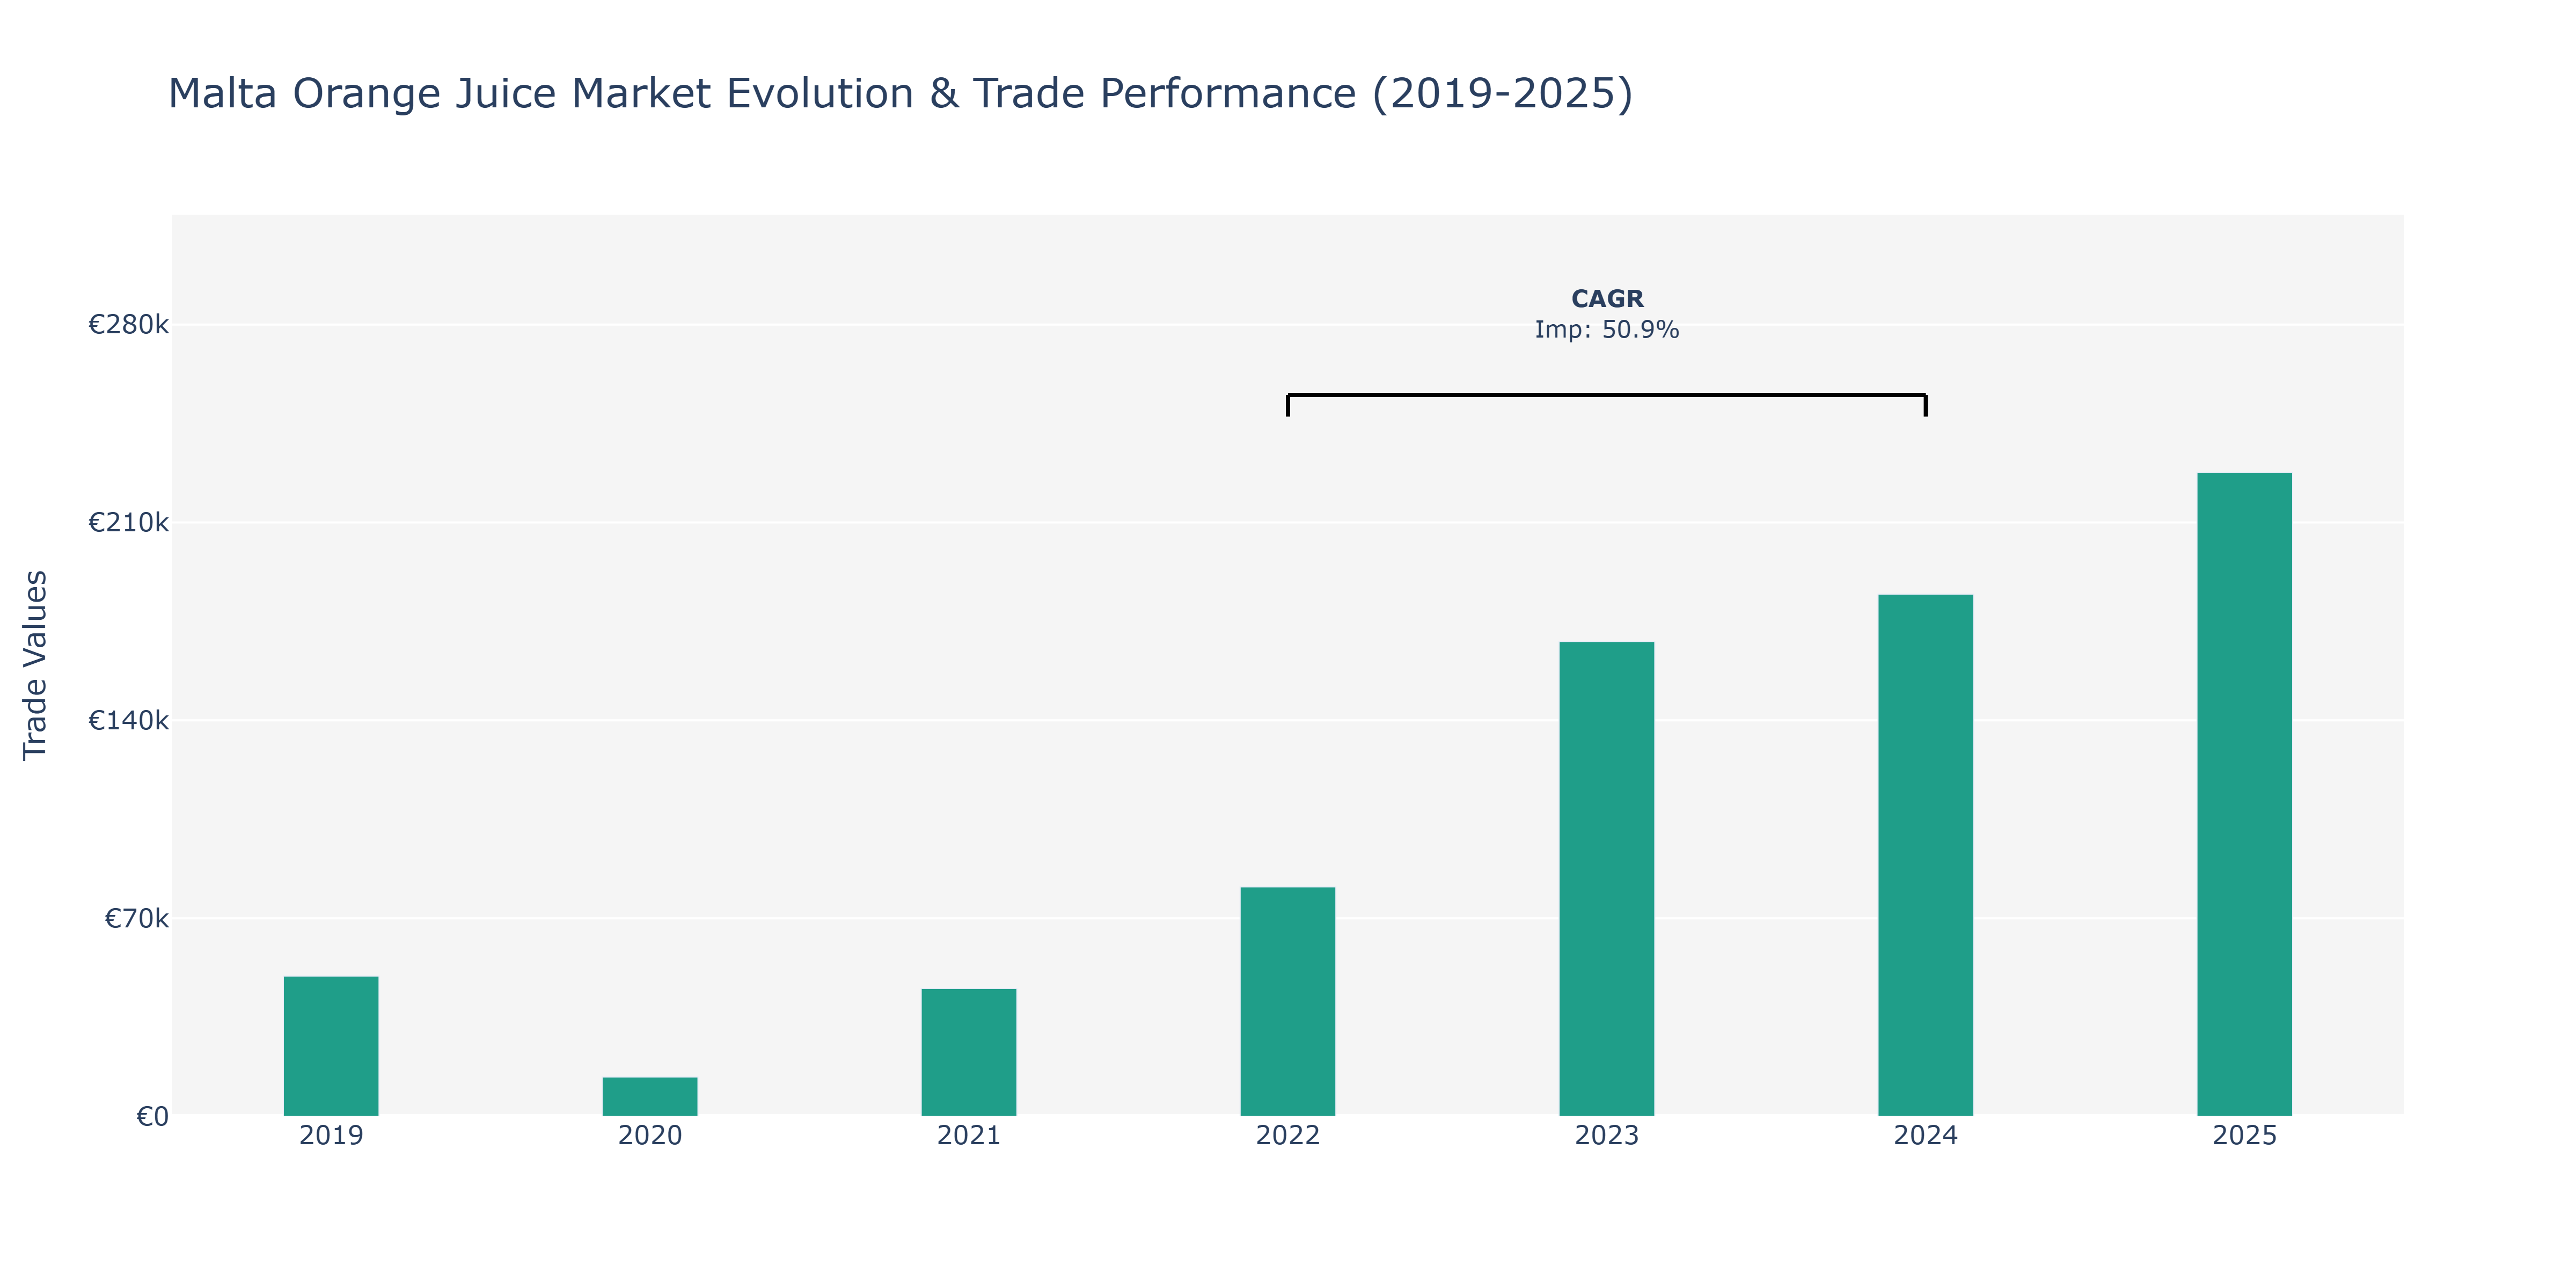
Imports in the Malta Orange Juice Market experienced fluctuations over the years, with a noticeable increase from 2019 to 2023. In 2019, imports stood at €49.58 thousand, followed by a significant drop to €13.9 thousand in 2020, likely influenced by global supply chain disruptions. However, a strong rebound occurred in 2021, reaching €45.18 thousand, indicating a recovery phase. The peak point was observed in 2025, with imports totaling €227.75 thousand, reflecting a growing consumer demand trend for orange juice products. The market's expansion can be attributed to various factors such as increasing health consciousness among consumers, rising disposable incomes, and promotional activities by key players to capture a larger market share. The CAGR of 50.85% from 2022 to 2024 suggests a rapid growth phase, aligning with the broader trend of consumers prioritizing healthier beverage options, thus driving the import volumes in the Malta Orange Juice Market.
Key Highlights of the Report:
- Malta Orange Juice Market Outlook
- Market Size of Malta Orange Juice Market, 2025
- Forecast of Malta Orange Juice Market, 2032
- Historical Data and Forecast of Malta Orange Juice Revenues & Volume for the Period 2022 - 2032F
- Malta Orange Juice Market Trend Evolution
- Malta Orange Juice Market Drivers and Challenges
- Malta Orange Juice Price Trends
- Malta Orange Juice Porter`s Five Forces
- Malta Orange Juice Industry Life Cycle
- Historical Data and Forecast of Malta Orange Juice Market Revenues & Volume By Product Type for the Period 2022 - 2032F
- Historical Data and Forecast of Malta Orange Juice Market Revenues & Volume By Frozen Concentrated Orange Juice for the Period 2022 - 2032F
- Historical Data and Forecast of Malta Orange Juice Market Revenues & Volume By Not From Concentrate for the Period 2022 - 2032F
- Historical Data and Forecast of Malta Orange Juice Market Revenues & Volume By Canned Orange Juice for the Period 2022 - 2032F
- Historical Data and Forecast of Malta Orange Juice Market Revenues & Volume By Fresh-Squeezed Orange juice, for the Period 2022 - 2032F
- Historical Data and Forecast of Malta Orange Juice Market Revenues & Volume By Dehydrated Orange Juice for the Period 2022 - 2032F
- Historical Data and Forecast of Malta Orange Juice Market Revenues & Volume By Others for the Period 2022 - 2032F
- Historical Data and Forecast of Malta Orange Juice Market Revenues & Volume By Packaging for the Period 2022 - 2032F
- Historical Data and Forecast of Malta Orange Juice Market Revenues & Volume By Tetra Pak for the Period 2022 - 2032F
- Historical Data and Forecast of Malta Orange Juice Market Revenues & Volume By PP Material Bottle for the Period 2022 - 2032F
- Historical Data and Forecast of Malta Orange Juice Market Revenues & Volume By Metal Can for the Period 2022 - 2032F
- Historical Data and Forecast of Malta Orange Juice Market Revenues & Volume By Others for the Period 2022 - 2032F
- Historical Data and Forecast of Malta Orange Juice Market Revenues & Volume By Distribution Channel for the Period 2022 - 2032F
- Historical Data and Forecast of Malta Orange Juice Market Revenues & Volume By Offline Channel for the Period 2022 - 2032F
- Historical Data and Forecast of Malta Orange Juice Market Revenues & Volume By Online Channel for the Period 2022 - 2032F
- Malta Orange Juice Import Export Trade Statistics
- Market Opportunity Assessment By Product Type
- Market Opportunity Assessment By Packaging
- Market Opportunity Assessment By Distribution Channel
- Malta Orange Juice Top Companies Market Share
- Malta Orange Juice Competitive Benchmarking By Technical and Operational Parameters
- Malta Orange Juice Company Profiles
- Malta Orange Juice Key Strategic Recommendations
Frequently Asked Questions About the Market Study (FAQs):
6Wresearch actively monitors the Malta Orange Juice Market and publishes its comprehensive annual report, highlighting emerging trends, growth drivers, revenue analysis, and forecast outlook. Our insights help businesses to make data-backed strategic decisions with ongoing market dynamics. Our analysts track relevent industries related to the Malta Orange Juice Market, allowing our clients with actionable intelligence and reliable forecasts tailored to emerging regional needs.
Yes, we provide customisation as per your requirements. To learn more, feel free to contact us on sales@6wresearch.com
1 Executive Summary |
2 Introduction |
2.1 Key Highlights of the Report |
2.2 Report Description |
2.3 Market Scope & Segmentation |
2.4 Research Methodology |
2.5 Assumptions |
3 Malta Orange Juice Market Overview |
3.1 Malta Country Macro Economic Indicators |
3.2 Malta Orange Juice Market Revenues & Volume, 2022 & 2032F |
3.3 Malta Orange Juice Market - Industry Life Cycle |
3.4 Malta Orange Juice Market - Porter's Five Forces |
3.5 Malta Orange Juice Market Revenues & Volume Share, By Product Type, 2022 & 2032F |
3.6 Malta Orange Juice Market Revenues & Volume Share, By Packaging, 2022 & 2032F |
3.7 Malta Orange Juice Market Revenues & Volume Share, By Distribution Channel, 2022 & 2032F |
4 Malta Orange Juice Market Dynamics |
4.1 Impact Analysis |
4.2 Market Drivers |
4.3 Market Restraints |
5 Malta Orange Juice Market Trends |
6 Malta Orange Juice Market Segmentations |
6.1 Malta Orange Juice Market, By Product Type |
6.1.1 Overview and Analysis |
6.1.2 Malta Orange Juice Market Revenues & Volume, By Frozen Concentrated Orange Juice, 2022 - 2032F |
6.1.3 Malta Orange Juice Market Revenues & Volume, By Not From Concentrate, 2022 - 2032F |
6.1.4 Malta Orange Juice Market Revenues & Volume, By Canned Orange Juice, 2022 - 2032F |
6.1.5 Malta Orange Juice Market Revenues & Volume, By Fresh-Squeezed Orange juice,, 2022 - 2032F |
6.1.6 Malta Orange Juice Market Revenues & Volume, By Dehydrated Orange Juice, 2022 - 2032F |
6.1.7 Malta Orange Juice Market Revenues & Volume, By Others, 2022 - 2032F |
6.2 Malta Orange Juice Market, By Packaging |
6.2.1 Overview and Analysis |
6.2.2 Malta Orange Juice Market Revenues & Volume, By Tetra Pak, 2022 - 2032F |
6.2.3 Malta Orange Juice Market Revenues & Volume, By PP Material Bottle, 2022 - 2032F |
6.2.4 Malta Orange Juice Market Revenues & Volume, By Metal Can, 2022 - 2032F |
6.2.5 Malta Orange Juice Market Revenues & Volume, By Others, 2022 - 2032F |
6.3 Malta Orange Juice Market, By Distribution Channel |
6.3.1 Overview and Analysis |
6.3.2 Malta Orange Juice Market Revenues & Volume, By Offline Channel, 2022 - 2032F |
6.3.3 Malta Orange Juice Market Revenues & Volume, By Online Channel, 2022 - 2032F |
7 Malta Orange Juice Market Import-Export Trade Statistics |
7.1 Malta Orange Juice Market Export to Major Countries |
7.2 Malta Orange Juice Market Imports from Major Countries |
8 Malta Orange Juice Market Key Performance Indicators |
9 Malta Orange Juice Market - Opportunity Assessment |
9.1 Malta Orange Juice Market Opportunity Assessment, By Product Type, 2022 & 2032F |
9.2 Malta Orange Juice Market Opportunity Assessment, By Packaging, 2022 & 2032F |
9.3 Malta Orange Juice Market Opportunity Assessment, By Distribution Channel, 2022 & 2032F |
10 Malta Orange Juice Market - Competitive Landscape |
10.1 Malta Orange Juice Market Revenue Share, By Companies, 2025 |
10.2 Malta Orange Juice Market Competitive Benchmarking, By Operating and Technical Parameters |
11 Company Profiles |
12 Recommendations | 13 Disclaimer |
Export potential assessment - trade Analytics for 2030
Export potential enables firms to identify high-growth global markets with greater confidence by combining advanced trade intelligence with a structured quantitative methodology. The framework analyzes emerging demand trends and country-level import patterns while integrating macroeconomic and trade datasets such as GDP and population forecasts, bilateral import–export flows, tariff structures, elasticity differentials between developed and developing economies, geographic distance, and import demand projections. Using weighted trade values from 2020–2024 as the base period to project country-to-country export potential for 2030, these inputs are operationalized through calculated drivers such as gravity model parameters, tariff impact factors, and projected GDP per-capita growth. Through an analysis of hidden potentials, demand hotspots, and market conditions that are most favorable to success, this method enables firms to focus on target countries, maximize returns, and global expansion with data, backed by accuracy.
By factoring in the projected importer demand gap that is currently unmet and could be potential opportunity, it identifies the potential for the Exporter (Country) among 190 countries, against the general trade analysis, which identifies the biggest importer or exporter.
To discover high-growth global markets and optimize your business strategy:
Click Here
Pricing
- Single User License$ 1,995
- Department License$ 2,400
- Site License$ 3,120
- Global License$ 3,795

Search
Thought Leadership and Analyst Meet


Our Clients
Latest Reports
- France Thermally Conductive Filler Dispersants Market (2026-2032) | Challenges, Restraints, Value, Share, Size, segmentation, Analysis, Trends, Investment Opportunities, Outlook, Pricing, Demand, Forecast, Revenue, Companies, Growth, Drivers, Strategy, Insights, Competition
- Egypt Thermally Conductive Filler Dispersants Market (2026-2032) | Competition, Forecast, Strategy, Value, Insights, Outlook, Investment Opportunities, Pricing, Demand, Share, segmentation, Drivers, Size, Companies, Restraints, Growth, Trends, Revenue, Challenges, Analysis
- Czech Republic Thermally Conductive Filler Dispersants Market (2026-2032) | Forecast, Pricing, Analysis, Drivers, Insights, Size, Demand, Growth, Challenges, segmentation, Competition, Outlook, Trends, Investment Opportunities, Companies, Strategy, Revenue, Share, Value, Restraints
- Colombia Thermally Conductive Filler Dispersants Market (2026-2032) | segmentation, Trends, Share, Drivers, Strategy, Companies, Demand, Insights, Size, Challenges, Value, Competition, Analysis, Growth, Revenue, Restraints, Forecast, Pricing, Outlook, Investment Opportunities
- China Thermally Conductive Filler Dispersants Market (2026-2032) | Restraints, Investment Opportunities, Pricing, Companies, Share, Size, Challenges, Trends, Outlook, Value, Analysis, Competition, Revenue, Drivers, Forecast, Demand, Insights, Growth, Strategy, segmentation
- Chile Thermally Conductive Filler Dispersants Market (2026-2032) | Investment Opportunities, Trends, Value, Restraints, Share, Companies, Forecast, segmentation, Pricing, Challenges, Demand, Size, Analysis, Drivers, Outlook, Growth, Competition, Strategy, Revenue, Insights
- Cambodia Thermally Conductive Filler Dispersants Market (2026-2032) | Analysis, Share, Outlook, Strategy, Pricing, Demand, Size, Growth, segmentation, Insights, Revenue, Forecast, Challenges, Competition, Companies, Investment Opportunities, Trends, Restraints, Value, Drivers
- Brazil Thermally Conductive Filler Dispersants Market (2026-2032) | Restraints, Forecast, Competition, Size, Revenue, Value, Investment Opportunities, Trends, Insights, Outlook, Growth, Analysis, Drivers, segmentation, Pricing, Challenges, Strategy, Share, Companies, Demand
- Bangladesh Thermally Conductive Filler Dispersants Market (2026-2032) | Restraints, Trends, Analysis, Competition, Insights, Forecast, Value, Investment Opportunities, Pricing, Share, Demand, Outlook, Revenue, segmentation, Companies, Drivers, Growth, Size, Challenges, Strategy
- Bahrain Thermally Conductive Filler Dispersants Market (2026-2032) | Trends, Outlook, Pricing, Demand, Value, Competition, Forecast, Growth, segmentation, Revenue, Companies, Analysis, Insights, Size, Drivers, Challenges, Strategy, Investment Opportunities, Share, Restraints
Industry Events and Analyst Meet

HIMTEX 2026

India Refining Summit 2026

India EV Show 2026

EV tech India Expo 2026

Auto Tech Asia 2026
Whitepaper
- Middle East & Africa Commercial Security Market Click here to view more.
- Middle East & Africa Fire Safety Systems & Equipment Market Click here to view more.
- GCC Drone Market Click here to view more.
- Middle East Lighting Fixture Market Click here to view more.
- GCC Physical & Perimeter Security Market Click here to view more.
6WResearch In News
- Doha a strategic location for EV manufacturing hub: IPA Qatar
- Demand for luxury TVs surging in the GCC, says Samsung
- Empowering Growth: The Thriving Journey of Bangladesh’s Cable Industry
- Demand for luxury TVs surging in the GCC, says Samsung
- Video call with a traditional healer? Once unthinkable, it’s now common in South Africa
- Intelligent Buildings To Smooth GCC’s Path To Net Zero