Myanmar Printed Electronics Market (2026-2032) Outlook | Revenue, Trends, Share, Analysis, Industry, Forecast, Value, Size, Companies & Growth
Market Forecast By Material (Ink, Substrate), By Technology (Screen, Inkjet, Flexographic, Gravure), By Device (Displays, Photovoltaic, Lighting, RFID, Others) And Competitive Landscape
| Product Code: ETC255094 | Publication Date: Aug 2022 | Updated Date: Jul 2026 | Product Type: Market Research Report | |
| Publisher: 6Wresearch | Author: Ravi Bhandari | No. of Pages: 75 | No. of Figures: 35 | No. of Tables: 20 |
Myanmar Printed Electronics Market Size, Share & Growth Rate
The Myanmar Printed Electronics Market was estimated at USD 283 Million in 2025 and is projected to reach USD 389 Million by 2032, growing at a CAGR of 4.6% from 2026 to 2032. This growth trajectory is supported by the increasing demand for cost-effective and lightweight electronic solutions, particularly in the automotive and consumer electronics sectors. Moreover, the ongoing advancements in printing technology further enhance the potential for innovative applications in displays, sensors, and wearable devices.
Myanmar Printed Electronics Market Year-wise Growth Rate and Key Drivers
This graph highlights how the Myanmar Printed Electronics Market has steadily grown over the years, supported by major growth factors.
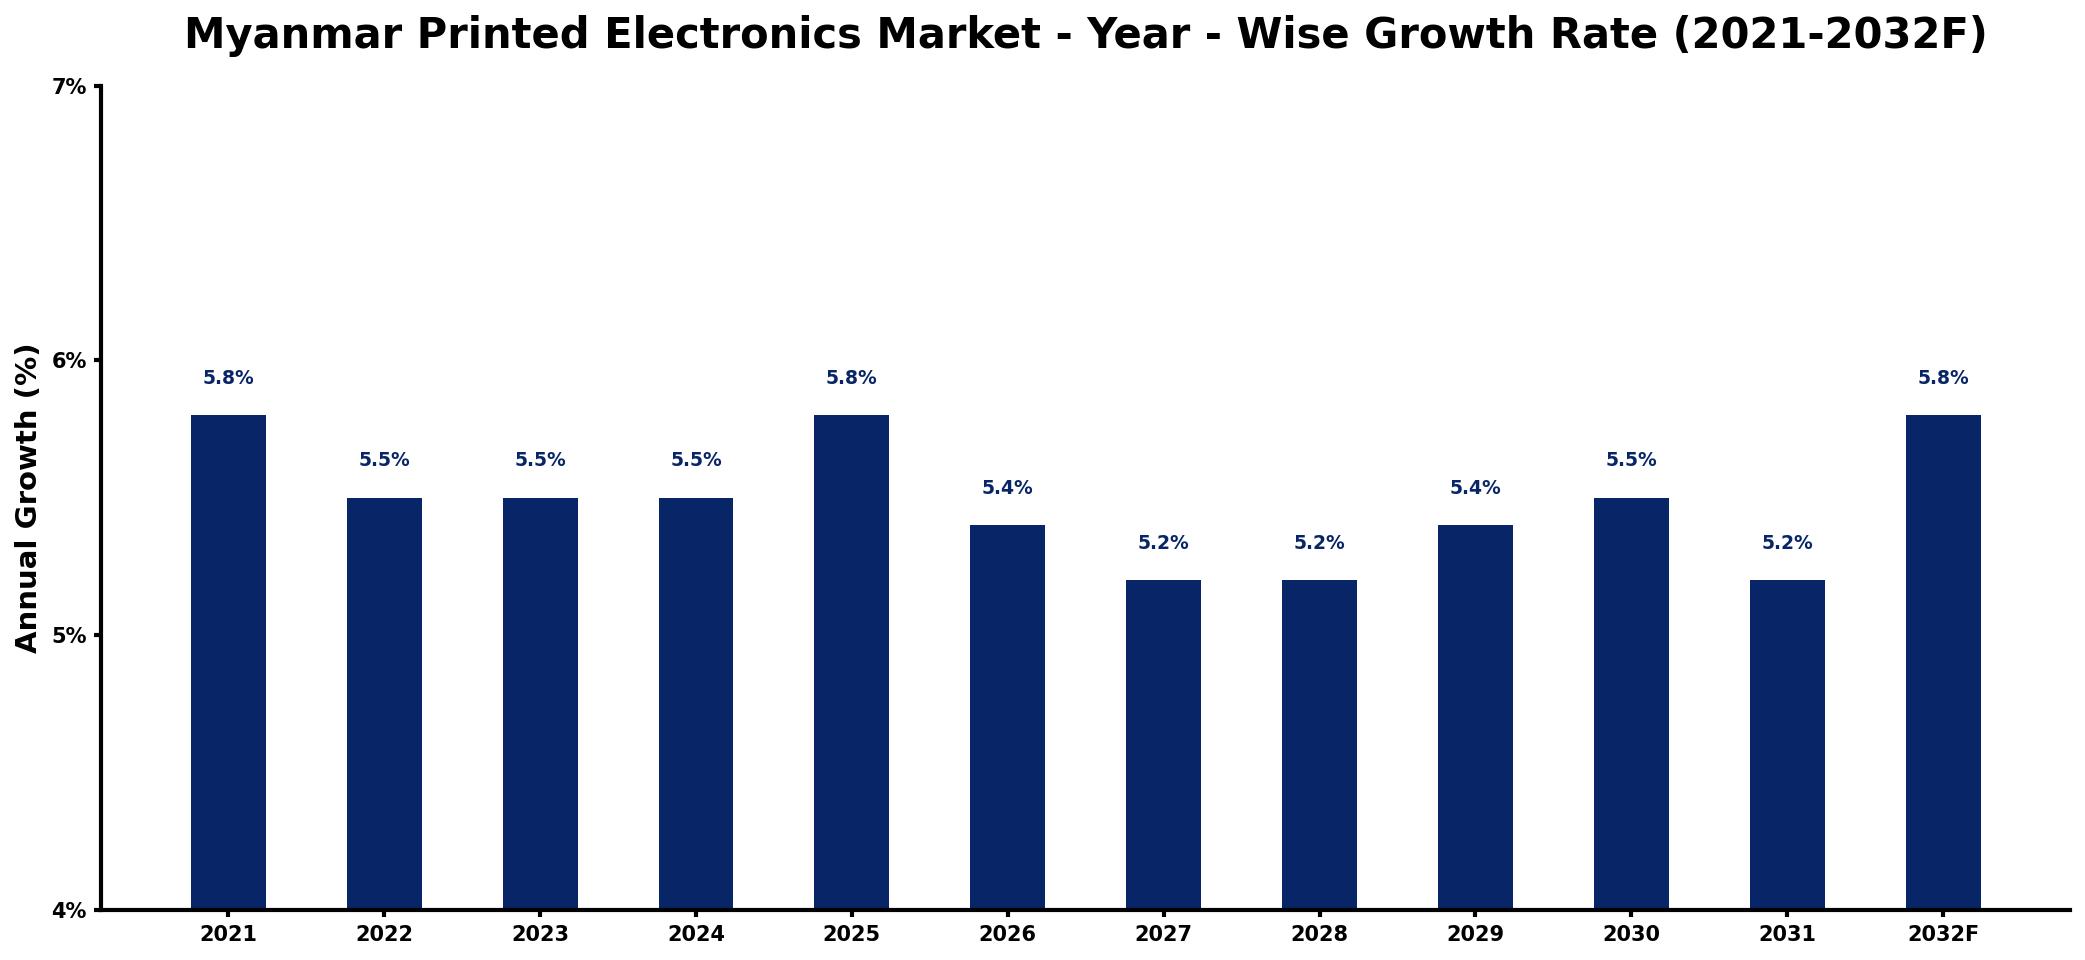
The table below presents the year‑wise growth rates along with the key drivers influencing the market
| Year | Growth Rate | Major Drivers |
| 2021 | 5.8% | Rising demand for smart packaging |
| 2022 | 5.5% | Growth in wearable technology sector |
| 2023 | 5.5% | Expansion of renewable energy applications |
| 2024 | 5.5% | Increase in automotive innovations |
| 2025 | 5.8% | Surge in IoT device integration |
| 2026 | 5.4% | Advancements in healthcare monitoring |
| 2027 | 5.2% | Emergence of sustainable solutions |
| 2028 | 5.2% | growing automotive sector requirements |
| 2029 | 5.4% | growing commercial sector adoption |
| 2030 | 5.5% | Rise in smart home devices |
| 2031 | 5.2% | increased pharmaceutical industry usage |
| 2032 | 5.8% | Increased investment in R&D |
Note: Market size estimations and growth projections presented in this report are based on 6Wresearch's proprietary forecasting methodology, utilizing the latest available industry data, government publications, and primary research inputs.
Myanmar Printed Electronics Market Synopsis
The demand for printed electronics in Myanmar is gaining traction, especially as local manufacturers explore advanced materials and technologies to enhance product offerings. This interest is particularly pronounced in sectors such as automotive, where flexible electronic components are increasingly integrated into vehicle designs.
Furthermore, the emergence of smart technologies and IoT solutions is shaping the landscape for printed electronics. As industries adopt these technologies, the need for compact, lightweight electronic devices becomes critical, leading to a more robust market for printed electronics in Myanmar.
Myanmar Printed Electronics Market Key Takeaways
- The printed electronics market in Myanmar is characterized by innovative applications across various industries.
- Technological advancements are crucial in addressing the demand for lightweight and flexible electronic solutions.
- Growing investment in the automotive and consumer electronics sectors is driving market growth.
- Government initiatives aim to bolster research and development in the printed electronics domain.
- Despite challenges, the market's potential for expansion remains significant due to increasing adoption of smart technologies.
Evaluation of Restraints in Myanmar Printed Electronics Market
The growth of the printed electronics market in Myanmar is hindered by several key restraints. Primarily, the low level of technological adoption among manufacturers limits the market's ability to innovate and scale effectively. Additionally, high production costs and a notable lack of skilled labor create significant barriers for potential entrants and existing players. Limited awareness among consumers and businesses about the benefits of printed electronics further restricts market expansion. Moreover, the relatively small size of the domestic market does not attract substantial investment, creating a cycle of stagnation in growth potential.
Myanmar Printed Electronics Market Trends
Several trends are shaping the Myanmar Printed Electronics Market. The rise of the Internet of Things (IoT) is fostering demand for printed sensors and smart wearables, pushing manufacturers to innovate continuously. Additionally, advancements in eco-friendly printing materials are gaining traction as sustainability becomes a vital consideration for businesses and consumers alike. The integration of printed electronics into traditional products is another emerging trend, enhancing functionality while maintaining cost-effectiveness.
Myanmar Printed Electronics Market Opportunities
The Myanmar Printed Electronics Market presents numerous growth opportunities, particularly in the realms of automotive applications and consumer electronics. As the automotive sector increasingly seeks lightweight and flexible components, manufacturers can leverage printed electronics for innovative design solutions. Additionally, the rising popularity of wearable technology offers a fertile ground for expanding product lines. Collaborative ventures with research institutions can also facilitate advancements in technology and broaden market reach.
Government Initiatives in the Myanmar Printed Electronics Market
The Myanmar government is actively promoting the printed electronics market through various initiatives aimed at enhancing technological innovation and manufacturing competitiveness. Programs include research grants for development projects in printed electronics, financial incentives for manufacturers adopting advanced printing technologies, and establishing regulatory frameworks that ensure product safety and quality standards. Such efforts are designed to stimulate investment and foster a conducive environment for the growth of the printed electronics sector.
Future Insights of the Myanmar Printed Electronics Market
Looking ahead to the period from 2026 to 2032, the Myanmar Printed Electronics Market is poised for substantial growth driven by technological advancements and increasing demand across various sectors. As manufacturers refine production processes and innovate product offerings, the market is likely to attract further investment. The ongoing integration of smart technologies will necessitate greater reliance on printed electronics, positioning the market favorably for robust expansion in the coming years.
Myanmar Printed Electronics Market Latest Developments (2025 - 2026)
Recent developments in the Myanmar printed electronics market have shown an uptick in local collaboration aimed at enhancing R&D capabilities. As companies strive to adopt more sophisticated printing technologies, partnerships between academic institutions and private sector firms are becoming increasingly common. Furthermore, there is a noticeable push towards creating awareness about printed electronics and their diverse applications, fostering greater market acceptance among consumers and businesses.
Myanmar Printed Electronics Market - Key Attractiveness of the Report
- 10 Years of Market Numbers
- Historical Data Starting from 2022 to 2025
- Base Year: 2025
- Forecast Data until 2032
- Key Performance Indicators Impacting the Market
- Major Upcoming Developments and Projects
Key Highlights of the Report:
- Myanmar Printed Electronics Market Outlook
- Market Size of Myanmar Printed Electronics Market, 2025
- Forecast of Myanmar Printed Electronics Market, 2032
- Historical Data and Forecast of Myanmar Printed Electronics Revenues & Volume for the Period 2022-2032F
- Myanmar Printed Electronics Market Trend Evolution
- Myanmar Printed Electronics Market Drivers and Challenges
- Myanmar Printed Electronics Price Trends
- Myanmar Printed Electronics Porter's Five Forces
- Myanmar Printed Electronics Industry Life Cycle
- Historical Data and Forecast of Myanmar Printed Electronics Market Revenues & Volume By Material for the Period 2022-2032F
- Historical Data and Forecast of Myanmar Printed Electronics Market Revenues & Volume By Ink for the Period 2022-2032F
- Historical Data and Forecast of Myanmar Printed Electronics Market Revenues & Volume By Substrate for the Period 2022-2032F
- Historical Data and Forecast of Myanmar Printed Electronics Market Revenues & Volume By Technology for the Period 2022-2032F
- Historical Data and Forecast of Myanmar Printed Electronics Market Revenues & Volume By Screen for the Period 2022-2032F
- Historical Data and Forecast of Myanmar Printed Electronics Market Revenues & Volume By Inkjet for the Period 2022-2032F
- Historical Data and Forecast of Myanmar Printed Electronics Market Revenues & Volume By Flexographic for the Period 2022-2032F
- Historical Data and Forecast of Myanmar Printed Electronics Market Revenues & Volume By Gravure for the Period 2022-2032F
- Historical Data and Forecast of Myanmar Printed Electronics Market Revenues & Volume By Device for the Period 2022-2032F
- Historical Data and Forecast of Myanmar Printed Electronics Market Revenues & Volume By Displays for the Period 2022-2032F
- Historical Data and Forecast of Myanmar Printed Electronics Market Revenues & Volume By Photovoltaic for the Period 2022-2032F
- Historical Data and Forecast of Myanmar Printed Electronics Market Revenues & Volume By Lighting for the Period 2022-2032F
- Historical Data and Forecast of Myanmar Printed Electronics Market Revenues & Volume By RFID for the Period 2022-2032F
- Historical Data and Forecast of Myanmar Printed Electronics Market Revenues & Volume By Others for the Period 2022-2032F
- Myanmar Printed Electronics Import Export Trade Statistics
- Market Opportunity Assessment By Material
- Market Opportunity Assessment By Technology
- Market Opportunity Assessment By Device
- Myanmar Printed Electronics Top Companies Market Share
- Myanmar Printed Electronics Competitive Benchmarking By Technical and Operational Parameters
- Myanmar Printed Electronics Company Profiles
- Myanmar Printed Electronics Key Strategic Recommendations
Frequently Asked Questions About the Market Study (FAQs):
The Myanmar Printed Electronics Market was estimated at USD 283 Million in 2025 and is projected to reach USD 389 Million by 2032, growing at a CAGR of 4.6% from 2026 to 2032.
The automotive and consumer electronics industries are key drivers, as they increasingly seek lightweight, flexible, and cost-effective components for their products.
Key challenges include low technological adoption, high production costs, and a shortage of skilled labor, all of which hinder market growth and innovation.
The government supports the sector through research grants, incentives for adopting printing technologies, and regulations ensuring safety and quality, aiming to enhance competitiveness.
Current trends include the increasing integration of IoT technologies, advancements in eco-friendly printing materials, and a focus on innovative product development for wearables and automotive applications.
6Wresearch actively monitors the Myanmar Printed Electronics Market and publishes its comprehensive annual report, highlighting emerging trends, growth drivers, revenue analysis, and forecast outlook. Our insights help businesses to make data-backed strategic decisions with ongoing market dynamics. Our analysts track relevent industries related to the Myanmar Printed Electronics Market, allowing our clients with actionable intelligence and reliable forecasts tailored to emerging regional needs.
Yes, we provide customisation as per your requirements. To learn more, feel free to contact us on sales@6wresearch.com
1 Executive Summary |
2 Introduction |
2.1 Key Highlights of the Report |
2.2 Report Description |
2.3 Market Scope & Segmentation |
2.4 Research Methodology |
2.5 Assumptions |
3 Myanmar Printed Electronics Market Overview |
3.1 Myanmar Country Macro Economic Indicators |
3.2 Myanmar Printed Electronics Market Revenues & Volume, 2022 & 2032F |
3.3 Myanmar Printed Electronics Market - Industry Life Cycle |
3.4 Myanmar Printed Electronics Market - Porter's Five Forces |
3.5 Myanmar Printed Electronics Market Revenues & Volume Share, By Material, 2022 & 2032F |
3.6 Myanmar Printed Electronics Market Revenues & Volume Share, By Technology, 2022 & 2032F |
3.7 Myanmar Printed Electronics Market Revenues & Volume Share, By Device, 2022 & 2032F |
4 Myanmar Printed Electronics Market Dynamics |
4.1 Impact Analysis |
4.2 Market Drivers |
4.2.1 Increasing demand for flexible and lightweight electronics |
4.2.2 Growing investments in research and development in printed electronics technology |
4.2.3 Government initiatives to promote the adoption of printed electronics in Myanmar |
4.3 Market Restraints |
4.3.1 Lack of awareness and understanding about printed electronics among consumers |
4.3.2 High initial costs associated with setting up printed electronics manufacturing facilities in Myanmar |
5 Myanmar Printed Electronics Market Trends |
6 Myanmar Printed Electronics Market, By Types |
6.1 Myanmar Printed Electronics Market, By Material |
6.1.1 Overview and Analysis |
6.1.2 Myanmar Printed Electronics Market Revenues & Volume, By Material, 2022-2032F |
6.1.3 Myanmar Printed Electronics Market Revenues & Volume, By Ink, 2022-2032F |
6.1.4 Myanmar Printed Electronics Market Revenues & Volume, By Substrate, 2022-2032F |
6.2 Myanmar Printed Electronics Market, By Technology |
6.2.1 Overview and Analysis |
6.2.2 Myanmar Printed Electronics Market Revenues & Volume, By Screen, 2022-2032F |
6.2.3 Myanmar Printed Electronics Market Revenues & Volume, By Inkjet, 2022-2032F |
6.2.4 Myanmar Printed Electronics Market Revenues & Volume, By Flexographic, 2022-2032F |
6.2.5 Myanmar Printed Electronics Market Revenues & Volume, By Gravure, 2022-2032F |
6.3 Myanmar Printed Electronics Market, By Device |
6.3.1 Overview and Analysis |
6.3.2 Myanmar Printed Electronics Market Revenues & Volume, By Displays, 2022-2032F |
6.3.3 Myanmar Printed Electronics Market Revenues & Volume, By Photovoltaic, 2022-2032F |
6.3.4 Myanmar Printed Electronics Market Revenues & Volume, By Lighting, 2022-2032F |
6.3.5 Myanmar Printed Electronics Market Revenues & Volume, By RFID, 2022-2032F |
6.3.6 Myanmar Printed Electronics Market Revenues & Volume, By Others, 2022-2032F |
7 Myanmar Printed Electronics Market Import-Export Trade Statistics |
7.1 Myanmar Printed Electronics Market Export to Major Countries |
7.2 Myanmar Printed Electronics Market Imports from Major Countries |
8 Myanmar Printed Electronics Market Key Performance Indicators |
8.1 Percentage increase in the number of partnerships and collaborations between local companies and international players in the printed electronics industry in Myanmar |
8.2 Number of patents filed for printed electronics technologies in Myanmar |
8.3 Percentage growth in the adoption of printed electronics in key industries such as healthcare, automotive, and consumer electronics in Myanmar |
9 Myanmar Printed Electronics Market - Opportunity Assessment |
9.1 Myanmar Printed Electronics Market Opportunity Assessment, By Material, 2022 & 2032F |
9.2 Myanmar Printed Electronics Market Opportunity Assessment, By Technology, 2022 & 2032F |
9.3 Myanmar Printed Electronics Market Opportunity Assessment, By Device, 2022 & 2032F |
10 Myanmar Printed Electronics Market - Competitive Landscape |
10.1 Myanmar Printed Electronics Market Revenue Share, By Companies, 2025 |
10.2 Myanmar Printed Electronics Market Competitive Benchmarking, By Operating and Technical Parameters |
11 Company Profiles |
12 Recommendations |
13 Disclaimer |
Global Go To Market Strategy - 2030
Export potential enables firms to identify high-growth global markets with greater confidence by combining advanced trade intelligence with a structured quantitative methodology. The framework analyzes emerging demand trends and country-level import patterns while integrating macroeconomic and trade datasets such as GDP and population forecasts, bilateral import–export flows, tariff structures, elasticity differentials between developed and developing economies, geographic distance, and import demand projections. Using weighted trade values from 2020–2024 as the base period to project country-to-country export potential for 2030, these inputs are operationalized through calculated drivers such as gravity model parameters, tariff impact factors, and projected GDP per-capita growth. Through an analysis of hidden potentials, demand hotspots, and market conditions that are most favorable to success, this method enables firms to focus on target countries, maximize returns, and global expansion with data, backed by accuracy.
By factoring in the projected importer demand gap that is currently unmet and could be potential opportunity, it identifies the potential for the Exporter (Country) among 190 countries, against the general trade analysis, which identifies the biggest importer or exporter.
To discover high-growth global markets and optimize your business strategy:
Click Here
Pricing
- Single User License$ 1,995
- Department License$ 2,400
- Site License$ 3,120
- Global License$ 3,795

Leadership Perspectives from Industry Events
Search
Thought Leadership and Analyst Meet


Our Clients
6WResearch In News
- India Air Conditioner Market Set for Strong Rebound in 2026 After Weather-Led Correction and GST-Driven Recovery: 6Wresearch
- ADAS in India: How Automatic Emergency Braking, Blind Spot Detection & Driver Monitoring are Transforming Road Safety
- Doha a strategic location for EV manufacturing hub: IPA Qatar
- Demand for luxury TVs surging in the GCC, says Samsung
- Empowering Growth: The Thriving Journey of Bangladesh’s Cable Industry
- Demand for luxury TVs surging in the GCC, says Samsung
Latest Reports
- Nicaragua RPG Gaming Market (2026-2032)
- New Zealand RPG Gaming Market (2026-2032)
- Netherlands RPG Gaming Market (2026-2032)
- Nauru RPG Gaming Market (2026-2032)
- Namibia RPG Gaming Market (2026-2032)
- Mozambique RPG Gaming Market (2026-2032)
- Montenegro RPG Gaming Market (2026-2032)
- Mongolia RPG Gaming Market (2026-2032)
- Monaco RPG Gaming Market (2026-2032)
- Micronesia RPG Gaming Market (2026-2032)
Industry Events and Analyst Meet

EV India Expo 2026

HIMTEX 2026

India Refining Summit 2026

India EV Show 2026

EV tech India Expo 2026
Whitepaper
- Middle East & Africa Commercial Security Market Click here to view more.
- Middle East & Africa Fire Safety Systems & Equipment Market Click here to view more.
- GCC Drone Market Click here to view more.
- Middle East Lighting Fixture Market Click here to view more.
- GCC Physical & Perimeter Security Market Click here to view more.