Netherlands Artificial Flowers Market (2025-2031) | Revenue, Value, Share, Segmentation, Growth, Companies, Size, Analysis, Outlook, Forecast, Industry & Trends
Market Forecast By Material Type (Clay & Porcelain, Cotton & Silk, Leather & Nylon, Paper & Wax, Plastic & Polyester), By Application (Commercial, Residential) And Competitive Landscape
| Product Code: ETC4982656 | Publication Date: Nov 2023 | Updated Date: Apr 2026 | Product Type: Market Research Report | |
| Publisher: 6Wresearch | Author: Shubham Padhi | No. of Pages: 60 | No. of Figures: 30 | No. of Tables: 5 |
Netherlands Artificial Flowers Market Size (2020-2030)
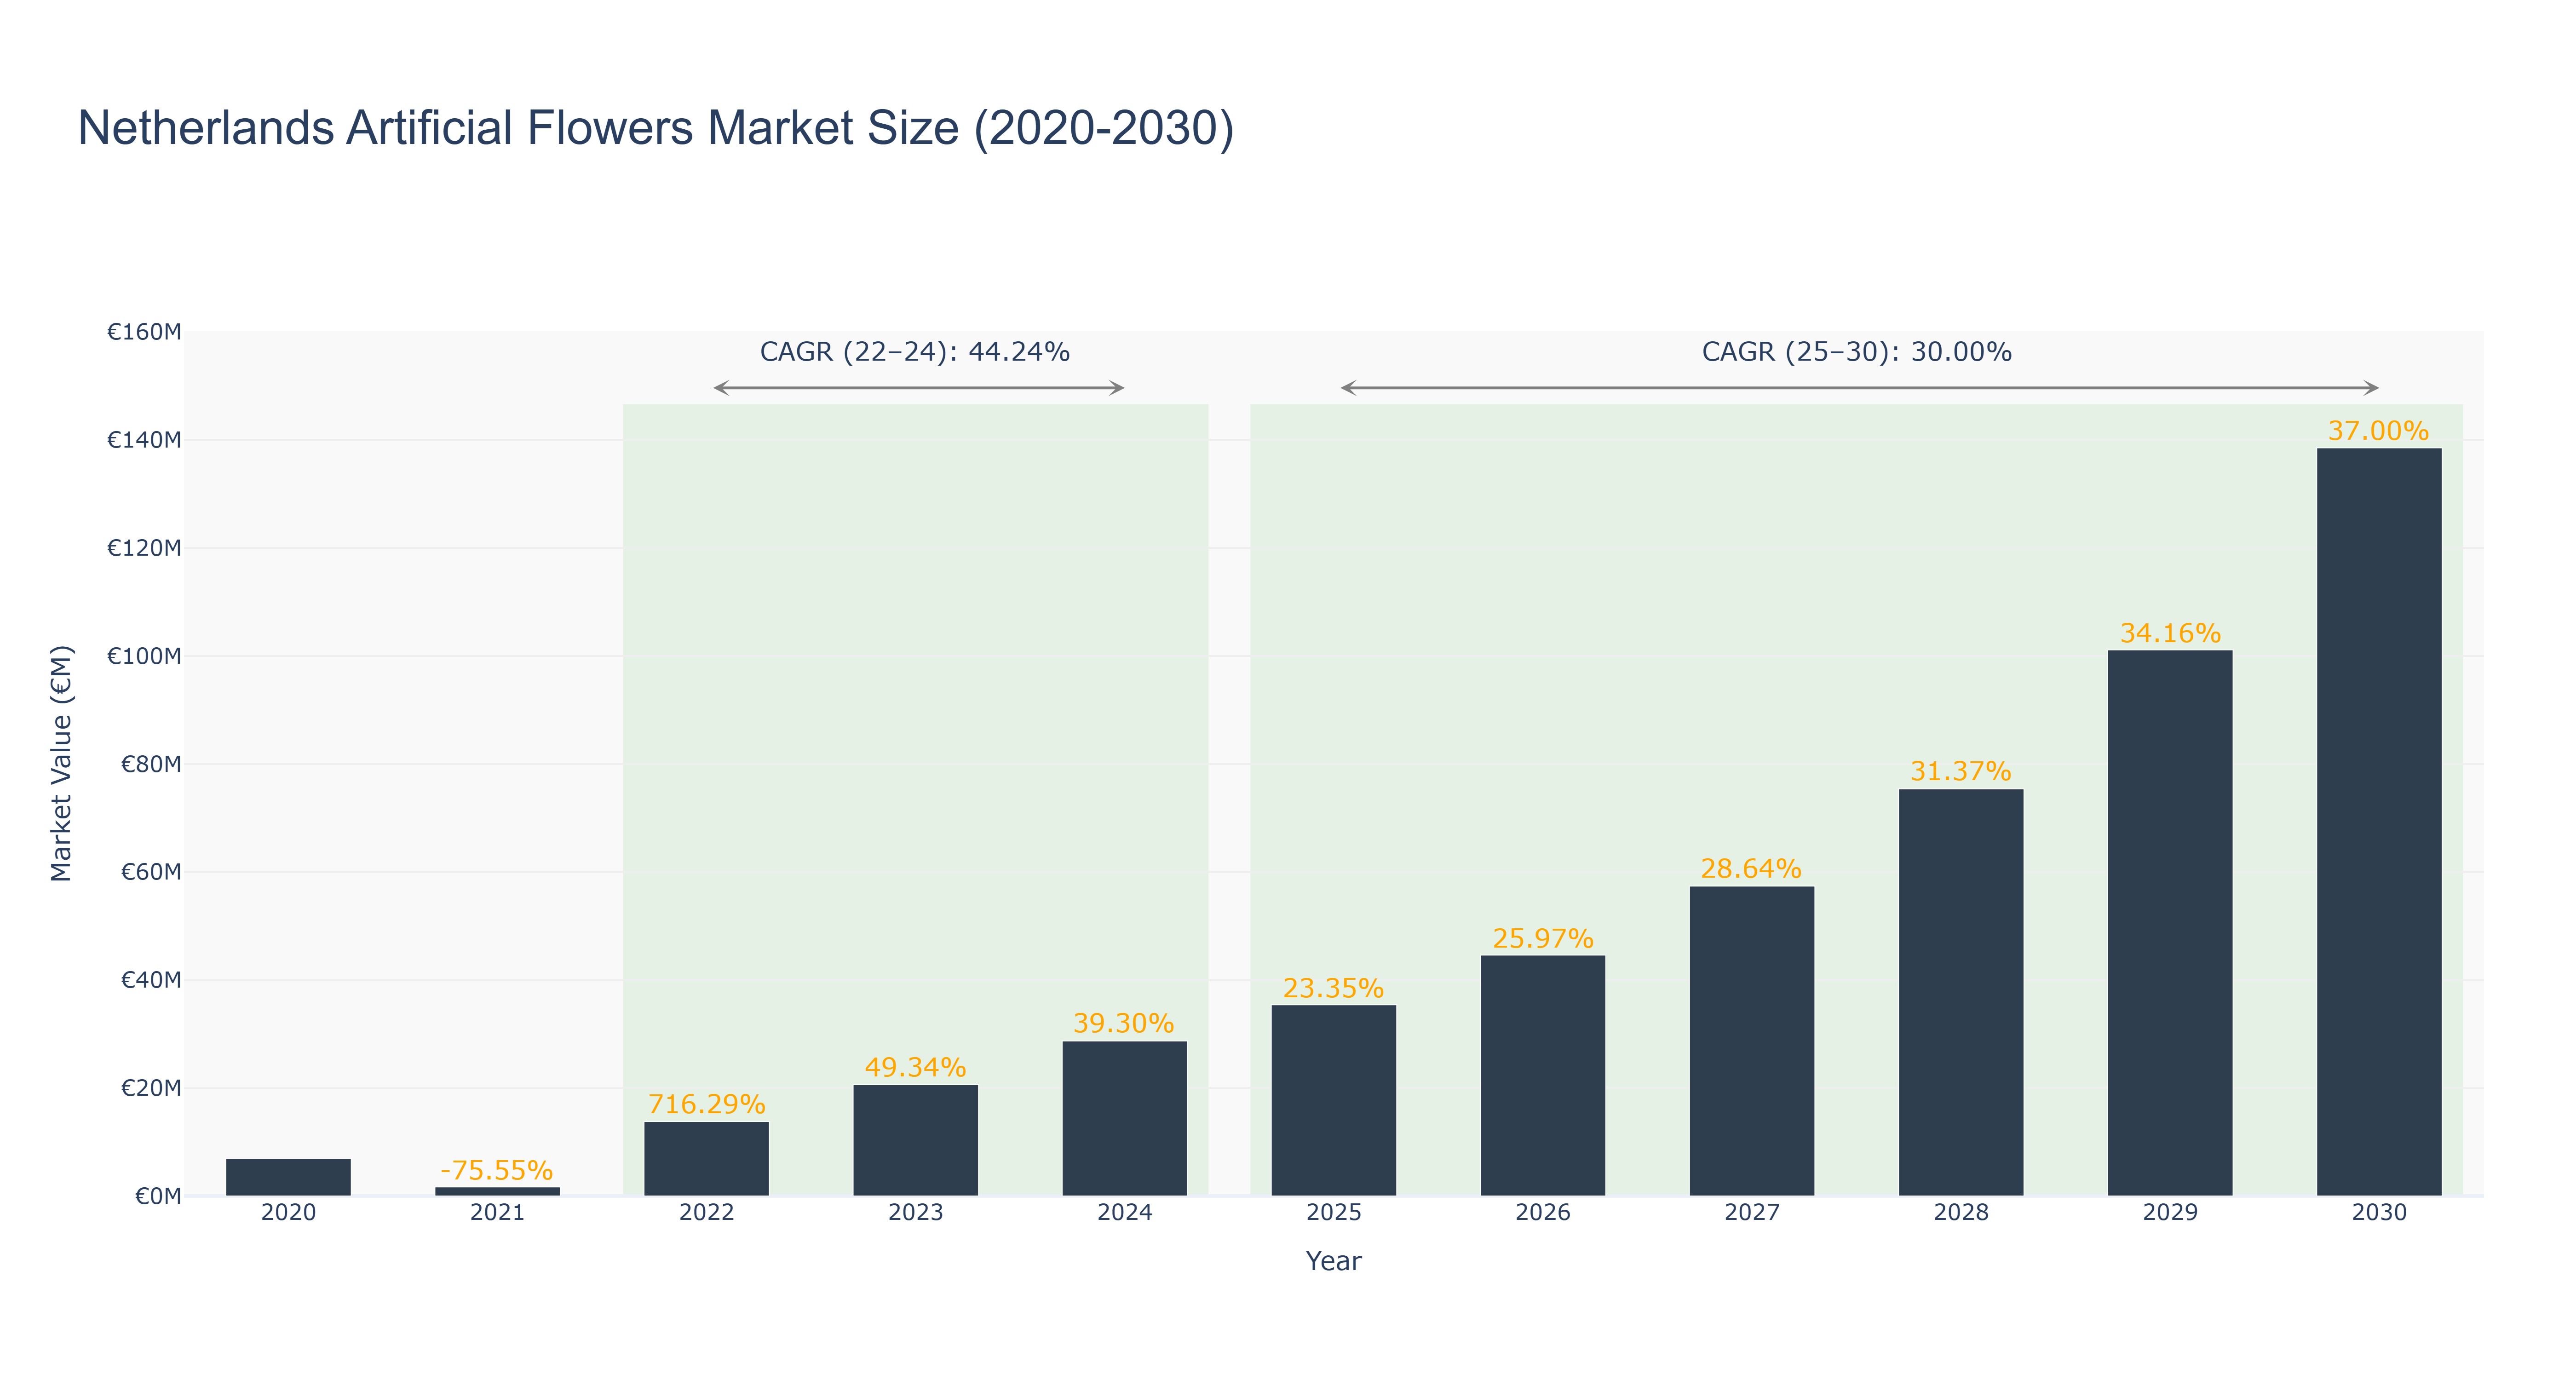
Netherlands Artificial Flowers Market has shown a significant growth trajectory. The market size peaked at €138.55 million in 2030, with a notable increase in size observed from 2020 (€6.91 million) to 2024 (€28.70 million). The forecasted market size from 2025 to 2030 is expected to continue this upward trend, driven by a CAGR of 30.0% between 2025-30. The CAGR for the period 2022-24 was 44.24%, indicating a rapid growth phase. This growth can be attributed to increasing consumer preference for artificial flowers due to their durability and low maintenance requirements, along with a growing trend towards sustainable and eco-friendly products in the floral industry. Looking ahead, the market is poised for further expansion with upcoming collaborations between local artisans and international designers to introduce innovative and unique artificial flower designs, catering to evolving consumer preferences.
Netherlands Artificial Flowers Market: Production & Trade Performance (2019-2025)
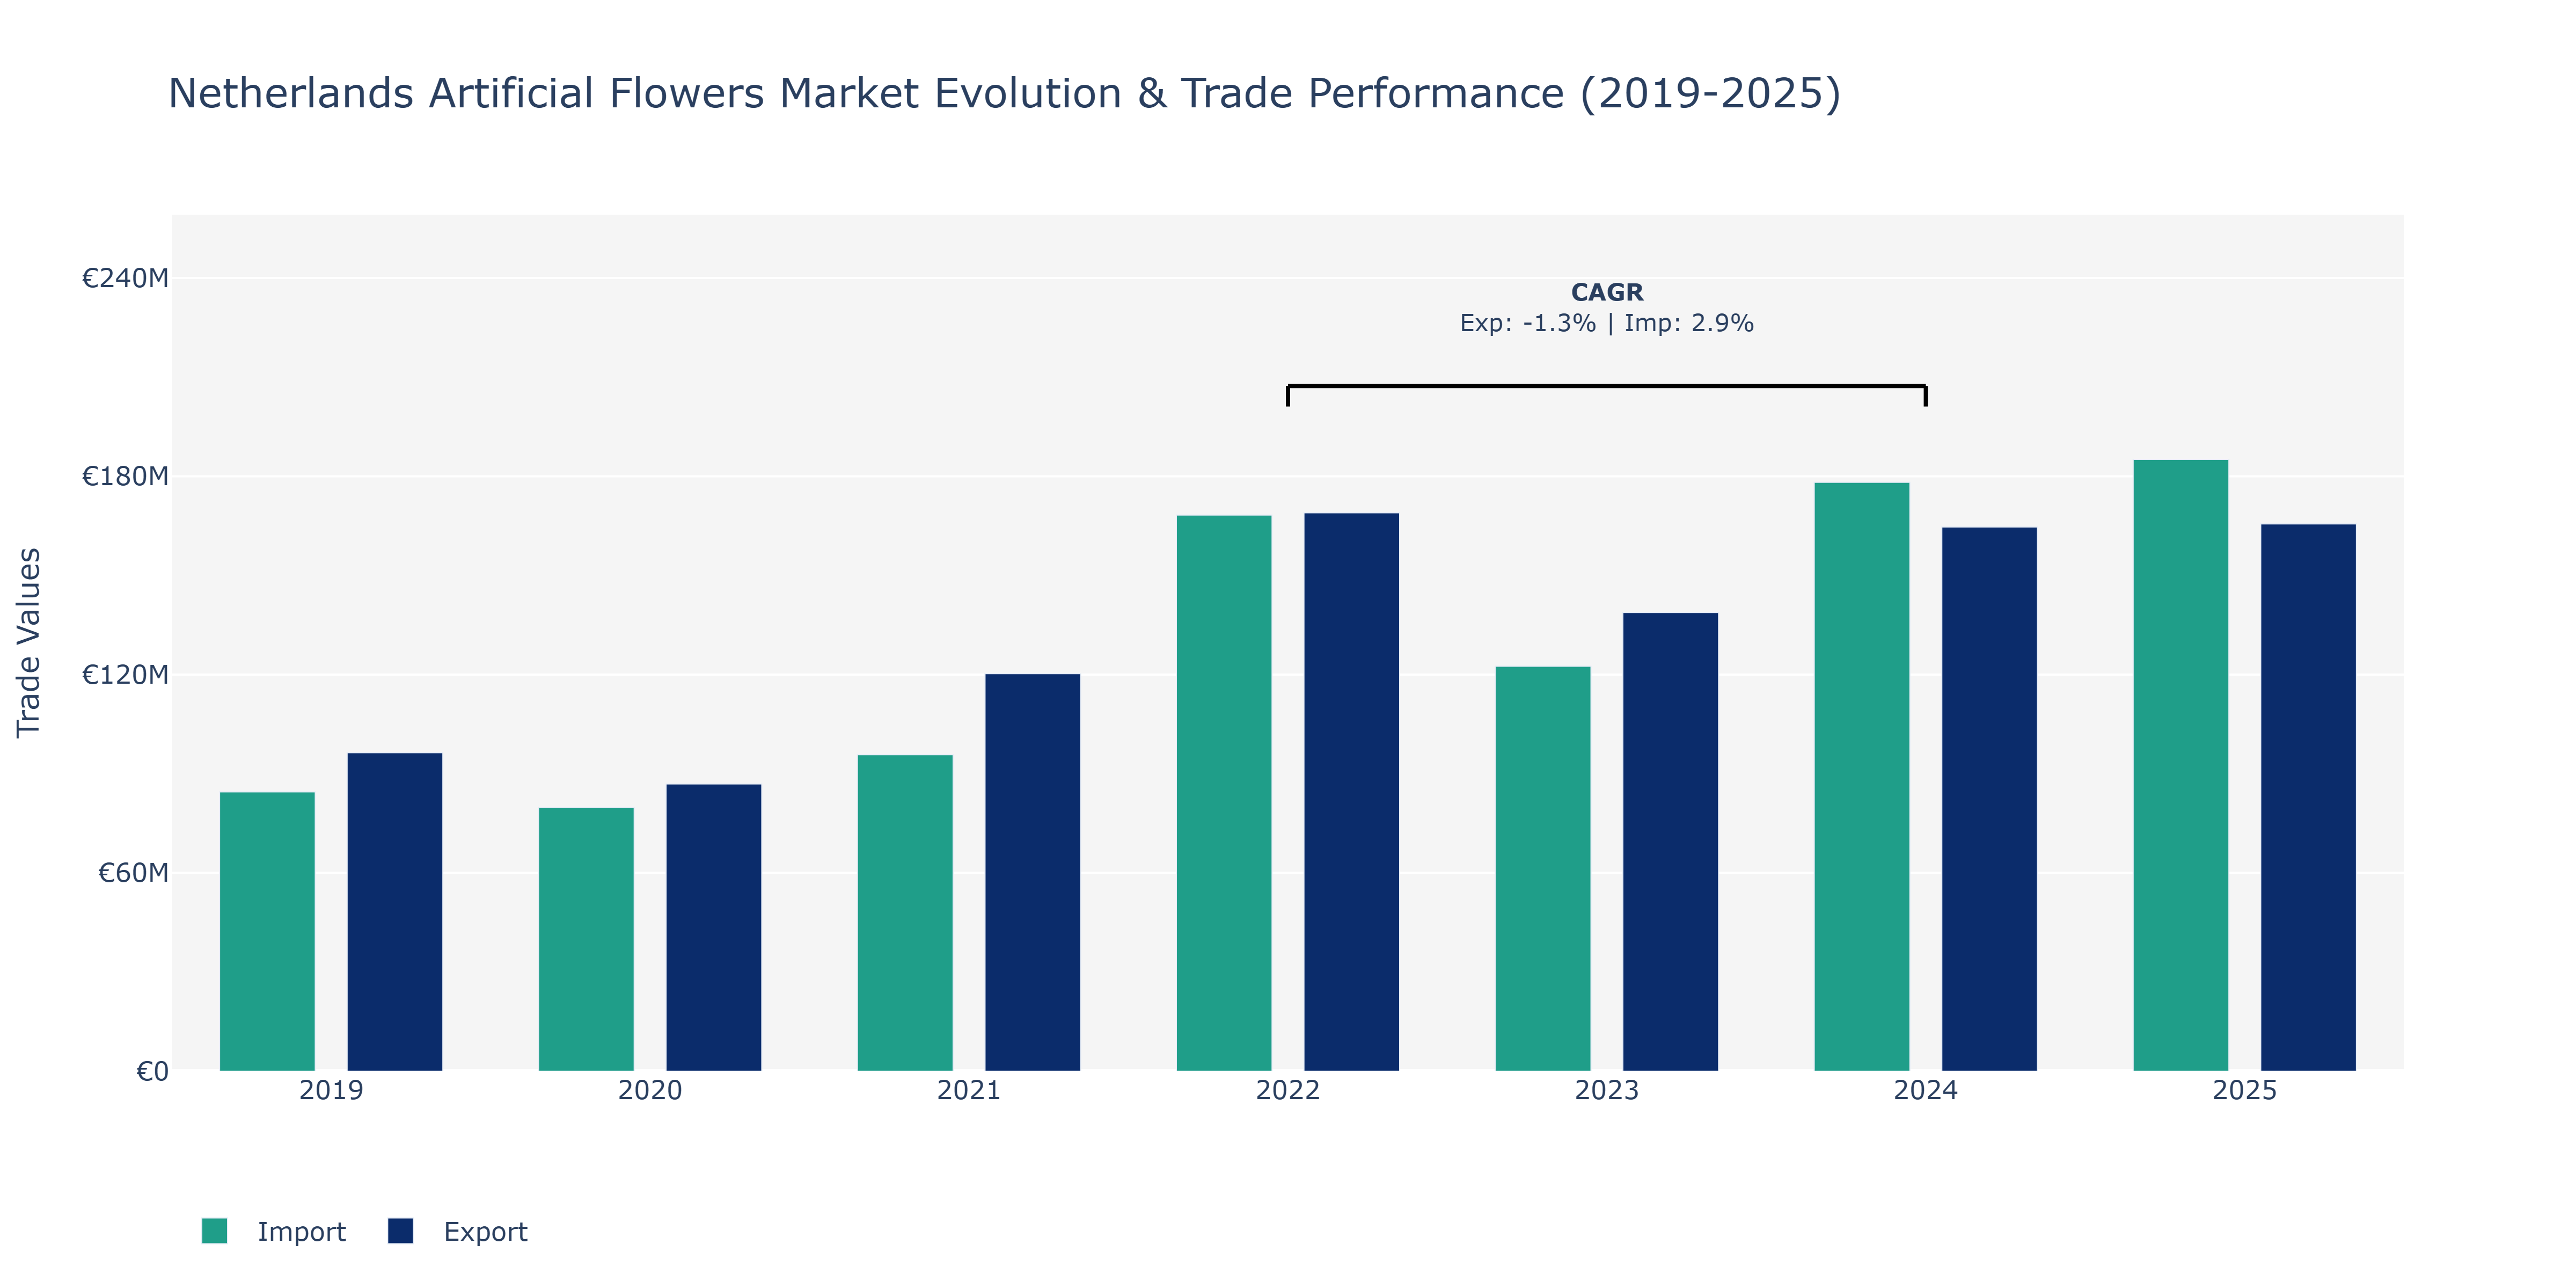
The Netherlands Artificial Flowers Market witnessed fluctuating trends in both Exports and Imports over the specified years. From 2019 to 2020, Exports decreased from €96.36 million to €86.91 million, while Imports declined from €84.53 million to €79.72 million. In 2021, there was a notable surge in Exports to €120.28 million and Imports to €95.76 million, indicating increased demand or production capacity. The peak points were reached in 2025 with Exports at €165.56 million and Imports at €185.10 million. The growth in Imports outpacing Exports suggests a shift in market dynamics, potentially due to changes in consumer preferences or manufacturing capabilities. Factors such as technological advancements in artificial flower production, evolving design trends, and increasing environmental awareness influencing consumer choices may have contributed to these market fluctuations, aligning with the global trend towards sustainable and aesthetically pleasing artificial floral products.
Key Highlights of the Report:
- Netherlands Artificial Flowers Market Outlook
- Market Size of Netherlands Artificial Flowers Market, 2024
- Forecast of Netherlands Artificial Flowers Market, 2031
- Historical Data and Forecast of Netherlands Artificial Flowers Revenues & Volume for the Period 2021-2031
- Netherlands Artificial Flowers Market Trend Evolution
- Netherlands Artificial Flowers Market Drivers and Challenges
- Netherlands Artificial Flowers Price Trends
- Netherlands Artificial Flowers Porter`s Five Forces
- Netherlands Artificial Flowers Industry Life Cycle
- Historical Data and Forecast of Netherlands Artificial Flowers Market Revenues & Volume By Material Type for the Period 2021-2031
- Historical Data and Forecast of Netherlands Artificial Flowers Market Revenues & Volume By Clay & Porcelain for the Period 2021-2031
- Historical Data and Forecast of Netherlands Artificial Flowers Market Revenues & Volume By Cotton & Silk for the Period 2021-2031
- Historical Data and Forecast of Netherlands Artificial Flowers Market Revenues & Volume By Leather & Nylon for the Period 2021-2031
- Historical Data and Forecast of Netherlands Artificial Flowers Market Revenues & Volume By Paper & Wax for the Period 2021-2031
- Historical Data and Forecast of Netherlands Artificial Flowers Market Revenues & Volume By Plastic & Polyester for the Period 2021-2031
- Historical Data and Forecast of Netherlands Artificial Flowers Market Revenues & Volume By Application for the Period 2021-2031
- Historical Data and Forecast of Netherlands Artificial Flowers Market Revenues & Volume By Commercial for the Period 2021-2031
- Historical Data and Forecast of Netherlands Artificial Flowers Market Revenues & Volume By Residential for the Period 2021-2031
- Netherlands Artificial Flowers Import Export Trade Statistics
- Market Opportunity Assessment By Material Type
- Market Opportunity Assessment By Application
- Netherlands Artificial Flowers Top Companies Market Share
- Netherlands Artificial Flowers Competitive Benchmarking By Technical and Operational Parameters
- Netherlands Artificial Flowers Company Profiles
- Netherlands Artificial Flowers Key Strategic Recommendations
Frequently Asked Questions About the Market Study (FAQs):
6Wresearch actively monitors the Netherlands Artificial Flowers Market and publishes its comprehensive annual report, highlighting emerging trends, growth drivers, revenue analysis, and forecast outlook. Our insights help businesses to make data-backed strategic decisions with ongoing market dynamics. Our analysts track relevent industries related to the Netherlands Artificial Flowers Market, allowing our clients with actionable intelligence and reliable forecasts tailored to emerging regional needs.
Yes, we provide customisation as per your requirements. To learn more, feel free to contact us on sales@6wresearch.com
1 Executive Summary |
2 Introduction |
2.1 Key Highlights of the Report |
2.2 Report Description |
2.3 Market Scope & Segmentation |
2.4 Research Methodology |
2.5 Assumptions |
3 Netherlands Artificial Flowers Market Overview |
3.1 Netherlands Country Macro Economic Indicators |
3.2 Netherlands Artificial Flowers Market Revenues & Volume, 2021 & 2031F |
3.3 Netherlands Artificial Flowers Market - Industry Life Cycle |
3.4 Netherlands Artificial Flowers Market - Porter's Five Forces |
3.5 Netherlands Artificial Flowers Market Revenues & Volume Share, By Material Type, 2021 & 2031F |
3.6 Netherlands Artificial Flowers Market Revenues & Volume Share, By Application, 2021 & 2031F |
4 Netherlands Artificial Flowers Market Dynamics |
4.1 Impact Analysis |
4.2 Market Drivers |
4.2.1 Increasing popularity of artificial flowers as a sustainable and low-maintenance option for decorations. |
4.2.2 Growing demand from the hospitality sector, such as hotels and restaurants, for long-lasting floral arrangements. |
4.2.3 Rising consumer inclination towards artificial flowers due to allergies associated with real flowers. |
4.3 Market Restraints |
4.3.1 Perception of artificial flowers being less environmentally friendly compared to real flowers. |
4.3.2 Competition from fresh flower market impacting the growth of artificial flowers market in the Netherlands. |
5 Netherlands Artificial Flowers Market Trends |
6 Netherlands Artificial Flowers Market Segmentations |
6.1 Netherlands Artificial Flowers Market, By Material Type |
6.1.1 Overview and Analysis |
6.1.2 Netherlands Artificial Flowers Market Revenues & Volume, By Clay & Porcelain, 2021-2031F |
6.1.3 Netherlands Artificial Flowers Market Revenues & Volume, By Cotton & Silk, 2021-2031F |
6.1.4 Netherlands Artificial Flowers Market Revenues & Volume, By Leather & Nylon, 2021-2031F |
6.1.5 Netherlands Artificial Flowers Market Revenues & Volume, By Paper & Wax, 2021-2031F |
6.1.6 Netherlands Artificial Flowers Market Revenues & Volume, By Plastic & Polyester, 2021-2031F |
6.2 Netherlands Artificial Flowers Market, By Application |
6.2.1 Overview and Analysis |
6.2.2 Netherlands Artificial Flowers Market Revenues & Volume, By Commercial, 2021-2031F |
6.2.3 Netherlands Artificial Flowers Market Revenues & Volume, By Residential, 2021-2031F |
7 Netherlands Artificial Flowers Market Import-Export Trade Statistics |
7.1 Netherlands Artificial Flowers Market Export to Major Countries |
7.2 Netherlands Artificial Flowers Market Imports from Major Countries |
8 Netherlands Artificial Flowers Market Key Performance Indicators |
8.1 Percentage of households opting for artificial flowers over real flowers. |
8.2 Number of artificial flower manufacturers entering or expanding in the Dutch market. |
8.3 Quantity of artificial flowers imported/exported in the Netherlands. |
8.4 Adoption rate of artificial flowers in commercial spaces like offices and event venues. |
9 Netherlands Artificial Flowers Market - Opportunity Assessment |
9.1 Netherlands Artificial Flowers Market Opportunity Assessment, By Material Type, 2021 & 2031F |
9.2 Netherlands Artificial Flowers Market Opportunity Assessment, By Application, 2021 & 2031F |
10 Netherlands Artificial Flowers Market - Competitive Landscape |
10.1 Netherlands Artificial Flowers Market Revenue Share, By Companies, 2024 |
10.2 Netherlands Artificial Flowers Market Competitive Benchmarking, By Operating and Technical Parameters |
11 Company Profiles |
12 Recommendations | 13 Disclaimer |
Global Go To Market Strategy - 2030
Export potential enables firms to identify high-growth global markets with greater confidence by combining advanced trade intelligence with a structured quantitative methodology. The framework analyzes emerging demand trends and country-level import patterns while integrating macroeconomic and trade datasets such as GDP and population forecasts, bilateral import–export flows, tariff structures, elasticity differentials between developed and developing economies, geographic distance, and import demand projections. Using weighted trade values from 2020–2024 as the base period to project country-to-country export potential for 2030, these inputs are operationalized through calculated drivers such as gravity model parameters, tariff impact factors, and projected GDP per-capita growth. Through an analysis of hidden potentials, demand hotspots, and market conditions that are most favorable to success, this method enables firms to focus on target countries, maximize returns, and global expansion with data, backed by accuracy.
By factoring in the projected importer demand gap that is currently unmet and could be potential opportunity, it identifies the potential for the Exporter (Country) among 190 countries, against the general trade analysis, which identifies the biggest importer or exporter.
To discover high-growth global markets and optimize your business strategy:
Click Here
Pricing
- Single User License$ 1,995
- Department License$ 2,400
- Site License$ 3,120
- Global License$ 3,795

Leadership Perspectives from Industry Events
Search
Thought Leadership and Analyst Meet


Our Clients
6WResearch In News
- Doha a strategic location for EV manufacturing hub: IPA Qatar
- Demand for luxury TVs surging in the GCC, says Samsung
- Empowering Growth: The Thriving Journey of Bangladesh’s Cable Industry
- Demand for luxury TVs surging in the GCC, says Samsung
- Video call with a traditional healer? Once unthinkable, it’s now common in South Africa
- Intelligent Buildings To Smooth GCC’s Path To Net Zero
Latest Reports
- Taiwan Airport Wireless Infrastructure Market (2026-2032)
- Vietnam Airport Wireless Infrastructure Market (2026-2032)
- Thailand Airport Wireless Infrastructure Market (2026-2032)
- South Korea Airport Wireless Infrastructure Market (2026-2032)
- Romania Airport Wireless Infrastructure Market (2026-2032)
- Qatar Airport Wireless Infrastructure Market (2026-2032)
- Philippines Airport Wireless Infrastructure Market (2026-2032)
- Japan Airport Wireless Infrastructure Market (2026-2032)
- Taiwan Airport Winter Services Market (2026-2032)
- Vietnam Airport Winter Services Market (2026-2032)
Industry Events and Analyst Meet

HIMTEX 2026

India Refining Summit 2026

India EV Show 2026

EV tech India Expo 2026

Auto Tech Asia 2026
Whitepaper
- Middle East & Africa Commercial Security Market Click here to view more.
- Middle East & Africa Fire Safety Systems & Equipment Market Click here to view more.
- GCC Drone Market Click here to view more.
- Middle East Lighting Fixture Market Click here to view more.
- GCC Physical & Perimeter Security Market Click here to view more.