Netherlands Face Concealer Market (2026-2032) | Value, Challenges, Demand, Outlook, Competition, Consumer Insights, Strategic Insights, Segmentation, Restraints, Drivers, Opportunities, Strategy, Pricing Analysis, Revenue, Growth, Segments, Trends, Competitive, Companies, Share, Supply, Investment Trends, Size, Forecast, Analysis, Industry
Market Forecast By Product Type (Full Coverage Concealers, Light Coverage Concealers, Under-eye Concealers, Color-correcting Concealers), By Type of Coverage (High Pigment Waterproof, Lightweight Buildable, Brightening Hydrating, Green Yellow Purple), By End User (Women Makeup Enthusiasts, Teenagers Young Adults, Middle-aged Older Adults, Sensitive Skin Acne-Prone), By Application (Covering Blemishes Scars, Light Concealment Daily Use, Dark Circle Coverage Brightening, Redness Dark Spots Correction) And Competitive Landscape
| Product Code: ETC12144012 | Publication Date: Apr 2025 | Updated Date: Apr 2026 | Product Type: Market Research Report | |
| Publisher: 6Wresearch | Author: Sachin Kumar Rai | No. of Pages: 65 | No. of Figures: 34 | No. of Tables: 19 |
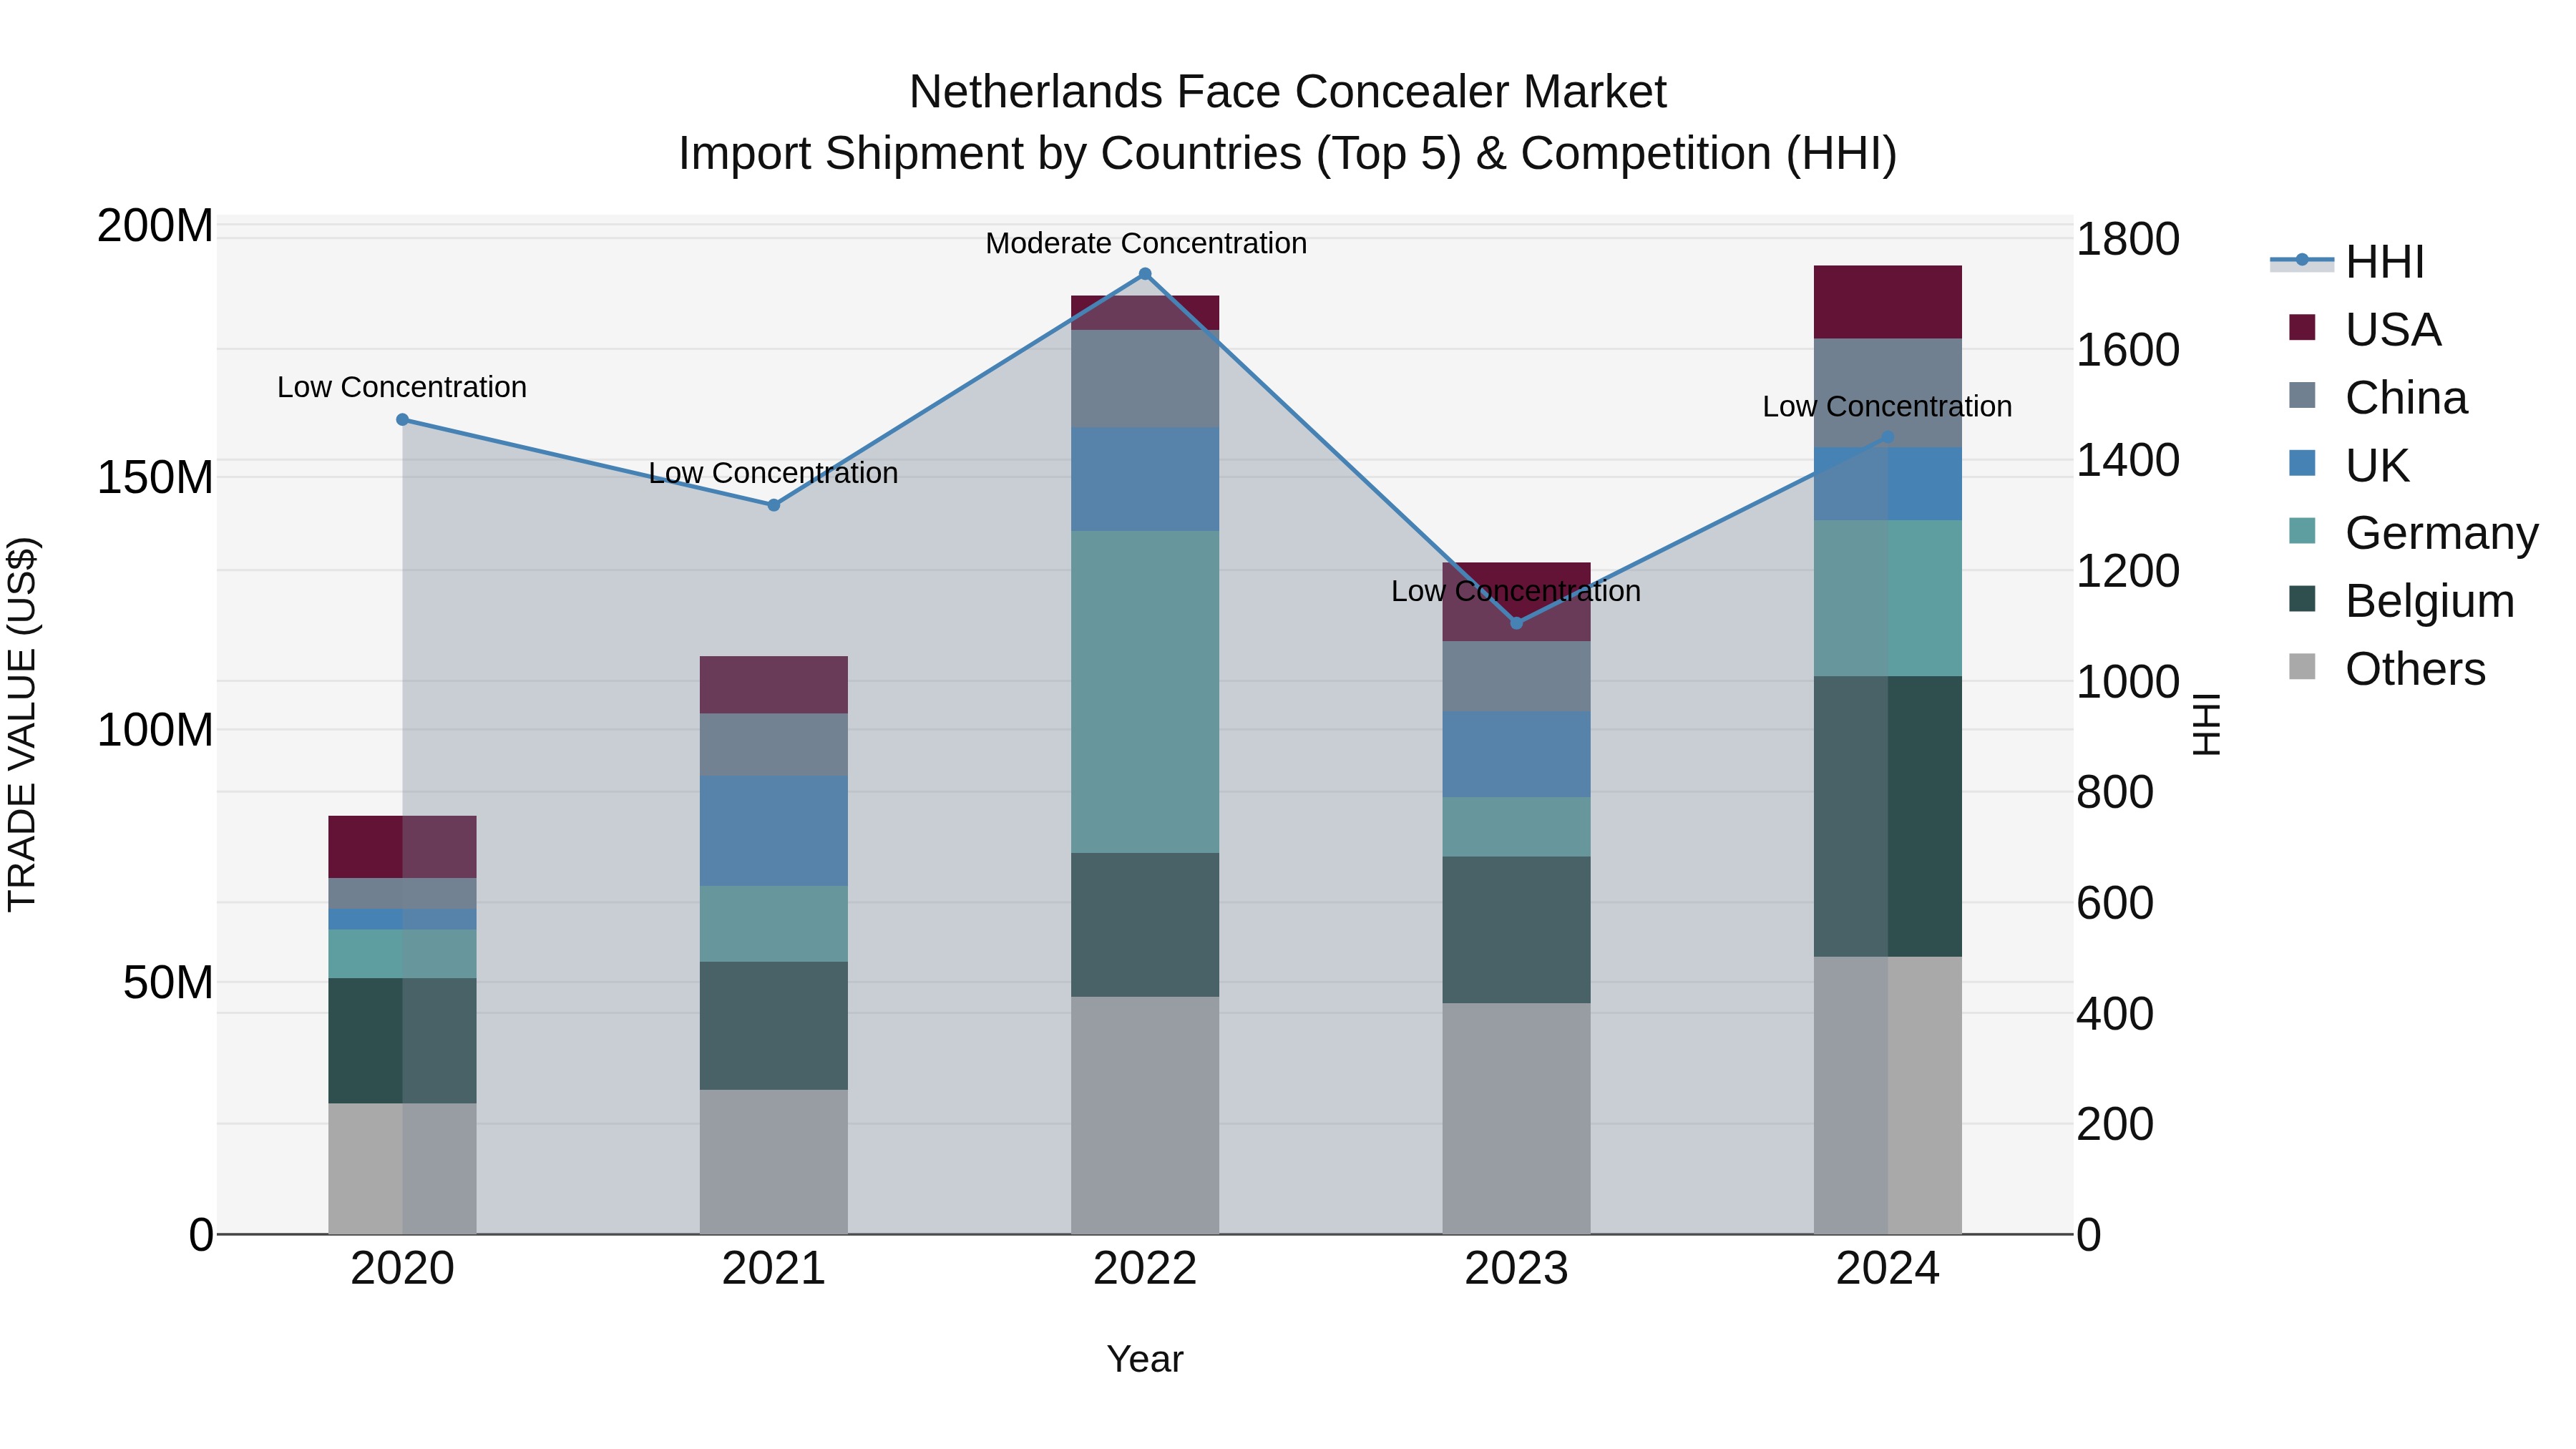
Netherlands Face Concealer Market Top 5 Importing Countries and Market Competition (HHI) Analysis
The Netherlands continues to be a key importer of face concealer, with top shipments coming from Belgium, Germany, China, USA, and UK in 2024. The market shows a low concentration with a Herfindahl-Hirschman Index (HHI) remaining stable. The industry exhibits strong growth potential, with a notable compound annual growth rate (CAGR) of 23.36% from 2020 to 2024. Notably, the growth rate spiked to 44.15% from 2023 to 2024, indicating a surge in demand for face concealers in the Netherlands market.
Key Highlights of the Report:
- Netherlands Face Concealer Market Outlook
- Market Size of Netherlands Face Concealer Market, 2025
- Forecast of Netherlands Face Concealer Market, 2032
- Historical Data and Forecast of Netherlands Face Concealer Revenues & Volume for the Period 2022 - 2032F
- Netherlands Face Concealer Market Trend Evolution
- Netherlands Face Concealer Market Drivers and Challenges
- Netherlands Face Concealer Price Trends
- Netherlands Face Concealer Porter's Five Forces
- Netherlands Face Concealer Industry Life Cycle
- Historical Data and Forecast of Netherlands Face Concealer Market Revenues & Volume By Product Type for the Period 2022 - 2032F
- Historical Data and Forecast of Netherlands Face Concealer Market Revenues & Volume By Full Coverage Concealers for the Period 2022 - 2032F
- Historical Data and Forecast of Netherlands Face Concealer Market Revenues & Volume By Light Coverage Concealers for the Period 2022 - 2032F
- Historical Data and Forecast of Netherlands Face Concealer Market Revenues & Volume By Under-eye Concealers for the Period 2022 - 2032F
- Historical Data and Forecast of Netherlands Face Concealer Market Revenues & Volume By Color-correcting Concealers for the Period 2022 - 2032F
- Historical Data and Forecast of Netherlands Face Concealer Market Revenues & Volume By Type of Coverage for the Period 2022 - 2032F
- Historical Data and Forecast of Netherlands Face Concealer Market Revenues & Volume By High Pigment Waterproof for the Period 2022 - 2032F
- Historical Data and Forecast of Netherlands Face Concealer Market Revenues & Volume By Lightweight Buildable for the Period 2022 - 2032F
- Historical Data and Forecast of Netherlands Face Concealer Market Revenues & Volume By Brightening Hydrating for the Period 2022 - 2032F
- Historical Data and Forecast of Netherlands Face Concealer Market Revenues & Volume By Green Yellow Purple for the Period 2022 - 2032F
- Historical Data and Forecast of Netherlands Face Concealer Market Revenues & Volume By End User for the Period 2022 - 2032F
- Historical Data and Forecast of Netherlands Face Concealer Market Revenues & Volume By Women Makeup Enthusiasts for the Period 2022 - 2032F
- Historical Data and Forecast of Netherlands Face Concealer Market Revenues & Volume By Teenagers Young Adults for the Period 2022 - 2032F
- Historical Data and Forecast of Netherlands Face Concealer Market Revenues & Volume By Middle-aged Older Adults for the Period 2022 - 2032F
- Historical Data and Forecast of Netherlands Face Concealer Market Revenues & Volume By Sensitive Skin Acne-Prone for the Period 2022 - 2032F
- Historical Data and Forecast of Netherlands Face Concealer Market Revenues & Volume By Application for the Period 2022 - 2032F
- Historical Data and Forecast of Netherlands Face Concealer Market Revenues & Volume By Covering Blemishes Scars for the Period 2022 - 2032F
- Historical Data and Forecast of Netherlands Face Concealer Market Revenues & Volume By Light Concealment Daily Use for the Period 2022 - 2032F
- Historical Data and Forecast of Netherlands Face Concealer Market Revenues & Volume By Dark Circle Coverage Brightening for the Period 2022 - 2032F
- Historical Data and Forecast of Netherlands Face Concealer Market Revenues & Volume By Redness Dark Spots Correction for the Period 2022 - 2032F
- Netherlands Face Concealer Import Export Trade Statistics
- Market Opportunity Assessment By Product Type
- Market Opportunity Assessment By Type of Coverage
- Market Opportunity Assessment By End User
- Market Opportunity Assessment By Application
- Netherlands Face Concealer Top Companies Market Share
- Netherlands Face Concealer Competitive Benchmarking By Technical and Operational Parameters
- Netherlands Face Concealer Company Profiles
- Netherlands Face Concealer Key Strategic Recommendations
Frequently Asked Questions About the Market Study (FAQs):
6Wresearch actively monitors the Netherlands Face Concealer Market and publishes its comprehensive annual report, highlighting emerging trends, growth drivers, revenue analysis, and forecast outlook. Our insights help businesses to make data-backed strategic decisions with ongoing market dynamics. Our analysts track relevent industries related to the Netherlands Face Concealer Market, allowing our clients with actionable intelligence and reliable forecasts tailored to emerging regional needs.
Yes, we provide customisation as per your requirements. To learn more, feel free to contact us on sales@6wresearch.com
1 Executive Summary |
2 Introduction |
2.1 Key Highlights of the Report |
2.2 Report Description |
2.3 Market Scope & Segmentation |
2.4 Research Methodology |
2.5 Assumptions |
3 Netherlands Face Concealer Market Overview |
3.1 Netherlands Country Macro Economic Indicators |
3.2 Netherlands Face Concealer Market Revenues & Volume, 2022 & 2032F |
3.3 Netherlands Face Concealer Market - Industry Life Cycle |
3.4 Netherlands Face Concealer Market - Porter's Five Forces |
3.5 Netherlands Face Concealer Market Revenues & Volume Share, By Product Type, 2022 & 2032F |
3.6 Netherlands Face Concealer Market Revenues & Volume Share, By Type of Coverage, 2022 & 2032F |
3.7 Netherlands Face Concealer Market Revenues & Volume Share, By End User, 2022 & 2032F |
3.8 Netherlands Face Concealer Market Revenues & Volume Share, By Application, 2022 & 2032F |
4 Netherlands Face Concealer Market Dynamics |
4.1 Impact Analysis |
4.2 Market Drivers |
4.2.1 Increasing consumer awareness about skincare and makeup products |
4.2.2 Growing demand for natural and organic face concealers |
4.2.3 Rise in disposable income leading to higher spending on beauty products |
4.3 Market Restraints |
4.3.1 Intense competition from established and emerging brands |
4.3.2 Fluctuating raw material prices impacting product costs |
4.3.3 Changing consumer preferences and trends affecting product demand |
5 Netherlands Face Concealer Market Trends |
6 Netherlands Face Concealer Market, By Types |
6.1 Netherlands Face Concealer Market, By Product Type |
6.1.1 Overview and Analysis |
6.1.2 Netherlands Face Concealer Market Revenues & Volume, By Product Type, 2022 - 2032F |
6.1.3 Netherlands Face Concealer Market Revenues & Volume, By Full Coverage Concealers, 2022 - 2032F |
6.1.4 Netherlands Face Concealer Market Revenues & Volume, By Light Coverage Concealers, 2022 - 2032F |
6.1.5 Netherlands Face Concealer Market Revenues & Volume, By Under-eye Concealers, 2022 - 2032F |
6.1.6 Netherlands Face Concealer Market Revenues & Volume, By Color-correcting Concealers, 2022 - 2032F |
6.2 Netherlands Face Concealer Market, By Type of Coverage |
6.2.1 Overview and Analysis |
6.2.2 Netherlands Face Concealer Market Revenues & Volume, By High Pigment Waterproof, 2022 - 2032F |
6.2.3 Netherlands Face Concealer Market Revenues & Volume, By Lightweight Buildable, 2022 - 2032F |
6.2.4 Netherlands Face Concealer Market Revenues & Volume, By Brightening Hydrating, 2022 - 2032F |
6.2.5 Netherlands Face Concealer Market Revenues & Volume, By Green Yellow Purple, 2022 - 2032F |
6.3 Netherlands Face Concealer Market, By End User |
6.3.1 Overview and Analysis |
6.3.2 Netherlands Face Concealer Market Revenues & Volume, By Women Makeup Enthusiasts, 2022 - 2032F |
6.3.3 Netherlands Face Concealer Market Revenues & Volume, By Teenagers Young Adults, 2022 - 2032F |
6.3.4 Netherlands Face Concealer Market Revenues & Volume, By Middle-aged Older Adults, 2022 - 2032F |
6.3.5 Netherlands Face Concealer Market Revenues & Volume, By Sensitive Skin Acne-Prone, 2022 - 2032F |
6.4 Netherlands Face Concealer Market, By Application |
6.4.1 Overview and Analysis |
6.4.2 Netherlands Face Concealer Market Revenues & Volume, By Covering Blemishes Scars, 2022 - 2032F |
6.4.3 Netherlands Face Concealer Market Revenues & Volume, By Light Concealment Daily Use, 2022 - 2032F |
6.4.4 Netherlands Face Concealer Market Revenues & Volume, By Dark Circle Coverage Brightening, 2022 - 2032F |
6.4.5 Netherlands Face Concealer Market Revenues & Volume, By Redness Dark Spots Correction, 2022 - 2032F |
7 Netherlands Face Concealer Market Import-Export Trade Statistics |
7.1 Netherlands Face Concealer Market Export to Major Countries |
7.2 Netherlands Face Concealer Market Imports from Major Countries |
8 Netherlands Face Concealer Market Key Performance Indicators |
8.1 Consumer engagement on social media platforms |
8.2 Number of new product launches in the face concealer segment |
8.3 Customer satisfaction and loyalty metrics |
8.4 Trend analysis for ingredient preferences in face concealers |
8.5 Market penetration in different age groups and demographics |
9 Netherlands Face Concealer Market - Opportunity Assessment |
9.1 Netherlands Face Concealer Market Opportunity Assessment, By Product Type, 2022 & 2032F |
9.2 Netherlands Face Concealer Market Opportunity Assessment, By Type of Coverage, 2022 & 2032F |
9.3 Netherlands Face Concealer Market Opportunity Assessment, By End User, 2022 & 2032F |
9.4 Netherlands Face Concealer Market Opportunity Assessment, By Application, 2022 & 2032F |
10 Netherlands Face Concealer Market - Competitive Landscape |
10.1 Netherlands Face Concealer Market Revenue Share, By Companies, 2025 |
10.2 Netherlands Face Concealer Market Competitive Benchmarking, By Operating and Technical Parameters |
11 Company Profiles |
12 Recommendations |
13 Disclaimer |
Global Go To Market Strategy - 2030
Export potential enables firms to identify high-growth global markets with greater confidence by combining advanced trade intelligence with a structured quantitative methodology. The framework analyzes emerging demand trends and country-level import patterns while integrating macroeconomic and trade datasets such as GDP and population forecasts, bilateral import–export flows, tariff structures, elasticity differentials between developed and developing economies, geographic distance, and import demand projections. Using weighted trade values from 2020–2024 as the base period to project country-to-country export potential for 2030, these inputs are operationalized through calculated drivers such as gravity model parameters, tariff impact factors, and projected GDP per-capita growth. Through an analysis of hidden potentials, demand hotspots, and market conditions that are most favorable to success, this method enables firms to focus on target countries, maximize returns, and global expansion with data, backed by accuracy.
By factoring in the projected importer demand gap that is currently unmet and could be potential opportunity, it identifies the potential for the Exporter (Country) among 190 countries, against the general trade analysis, which identifies the biggest importer or exporter.
To discover high-growth global markets and optimize your business strategy:
Click Here
Pricing
- Single User License$ 1,995
- Department License$ 2,400
- Site License$ 3,120
- Global License$ 3,795

Leadership Perspectives from Industry Events
Search
6Wresearch in the News
 Forbes
Citing 6Wresearch analytics to map global infrastructure and pharmaceutical industry trajectories.
 Bloomberg Law
Direct syndication of 6Wresearch's macro data points, capturing complex supply chain shifts.
 Reuters
Tracking industrial manufacturing adjustments and electronic security ecosystem scaling.
 Mint
Mint
Utilizing deep-tech sector market sizing to analyze global automation and robotics.
 The Economic Times
Anchoring features on industrial IoT growth metrics and connected smart-grid devices.
 Business Standard
Featuring strategic evaluations of Advanced Driver Assistance Systems (ADAS) and AI road safety.
 The Hindu
Spotlighting core commercial metrics ranging from unmanned aerial vehicles (UAVs) to consumer durables.
 Financial Express
Anchoring quarterly reviews on cross-border real estate tech and structural hardware manufacturing.
 Yahoo Finance
Syndicating the tracker's $30.1 billion untapped-market findings, spotlighting Japan, the US and China as India's top new-potential importers.
 India Today
Carrying the release on smartphones leading India's export potential to $94 billion by 2031, per 6WExportGTM data.
 Dailyhunt
Distributing the tracker findings to its regional readership, framing India's export diversification into Japan and Mexico.
 PR Newswire Original release
Publishing the full India Export Attractiveness Tracker 2026, detailing new trade corridors across iron ore, LCVs and pharmaceuticals.
 The Industrial
Highlighting the tracker's read on India's semiconductor ambitions and long-term chip-assembly export potential.
 PTI News
Reporting on the $66.81 billion pharmaceuticals export opportunity flagged in the tracker, amid looming US generic-drug tariffs.
 Tribune India
Covering the tracker's tariff-versus-regulation analysis across India's mature export markets in the US, China and UAE.
 ANI News
Amplifying the report's findings on polished diamonds, refined petroleum and medicines as India's core export engines.
 International Business Magazine
Covering the report's insight into how AEB, blind spot detection, and driver monitoring are reshaping India's ADAS market.
 Focus Gaming News
Highlighting the research forecast for Egypt's gambling market, projecting steady growth through 2032.
Thought Leadership and Analyst Meet


Our Clients
Latest Reports
- Gabon Citrullinemia Type-1 Market (2026-2032)
- Finland Citrullinemia Type-1 Market (2026-2032)
- Fiji Citrullinemia Type-1 Market (2026-2032)
- Ethiopia Citrullinemia Type-1 Market (2026-2032)
- Estonia Citrullinemia Type-1 Market (2026-2032)
- Eritrea Citrullinemia Type-1 Market (2026-2032)
- Equatorial Guinea Citrullinemia Type-1 Market (2026-2032)
- El Salvador Citrullinemia Type-1 Market (2026-2032)
- Ecuador Citrullinemia Type-1 Market (2026-2032)
- Dominica Citrullinemia Type-1 Market (2026-2032)
Industry Events and Analyst Meet

EV India Expo 2026

HIMTEX 2026

India Refining Summit 2026

India EV Show 2026

EV tech India Expo 2026
Whitepaper
- Middle East & Africa Commercial Security Market Click here to view more.
- Middle East & Africa Fire Safety Systems & Equipment Market Click here to view more.
- GCC Drone Market Click here to view more.
- Middle East Lighting Fixture Market Click here to view more.
- GCC Physical & Perimeter Security Market Click here to view more.