Netherlands Low Fat Non Dairy Creamer Market (2026-2032) | Strategy, Trends, Outlook, Challenges, Growth, Industry, Opportunities, Consumer Insights, Analysis, Size, Competitive, Companies, Value, Restraints, Revenue, Supply, Strategic Insights, Forecast, Segmentation, Competition, Drivers, Demand, Share, Pricing Analysis, Segments, Investment Trends
Market Forecast By Product Type (Low-fat creamers, Regular creamers, Sugar-free creamers), By Source (Plant-Based Milk, Vegetable Oil Based Creamers), By Flavor (Original, Vanilla, Hazelnut, French Vanilla, Chocolate, Others) And Competitive Landscape
| Product Code: ETC12576972 | Publication Date: Apr 2025 | Updated Date: Apr 2026 | Product Type: Market Research Report | |
| Publisher: 6Wresearch | Author: Sachin Kumar Rai | No. of Pages: 65 | No. of Figures: 34 | No. of Tables: 19 |
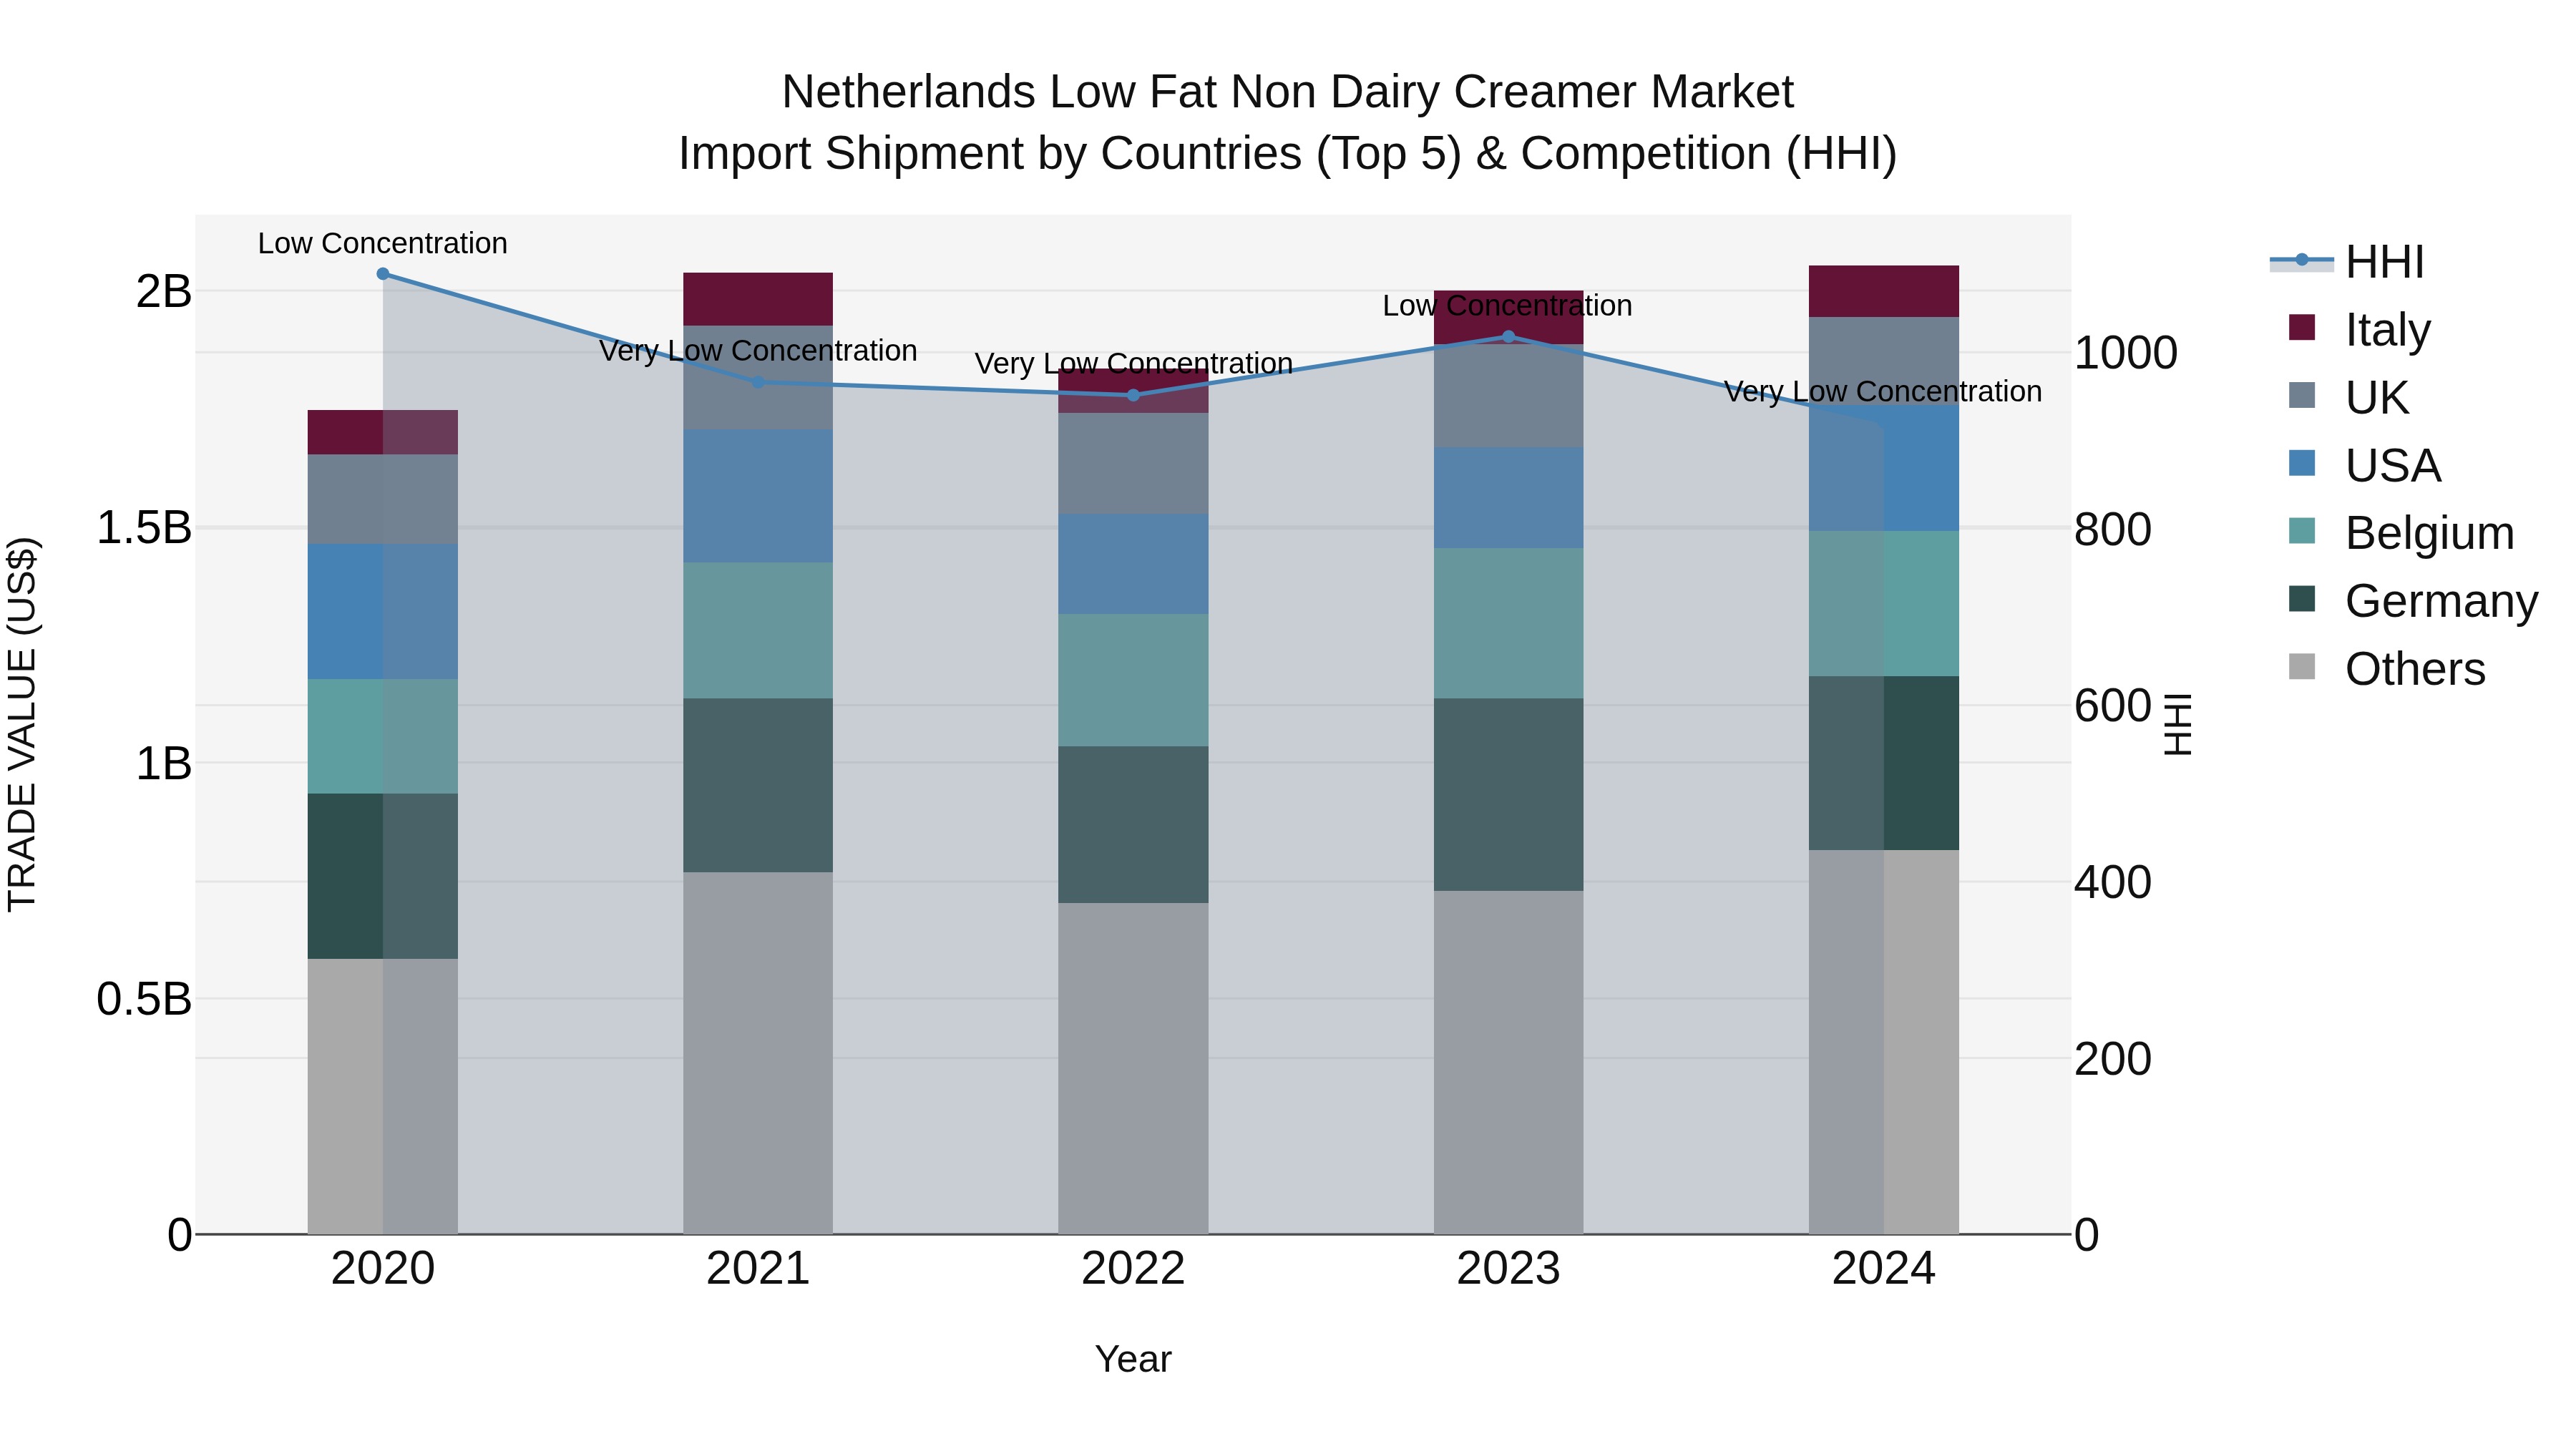
Netherlands Low Fat Non Dairy Creamer Market Top 5 Importing Countries and Market Competition (HHI) Analysis
The Netherlands witnessed a steady increase in import shipments of low fat non-dairy creamer in 2024, with top exporting countries being Germany, Belgium, USA, UK, and Italy. The market displayed a very low concentration level, indicating a diverse range of suppliers catering to the demand. The compound annual growth rate (CAGR) from 2020 to 2024 stood at a healthy 4.12%, while the growth rate in 2024 alone was 2.65%. This data suggests a promising outlook for the low fat non-dairy creamer market in the Netherlands, driven by consistent growth and a competitive supplier landscape.
Key Highlights of the Report:
- Netherlands Low Fat Non Dairy Creamer Market Outlook
- Market Size of Netherlands Low Fat Non Dairy Creamer Market, 2025
- Forecast of Netherlands Low Fat Non Dairy Creamer Market, 2032
- Historical Data and Forecast of Netherlands Low Fat Non Dairy Creamer Revenues & Volume for the Period 2022 - 2032F
- Netherlands Low Fat Non Dairy Creamer Market Trend Evolution
- Netherlands Low Fat Non Dairy Creamer Market Drivers and Challenges
- Netherlands Low Fat Non Dairy Creamer Price Trends
- Netherlands Low Fat Non Dairy Creamer Porter's Five Forces
- Netherlands Low Fat Non Dairy Creamer Industry Life Cycle
- Historical Data and Forecast of Netherlands Low Fat Non Dairy Creamer Market Revenues & Volume By Product Type for the Period 2022 - 2032F
- Historical Data and Forecast of Netherlands Low Fat Non Dairy Creamer Market Revenues & Volume By Low-fat creamers for the Period 2022 - 2032F
- Historical Data and Forecast of Netherlands Low Fat Non Dairy Creamer Market Revenues & Volume By Regular creamers for the Period 2022 - 2032F
- Historical Data and Forecast of Netherlands Low Fat Non Dairy Creamer Market Revenues & Volume By Sugar-free creamers for the Period 2022 - 2032F
- Historical Data and Forecast of Netherlands Low Fat Non Dairy Creamer Market Revenues & Volume By Source for the Period 2022 - 2032F
- Historical Data and Forecast of Netherlands Low Fat Non Dairy Creamer Market Revenues & Volume By Plant-Based Milk for the Period 2022 - 2032F
- Historical Data and Forecast of Netherlands Low Fat Non Dairy Creamer Market Revenues & Volume By Vegetable Oil Based Creamers for the Period 2022 - 2032F
- Historical Data and Forecast of Netherlands Low Fat Non Dairy Creamer Market Revenues & Volume By Flavor for the Period 2022 - 2032F
- Historical Data and Forecast of Netherlands Low Fat Non Dairy Creamer Market Revenues & Volume By Original for the Period 2022 - 2032F
- Historical Data and Forecast of Netherlands Low Fat Non Dairy Creamer Market Revenues & Volume By Vanilla for the Period 2022 - 2032F
- Historical Data and Forecast of Netherlands Low Fat Non Dairy Creamer Market Revenues & Volume By Hazelnut for the Period 2022 - 2032F
- Historical Data and Forecast of Netherlands Low Fat Non Dairy Creamer Market Revenues & Volume By French Vanilla for the Period 2022 - 2032F
- Historical Data and Forecast of Netherlands Low Fat Non Dairy Creamer Market Revenues & Volume By Chocolate for the Period 2022 - 2032F
- Historical Data and Forecast of Netherlands Low Fat Non Dairy Creamer Market Revenues & Volume By Others for the Period 2022 - 2032F
- Netherlands Low Fat Non Dairy Creamer Import Export Trade Statistics
- Market Opportunity Assessment By Product Type
- Market Opportunity Assessment By Source
- Market Opportunity Assessment By Flavor
- Netherlands Low Fat Non Dairy Creamer Top Companies Market Share
- Netherlands Low Fat Non Dairy Creamer Competitive Benchmarking By Technical and Operational Parameters
- Netherlands Low Fat Non Dairy Creamer Company Profiles
- Netherlands Low Fat Non Dairy Creamer Key Strategic Recommendations
Frequently Asked Questions About the Market Study (FAQs):
6Wresearch actively monitors the Netherlands Low Fat Non Dairy Creamer Market and publishes its comprehensive annual report, highlighting emerging trends, growth drivers, revenue analysis, and forecast outlook. Our insights help businesses to make data-backed strategic decisions with ongoing market dynamics. Our analysts track relevent industries related to the Netherlands Low Fat Non Dairy Creamer Market, allowing our clients with actionable intelligence and reliable forecasts tailored to emerging regional needs.
Yes, we provide customisation as per your requirements. To learn more, feel free to contact us on sales@6wresearch.com
1 Executive Summary |
2 Introduction |
2.1 Key Highlights of the Report |
2.2 Report Description |
2.3 Market Scope & Segmentation |
2.4 Research Methodology |
2.5 Assumptions |
3 Netherlands Low Fat Non Dairy Creamer Market Overview |
3.1 Netherlands Country Macro Economic Indicators |
3.2 Netherlands Low Fat Non Dairy Creamer Market Revenues & Volume, 2022 & 2032F |
3.3 Netherlands Low Fat Non Dairy Creamer Market - Industry Life Cycle |
3.4 Netherlands Low Fat Non Dairy Creamer Market - Porter's Five Forces |
3.5 Netherlands Low Fat Non Dairy Creamer Market Revenues & Volume Share, By Product Type, 2022 & 2032F |
3.6 Netherlands Low Fat Non Dairy Creamer Market Revenues & Volume Share, By Source, 2022 & 2032F |
3.7 Netherlands Low Fat Non Dairy Creamer Market Revenues & Volume Share, By Flavor, 2022 & 2032F |
4 Netherlands Low Fat Non Dairy Creamer Market Dynamics |
4.1 Impact Analysis |
4.2 Market Drivers |
4.2.1 Increasing health consciousness among consumers leading to a preference for low-fat products. |
4.2.2 Growing demand for non-dairy options among lactose-intolerant individuals and vegans. |
4.2.3 Rising disposable income and changing lifestyles driving the demand for convenient food and beverage options. |
4.3 Market Restraints |
4.3.1 Price fluctuations in raw materials impacting production costs. |
4.3.2 Intense competition from traditional dairy creamers and other non-dairy alternatives. |
4.3.3 Regulatory challenges and changing food safety standards affecting product formulations. |
5 Netherlands Low Fat Non Dairy Creamer Market Trends |
6 Netherlands Low Fat Non Dairy Creamer Market, By Types |
6.1 Netherlands Low Fat Non Dairy Creamer Market, By Product Type |
6.1.1 Overview and Analysis |
6.1.2 Netherlands Low Fat Non Dairy Creamer Market Revenues & Volume, By Product Type, 2022 - 2032F |
6.1.3 Netherlands Low Fat Non Dairy Creamer Market Revenues & Volume, By Low-fat creamers, 2022 - 2032F |
6.1.4 Netherlands Low Fat Non Dairy Creamer Market Revenues & Volume, By Regular creamers, 2022 - 2032F |
6.1.5 Netherlands Low Fat Non Dairy Creamer Market Revenues & Volume, By Sugar-free creamers , 2022 - 2032F |
6.2 Netherlands Low Fat Non Dairy Creamer Market, By Source |
6.2.1 Overview and Analysis |
6.2.2 Netherlands Low Fat Non Dairy Creamer Market Revenues & Volume, By Plant-Based Milk, 2022 - 2032F |
6.2.3 Netherlands Low Fat Non Dairy Creamer Market Revenues & Volume, By Vegetable Oil Based Creamers, 2022 - 2032F |
6.3 Netherlands Low Fat Non Dairy Creamer Market, By Flavor |
6.3.1 Overview and Analysis |
6.3.2 Netherlands Low Fat Non Dairy Creamer Market Revenues & Volume, By Original, 2022 - 2032F |
6.3.3 Netherlands Low Fat Non Dairy Creamer Market Revenues & Volume, By Vanilla, 2022 - 2032F |
6.3.4 Netherlands Low Fat Non Dairy Creamer Market Revenues & Volume, By Hazelnut, 2022 - 2032F |
6.3.5 Netherlands Low Fat Non Dairy Creamer Market Revenues & Volume, By French Vanilla, 2022 - 2032F |
6.3.6 Netherlands Low Fat Non Dairy Creamer Market Revenues & Volume, By Chocolate, 2022 - 2032F |
6.3.7 Netherlands Low Fat Non Dairy Creamer Market Revenues & Volume, By Others, 2022 - 2032F |
7 Netherlands Low Fat Non Dairy Creamer Market Import-Export Trade Statistics |
7.1 Netherlands Low Fat Non Dairy Creamer Market Export to Major Countries |
7.2 Netherlands Low Fat Non Dairy Creamer Market Imports from Major Countries |
8 Netherlands Low Fat Non Dairy Creamer Market Key Performance Indicators |
8.1 Consumer awareness and perception of low fat non-dairy creamers. |
8.2 Adoption rate of low fat non-dairy creamers in households and food service establishments. |
8.3 Frequency of product innovation and new product launches in the market. |
8.4 Sustainability practices and certifications in the production of low fat non-dairy creamers. |
8.5 Consumer feedback and satisfaction levels with the taste and quality of low fat non-dairy creamers. |
9 Netherlands Low Fat Non Dairy Creamer Market - Opportunity Assessment |
9.1 Netherlands Low Fat Non Dairy Creamer Market Opportunity Assessment, By Product Type, 2022 & 2032F |
9.2 Netherlands Low Fat Non Dairy Creamer Market Opportunity Assessment, By Source, 2022 & 2032F |
9.3 Netherlands Low Fat Non Dairy Creamer Market Opportunity Assessment, By Flavor, 2022 & 2032F |
10 Netherlands Low Fat Non Dairy Creamer Market - Competitive Landscape |
10.1 Netherlands Low Fat Non Dairy Creamer Market Revenue Share, By Companies, 2025 |
10.2 Netherlands Low Fat Non Dairy Creamer Market Competitive Benchmarking, By Operating and Technical Parameters |
11 Company Profiles |
12 Recommendations |
13 Disclaimer |
Export potential assessment - trade Analytics for 2030
Export potential enables firms to identify high-growth global markets with greater confidence by combining advanced trade intelligence with a structured quantitative methodology. The framework analyzes emerging demand trends and country-level import patterns while integrating macroeconomic and trade datasets such as GDP and population forecasts, bilateral import–export flows, tariff structures, elasticity differentials between developed and developing economies, geographic distance, and import demand projections. Using weighted trade values from 2020–2024 as the base period to project country-to-country export potential for 2030, these inputs are operationalized through calculated drivers such as gravity model parameters, tariff impact factors, and projected GDP per-capita growth. Through an analysis of hidden potentials, demand hotspots, and market conditions that are most favorable to success, this method enables firms to focus on target countries, maximize returns, and global expansion with data, backed by accuracy.
By factoring in the projected importer demand gap that is currently unmet and could be potential opportunity, it identifies the potential for the Exporter (Country) among 190 countries, against the general trade analysis, which identifies the biggest importer or exporter.
To discover high-growth global markets and optimize your business strategy:
Click Here
Pricing
- Single User License$ 1,995
- Department License$ 2,400
- Site License$ 3,120
- Global License$ 3,795

Search
Thought Leadership and Analyst Meet


Our Clients
Latest Reports
- China Electric Appliance Rental Market (2026-2032) | Trends, Revenue, Growth, Challenges, Size, Value, Outlook, Pricing, Strategy, Insights, Restraints, segmentation, Companies, Investment Opportunities, Analysis, Demand, Drivers, Competition, Forecast, Share
- Chile Electric Appliance Rental Market (2026-2032) | Outlook, Competition, Drivers, Strategy, Revenue, Analysis, Value, Pricing, Restraints, Size, Demand, Share, Growth, Forecast, Challenges, Insights, Investment Opportunities, Companies, Trends, segmentation
- Cambodia Electric Appliance Rental Market (2026-2032) | Companies, Analysis, Restraints, Pricing, Insights, Challenges, Outlook, Strategy, Forecast, Trends, Competition, Value, Revenue, Investment Opportunities, segmentation, Drivers, Size, Demand, Growth, Share
- Brazil Electric Appliance Rental Market (2026-2032) | Revenue, Strategy, Forecast, Companies, segmentation, Competition, Size, Investment Opportunities, Pricing, Restraints, Outlook, Challenges, Analysis, Drivers, Value, Demand, Insights, Trends, Growth, Share
- Bangladesh Electric Appliance Rental Market (2026-2032) | Drivers, Forecast, Investment Opportunities, Strategy, Insights, Demand, Challenges, Outlook, Trends, Competition, Value, Revenue, Size, Pricing, Analysis, Companies, Restraints, segmentation, Share, Growth
- Bahrain Electric Appliance Rental Market (2026-2032) | Outlook, Size, Competition, Restraints, Drivers, Value, Trends, Investment Opportunities, Insights, Forecast, Revenue, Strategy, Growth, Share, Demand, Analysis, Challenges, Companies, segmentation, Pricing
- Azerbaijan Electric Appliance Rental Market (2026-2032) | Trends, Investment Opportunities, Restraints, Insights, Strategy, Competition, Value, Growth, Demand, Drivers, Analysis, Forecast, Size, Share, Outlook, segmentation, Pricing, Challenges, Revenue, Companies
- Australia Electric Appliance Rental Market (2026-2032) | Challenges, Restraints, Forecast, Demand, Size, Competition, Pricing, Investment Opportunities, Revenue, Trends, Drivers, Growth, Outlook, Analysis, Strategy, Value, segmentation, Insights, Companies, Share
- Argentina Electric Appliance Rental Market (2026-2032) | Growth, Trends, Insights, Outlook, Forecast, Size, Drivers, Analysis, Restraints, Challenges, Share, Revenue, Investment Opportunities, Strategy, Demand, Value, Companies, segmentation, Competition, Pricing
- Algeria Electric Appliance Rental Market (2026-2032) | Share, Size, Value, Strategy, Competition, Outlook, Challenges, Companies, Trends, Pricing, Insights, Forecast, Investment Opportunities, Revenue, Growth, Restraints, segmentation, Analysis, Demand, Drivers
Industry Events and Analyst Meet

HIMTEX 2026

India Refining Summit 2026

India EV Show 2026

EV tech India Expo 2026

Auto Tech Asia 2026
Whitepaper
- Middle East & Africa Commercial Security Market Click here to view more.
- Middle East & Africa Fire Safety Systems & Equipment Market Click here to view more.
- GCC Drone Market Click here to view more.
- Middle East Lighting Fixture Market Click here to view more.
- GCC Physical & Perimeter Security Market Click here to view more.
6WResearch In News
- Doha a strategic location for EV manufacturing hub: IPA Qatar
- Demand for luxury TVs surging in the GCC, says Samsung
- Empowering Growth: The Thriving Journey of Bangladesh’s Cable Industry
- Demand for luxury TVs surging in the GCC, says Samsung
- Video call with a traditional healer? Once unthinkable, it’s now common in South Africa
- Intelligent Buildings To Smooth GCC’s Path To Net Zero