Netherlands Non-Dairy Toppings Market (2025-2031) | Analysis, Trends, Companies, Growth, Value, Size & Revenue, Segmentation, Forecast, Competitive Landscape, Outlook, Industry, Share
Market Forecast By Type (Whip Cream, Pouring Cream, Spooning, Others), By Form (Liquid, Powder, Frozen), By Base Ingredient (Soy Milk, Vegetable Oil, Almond Milk, Coconut Milk, Others), By Application (Bakery, Confectionery, Processed Fruits, Frozen Desserts, Beverage, Others), By Distribution Channel (Specialty Food Stores, E-Commerce, Modern Stores, Others) And Competitive Landscape
| Product Code: ETC8543982 | Publication Date: Sep 2024 | Updated Date: Nov 2025 | Product Type: Market Research Report | |
| Publisher: 6Wresearch | Author: Shubham Padhi | No. of Pages: 75 | No. of Figures: 35 | No. of Tables: 20 |
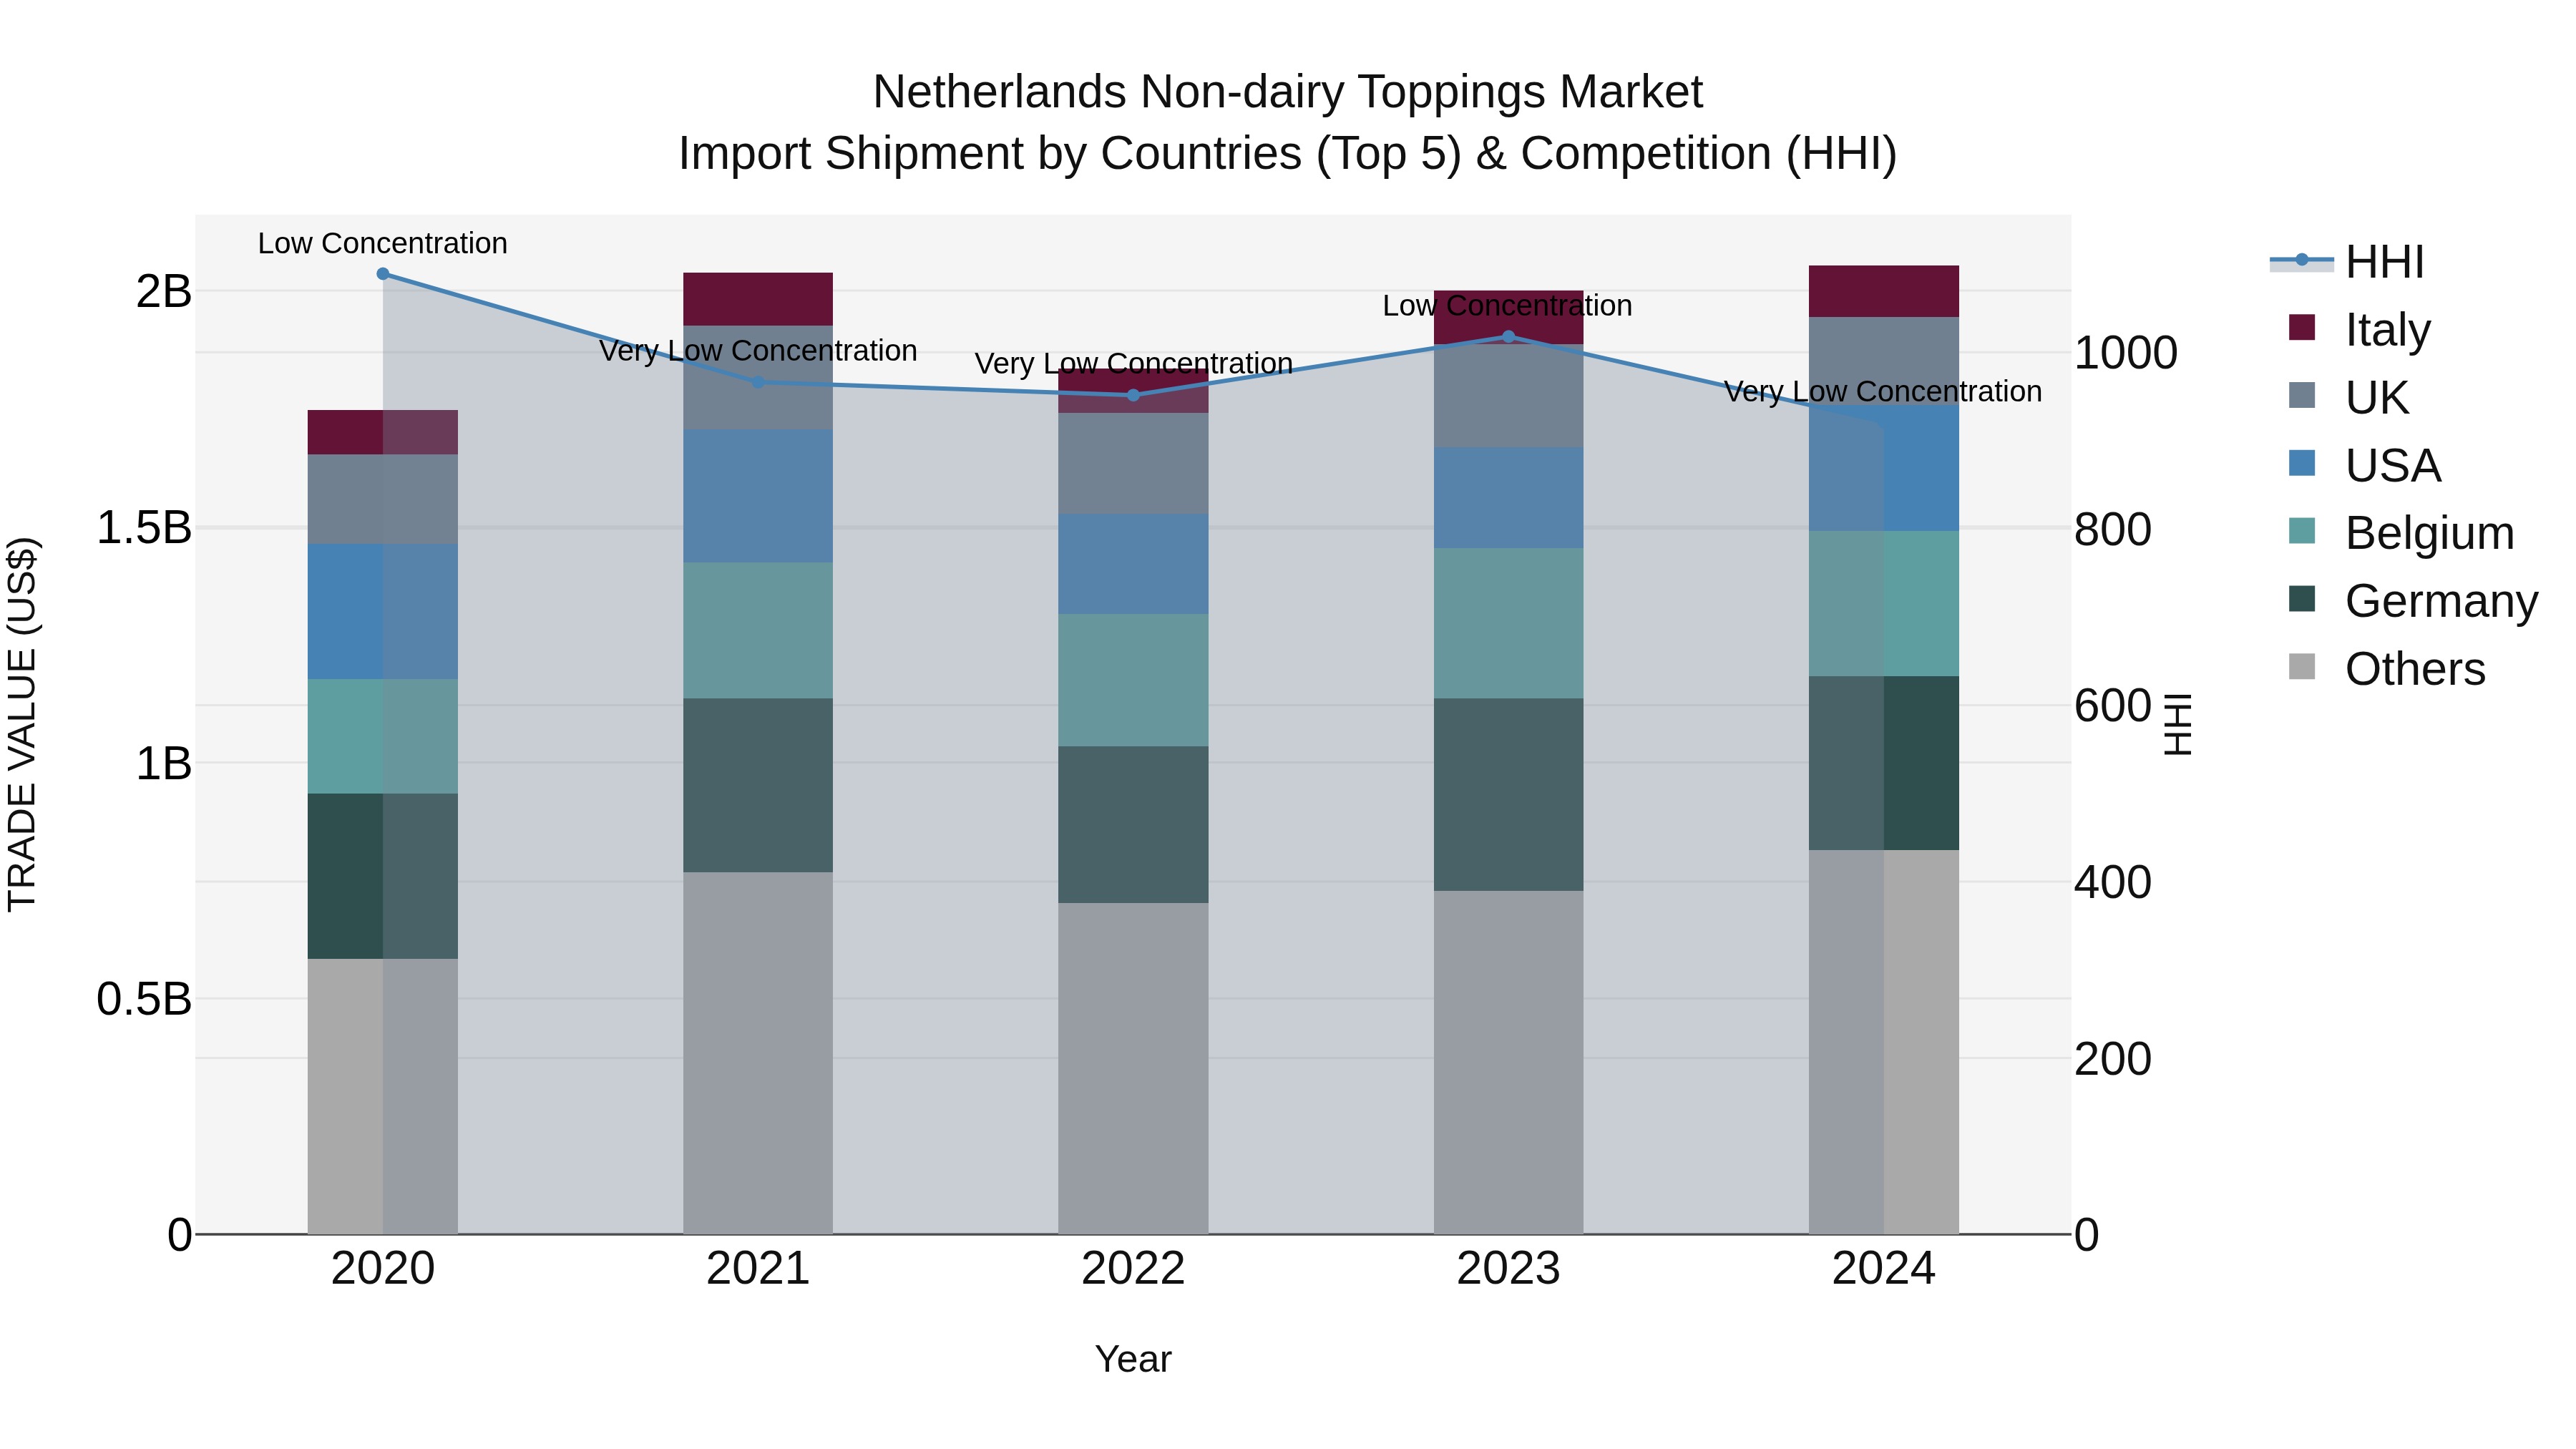
Netherlands Non-dairy Toppings Market Import Shipment by Countries (Top 5) & Competition (HHI)
The Netherlands non-dairy toppings import market continues to see steady growth, with key exporting countries including Germany, Belgium, USA, UK, and Italy. The market concentration, as measured by the HHI, decreased significantly from low to very low in 2024, indicating a more competitive landscape. The compound annual growth rate (CAGR) from 2020 to 2024 stands at 4.12%, with a growth rate of 2.65% from 2023 to 2024, showcasing a positive trend in demand for non-dairy toppings in the Netherlands. This indicates opportunities for both domestic and international suppliers to tap into this growing market.
Key Highlights of the Report:
- Netherlands Non-Dairy Toppings Market Outlook
- Market Size of Netherlands Non-Dairy Toppings Market, 2024
- Forecast of Netherlands Non-Dairy Toppings Market, 2031
- Historical Data and Forecast of Netherlands Non-Dairy Toppings Revenues & Volume for the Period 2021- 2031
- Netherlands Non-Dairy Toppings Market Trend Evolution
- Netherlands Non-Dairy Toppings Market Drivers and Challenges
- Netherlands Non-Dairy Toppings Price Trends
- Netherlands Non-Dairy Toppings Porter's Five Forces
- Netherlands Non-Dairy Toppings Industry Life Cycle
- Historical Data and Forecast of Netherlands Non-Dairy Toppings Market Revenues & Volume By Type for the Period 2021- 2031
- Historical Data and Forecast of Netherlands Non-Dairy Toppings Market Revenues & Volume By Whip Cream for the Period 2021- 2031
- Historical Data and Forecast of Netherlands Non-Dairy Toppings Market Revenues & Volume By Pouring Cream for the Period 2021- 2031
- Historical Data and Forecast of Netherlands Non-Dairy Toppings Market Revenues & Volume By Spooning for the Period 2021- 2031
- Historical Data and Forecast of Netherlands Non-Dairy Toppings Market Revenues & Volume By Others for the Period 2021- 2031
- Historical Data and Forecast of Netherlands Non-Dairy Toppings Market Revenues & Volume By Form for the Period 2021- 2031
- Historical Data and Forecast of Netherlands Non-Dairy Toppings Market Revenues & Volume By Liquid for the Period 2021- 2031
- Historical Data and Forecast of Netherlands Non-Dairy Toppings Market Revenues & Volume By Powder for the Period 2021- 2031
- Historical Data and Forecast of Netherlands Non-Dairy Toppings Market Revenues & Volume By Frozen for the Period 2021- 2031
- Historical Data and Forecast of Netherlands Non-Dairy Toppings Market Revenues & Volume By Base Ingredient for the Period 2021- 2031
- Historical Data and Forecast of Netherlands Non-Dairy Toppings Market Revenues & Volume By Soy Milk for the Period 2021- 2031
- Historical Data and Forecast of Netherlands Non-Dairy Toppings Market Revenues & Volume By Vegetable Oil, for the Period 2021- 2031
- Historical Data and Forecast of Netherlands Non-Dairy Toppings Market Revenues & Volume By Almond Milk for the Period 2021- 2031
- Historical Data and Forecast of Netherlands Non-Dairy Toppings Market Revenues & Volume By Coconut Milk for the Period 2021- 2031
- Historical Data and Forecast of Netherlands Non-Dairy Toppings Market Revenues & Volume By Others for the Period 2021- 2031
- Historical Data and Forecast of Netherlands Non-Dairy Toppings Market Revenues & Volume By Application for the Period 2021- 2031
- Historical Data and Forecast of Netherlands Non-Dairy Toppings Market Revenues & Volume By Bakery for the Period 2021- 2031
- Historical Data and Forecast of Netherlands Non-Dairy Toppings Market Revenues & Volume By Confectionery for the Period 2021- 2031
- Historical Data and Forecast of Netherlands Non-Dairy Toppings Market Revenues & Volume By Processed Fruits for the Period 2021- 2031
- Historical Data and Forecast of Netherlands Non-Dairy Toppings Market Revenues & Volume By Frozen Desserts for the Period 2021- 2031
- Historical Data and Forecast of Netherlands Non-Dairy Toppings Market Revenues & Volume By Beverage for the Period 2021- 2031
- Historical Data and Forecast of Netherlands Non-Dairy Toppings Market Revenues & Volume By Others for the Period 2021- 2031
- Historical Data and Forecast of Netherlands Non-Dairy Toppings Market Revenues & Volume By Distribution Channel for the Period 2021- 2031
- Historical Data and Forecast of Netherlands Non-Dairy Toppings Market Revenues & Volume By Specialty Food Stores for the Period 2021- 2031
- Historical Data and Forecast of Netherlands Non-Dairy Toppings Market Revenues & Volume By E-Commerce for the Period 2021- 2031
- Historical Data and Forecast of Netherlands Non-Dairy Toppings Market Revenues & Volume By Modern Stores for the Period 2021- 2031
- Historical Data and Forecast of Netherlands Non-Dairy Toppings Market Revenues & Volume By Others for the Period 2021- 2031
- Netherlands Non-Dairy Toppings Import Export Trade Statistics
- Market Opportunity Assessment By Type
- Market Opportunity Assessment By Form
- Market Opportunity Assessment By Base Ingredient
- Market Opportunity Assessment By Application
- Market Opportunity Assessment By Distribution Channel
- Netherlands Non-Dairy Toppings Top Companies Market Share
- Netherlands Non-Dairy Toppings Competitive Benchmarking By Technical and Operational Parameters
- Netherlands Non-Dairy Toppings Company Profiles
- Netherlands Non-Dairy Toppings Key Strategic Recommendations
Frequently Asked Questions About the Market Study (FAQs):
6Wresearch actively monitors the Netherlands Non-Dairy Toppings Market and publishes its comprehensive annual report, highlighting emerging trends, growth drivers, revenue analysis, and forecast outlook. Our insights help businesses to make data-backed strategic decisions with ongoing market dynamics. Our analysts track relevent industries related to the Netherlands Non-Dairy Toppings Market, allowing our clients with actionable intelligence and reliable forecasts tailored to emerging regional needs.
Yes, we provide customisation as per your requirements. To learn more, feel free to contact us on sales@6wresearch.com
1 Executive Summary |
2 Introduction |
2.1 Key Highlights of the Report |
2.2 Report Description |
2.3 Market Scope & Segmentation |
2.4 Research Methodology |
2.5 Assumptions |
3 Netherlands Non-Dairy Toppings Market Overview |
3.1 Netherlands Country Macro Economic Indicators |
3.2 Netherlands Non-Dairy Toppings Market Revenues & Volume, 2021 & 2031F |
3.3 Netherlands Non-Dairy Toppings Market - Industry Life Cycle |
3.4 Netherlands Non-Dairy Toppings Market - Porter's Five Forces |
3.5 Netherlands Non-Dairy Toppings Market Revenues & Volume Share, By Type, 2021 & 2031F |
3.6 Netherlands Non-Dairy Toppings Market Revenues & Volume Share, By Form, 2021 & 2031F |
3.7 Netherlands Non-Dairy Toppings Market Revenues & Volume Share, By Base Ingredient, 2021 & 2031F |
3.8 Netherlands Non-Dairy Toppings Market Revenues & Volume Share, By Application, 2021 & 2031F |
3.9 Netherlands Non-Dairy Toppings Market Revenues & Volume Share, By Distribution Channel, 2021 & 2031F |
4 Netherlands Non-Dairy Toppings Market Dynamics |
4.1 Impact Analysis |
4.2 Market Drivers |
4.2.1 Increasing health consciousness among consumers leading to a growing demand for non-dairy alternatives |
4.2.2 Rising prevalence of lactose intolerance and dairy allergies driving the adoption of non-dairy toppings |
4.2.3 Growing trend of veganism and plant-based diets influencing consumer choices in the Netherlands non-dairy toppings market |
4.3 Market Restraints |
4.3.1 Higher pricing of non-dairy toppings compared to traditional dairy products may limit market penetration |
4.3.2 Limited product availability and variety in the non-dairy toppings segment |
4.3.3 Challenges in achieving similar taste and texture profiles as traditional dairy toppings |
5 Netherlands Non-Dairy Toppings Market Trends |
6 Netherlands Non-Dairy Toppings Market, By Types |
6.1 Netherlands Non-Dairy Toppings Market, By Type |
6.1.1 Overview and Analysis |
6.1.2 Netherlands Non-Dairy Toppings Market Revenues & Volume, By Type, 2021- 2031F |
6.1.3 Netherlands Non-Dairy Toppings Market Revenues & Volume, By Whip Cream, 2021- 2031F |
6.1.4 Netherlands Non-Dairy Toppings Market Revenues & Volume, By Pouring Cream, 2021- 2031F |
6.1.5 Netherlands Non-Dairy Toppings Market Revenues & Volume, By Spooning, 2021- 2031F |
6.1.6 Netherlands Non-Dairy Toppings Market Revenues & Volume, By Others, 2021- 2031F |
6.2 Netherlands Non-Dairy Toppings Market, By Form |
6.2.1 Overview and Analysis |
6.2.2 Netherlands Non-Dairy Toppings Market Revenues & Volume, By Liquid, 2021- 2031F |
6.2.3 Netherlands Non-Dairy Toppings Market Revenues & Volume, By Powder, 2021- 2031F |
6.2.4 Netherlands Non-Dairy Toppings Market Revenues & Volume, By Frozen, 2021- 2031F |
6.3 Netherlands Non-Dairy Toppings Market, By Base Ingredient |
6.3.1 Overview and Analysis |
6.3.2 Netherlands Non-Dairy Toppings Market Revenues & Volume, By Soy Milk, 2021- 2031F |
6.3.3 Netherlands Non-Dairy Toppings Market Revenues & Volume, By Vegetable Oil,, 2021- 2031F |
6.3.4 Netherlands Non-Dairy Toppings Market Revenues & Volume, By Almond Milk, 2021- 2031F |
6.3.5 Netherlands Non-Dairy Toppings Market Revenues & Volume, By Coconut Milk, 2021- 2031F |
6.3.6 Netherlands Non-Dairy Toppings Market Revenues & Volume, By Others, 2021- 2031F |
6.4 Netherlands Non-Dairy Toppings Market, By Application |
6.4.1 Overview and Analysis |
6.4.2 Netherlands Non-Dairy Toppings Market Revenues & Volume, By Bakery, 2021- 2031F |
6.4.3 Netherlands Non-Dairy Toppings Market Revenues & Volume, By Confectionery, 2021- 2031F |
6.4.4 Netherlands Non-Dairy Toppings Market Revenues & Volume, By Processed Fruits, 2021- 2031F |
6.4.5 Netherlands Non-Dairy Toppings Market Revenues & Volume, By Frozen Desserts, 2021- 2031F |
6.4.6 Netherlands Non-Dairy Toppings Market Revenues & Volume, By Beverage, 2021- 2031F |
6.4.7 Netherlands Non-Dairy Toppings Market Revenues & Volume, By Others, 2021- 2031F |
6.5 Netherlands Non-Dairy Toppings Market, By Distribution Channel |
6.5.1 Overview and Analysis |
6.5.2 Netherlands Non-Dairy Toppings Market Revenues & Volume, By Specialty Food Stores, 2021- 2031F |
6.5.3 Netherlands Non-Dairy Toppings Market Revenues & Volume, By E-Commerce, 2021- 2031F |
6.5.4 Netherlands Non-Dairy Toppings Market Revenues & Volume, By Modern Stores, 2021- 2031F |
6.5.5 Netherlands Non-Dairy Toppings Market Revenues & Volume, By Others, 2021- 2031F |
7 Netherlands Non-Dairy Toppings Market Import-Export Trade Statistics |
7.1 Netherlands Non-Dairy Toppings Market Export to Major Countries |
7.2 Netherlands Non-Dairy Toppings Market Imports from Major Countries |
8 Netherlands Non-Dairy Toppings Market Key Performance Indicators |
8.1 Number of new product launches in the non-dairy toppings segment |
8.2 Consumer awareness and perception of non-dairy toppings through surveys and focus groups |
8.3 Growth in the number of foodservice establishments offering non-dairy topping options |
9 Netherlands Non-Dairy Toppings Market - Opportunity Assessment |
9.1 Netherlands Non-Dairy Toppings Market Opportunity Assessment, By Type, 2021 & 2031F |
9.2 Netherlands Non-Dairy Toppings Market Opportunity Assessment, By Form, 2021 & 2031F |
9.3 Netherlands Non-Dairy Toppings Market Opportunity Assessment, By Base Ingredient, 2021 & 2031F |
9.4 Netherlands Non-Dairy Toppings Market Opportunity Assessment, By Application, 2021 & 2031F |
9.5 Netherlands Non-Dairy Toppings Market Opportunity Assessment, By Distribution Channel, 2021 & 2031F |
10 Netherlands Non-Dairy Toppings Market - Competitive Landscape |
10.1 Netherlands Non-Dairy Toppings Market Revenue Share, By Companies, 2024 |
10.2 Netherlands Non-Dairy Toppings Market Competitive Benchmarking, By Operating and Technical Parameters |
11 Company Profiles |
12 Recommendations |
13 Disclaimer |
Export potential assessment - trade Analytics for 2030
Export potential enables firms to identify high-growth global markets with greater confidence by combining advanced trade intelligence with a structured quantitative methodology. The framework analyzes emerging demand trends and country-level import patterns while integrating macroeconomic and trade datasets such as GDP and population forecasts, bilateral import–export flows, tariff structures, elasticity differentials between developed and developing economies, geographic distance, and import demand projections. Using weighted trade values from 2020–2024 as the base period to project country-to-country export potential for 2030, these inputs are operationalized through calculated drivers such as gravity model parameters, tariff impact factors, and projected GDP per-capita growth. Through an analysis of hidden potentials, demand hotspots, and market conditions that are most favorable to success, this method enables firms to focus on target countries, maximize returns, and global expansion with data, backed by accuracy.
By factoring in the projected importer demand gap that is currently unmet and could be potential opportunity, it identifies the potential for the Exporter (Country) among 190 countries, against the general trade analysis, which identifies the biggest importer or exporter.
To discover high-growth global markets and optimize your business strategy:
Click Here
Pricing
- Single User License$ 1,995
- Department License$ 2,400
- Site License$ 3,120
- Global License$ 3,795

Search
Thought Leadership and Analyst Meet


Our Clients
Latest Reports
- China Electric Appliance Rental Market (2026-2032) | Trends, Revenue, Growth, Challenges, Size, Value, Outlook, Pricing, Strategy, Insights, Restraints, segmentation, Companies, Investment Opportunities, Analysis, Demand, Drivers, Competition, Forecast, Share
- Chile Electric Appliance Rental Market (2026-2032) | Outlook, Competition, Drivers, Strategy, Revenue, Analysis, Value, Pricing, Restraints, Size, Demand, Share, Growth, Forecast, Challenges, Insights, Investment Opportunities, Companies, Trends, segmentation
- Cambodia Electric Appliance Rental Market (2026-2032) | Companies, Analysis, Restraints, Pricing, Insights, Challenges, Outlook, Strategy, Forecast, Trends, Competition, Value, Revenue, Investment Opportunities, segmentation, Drivers, Size, Demand, Growth, Share
- Brazil Electric Appliance Rental Market (2026-2032) | Revenue, Strategy, Forecast, Companies, segmentation, Competition, Size, Investment Opportunities, Pricing, Restraints, Outlook, Challenges, Analysis, Drivers, Value, Demand, Insights, Trends, Growth, Share
- Bangladesh Electric Appliance Rental Market (2026-2032) | Drivers, Forecast, Investment Opportunities, Strategy, Insights, Demand, Challenges, Outlook, Trends, Competition, Value, Revenue, Size, Pricing, Analysis, Companies, Restraints, segmentation, Share, Growth
- Bahrain Electric Appliance Rental Market (2026-2032) | Outlook, Size, Competition, Restraints, Drivers, Value, Trends, Investment Opportunities, Insights, Forecast, Revenue, Strategy, Growth, Share, Demand, Analysis, Challenges, Companies, segmentation, Pricing
- Azerbaijan Electric Appliance Rental Market (2026-2032) | Trends, Investment Opportunities, Restraints, Insights, Strategy, Competition, Value, Growth, Demand, Drivers, Analysis, Forecast, Size, Share, Outlook, segmentation, Pricing, Challenges, Revenue, Companies
- Australia Electric Appliance Rental Market (2026-2032) | Challenges, Restraints, Forecast, Demand, Size, Competition, Pricing, Investment Opportunities, Revenue, Trends, Drivers, Growth, Outlook, Analysis, Strategy, Value, segmentation, Insights, Companies, Share
- Argentina Electric Appliance Rental Market (2026-2032) | Growth, Trends, Insights, Outlook, Forecast, Size, Drivers, Analysis, Restraints, Challenges, Share, Revenue, Investment Opportunities, Strategy, Demand, Value, Companies, segmentation, Competition, Pricing
- Algeria Electric Appliance Rental Market (2026-2032) | Share, Size, Value, Strategy, Competition, Outlook, Challenges, Companies, Trends, Pricing, Insights, Forecast, Investment Opportunities, Revenue, Growth, Restraints, segmentation, Analysis, Demand, Drivers
Industry Events and Analyst Meet

HIMTEX 2026

India Refining Summit 2026

India EV Show 2026

EV tech India Expo 2026

Auto Tech Asia 2026
Whitepaper
- Middle East & Africa Commercial Security Market Click here to view more.
- Middle East & Africa Fire Safety Systems & Equipment Market Click here to view more.
- GCC Drone Market Click here to view more.
- Middle East Lighting Fixture Market Click here to view more.
- GCC Physical & Perimeter Security Market Click here to view more.
6WResearch In News
- Doha a strategic location for EV manufacturing hub: IPA Qatar
- Demand for luxury TVs surging in the GCC, says Samsung
- Empowering Growth: The Thriving Journey of Bangladesh’s Cable Industry
- Demand for luxury TVs surging in the GCC, says Samsung
- Video call with a traditional healer? Once unthinkable, it’s now common in South Africa
- Intelligent Buildings To Smooth GCC’s Path To Net Zero