Netherlands Pen Nib Market (2026-2032) | Segmentation, Size, Outlook, Revenue, Companies, Growth, Industry, Trends, Share, Analysis, Forecast & Value
Market Forecast By Type (Stainless Nib, Gold Nib), By Application (OEM, Aftermarket) And Competitive Landscape
| Product Code: ETC5101691 | Publication Date: Nov 2023 | Updated Date: Apr 2026 | Product Type: Market Research Report | |
| Publisher: 6Wresearch | Author: Shubham Padhi | No. of Pages: 60 | No. of Figures: 30 | No. of Tables: 5 |
Netherlands Pen Nib Market Size (2020-2030)
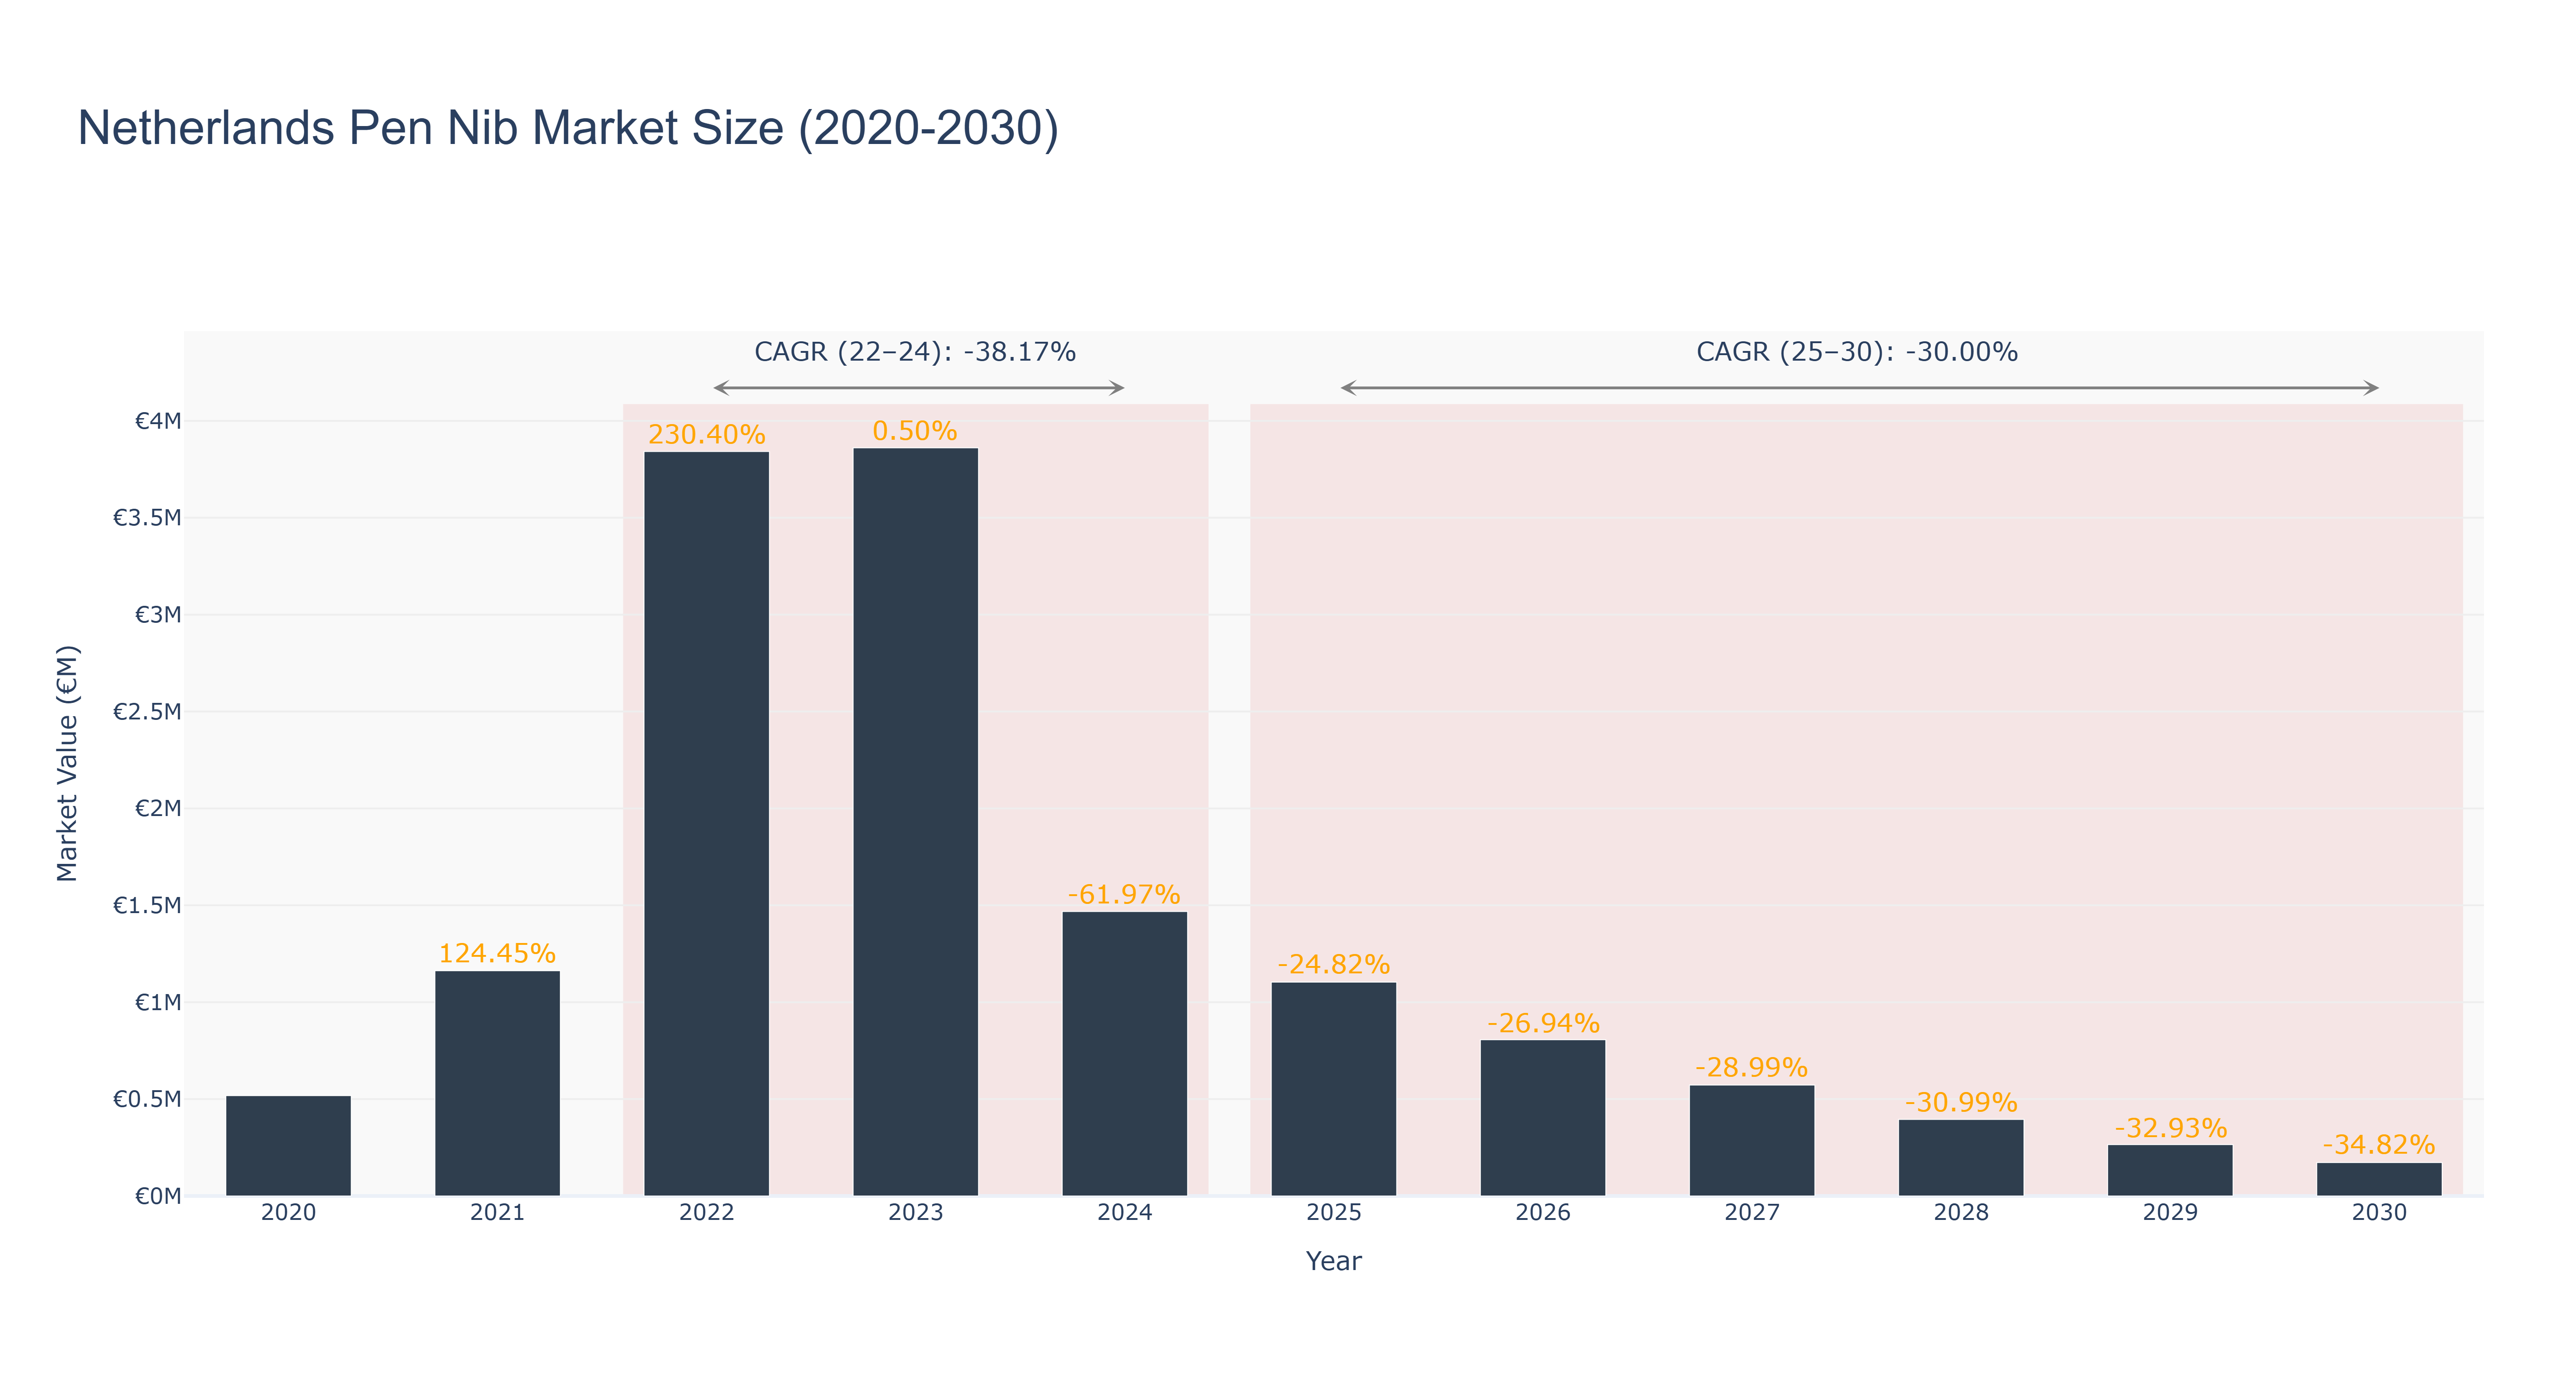
The Netherlands Pen Nib Market experienced a peak market size of €3.86 million in 2023, followed by a significant decline to €1.47 million in 2024. The market continued its downward trend, reaching €0.81 million in 2026. Forecasted market sizes indicate a further decrease to €0.40 million by 2028 and €0.17 million by 2030. The CAGR for the period 2022-2024 was -38.17%, while for 2025-2030, it is projected at -30.0%. The market's decline can be attributed to evolving consumer preferences towards digital writing tools and increased competition from alternative products. To revitalize the market, upcoming initiatives include collaborations with tech companies to integrate smart features into traditional pen nibs, aiming to attract tech-savvy consumers and enhance user experience. Industry drivers for the Netherlands Pen Nib Market include technological advancements, changing consumer behavior, and the growing emphasis on sustainability in product manufacturing.
Netherlands Pen Nib Market: Production & Trade Performance (2019-2025)
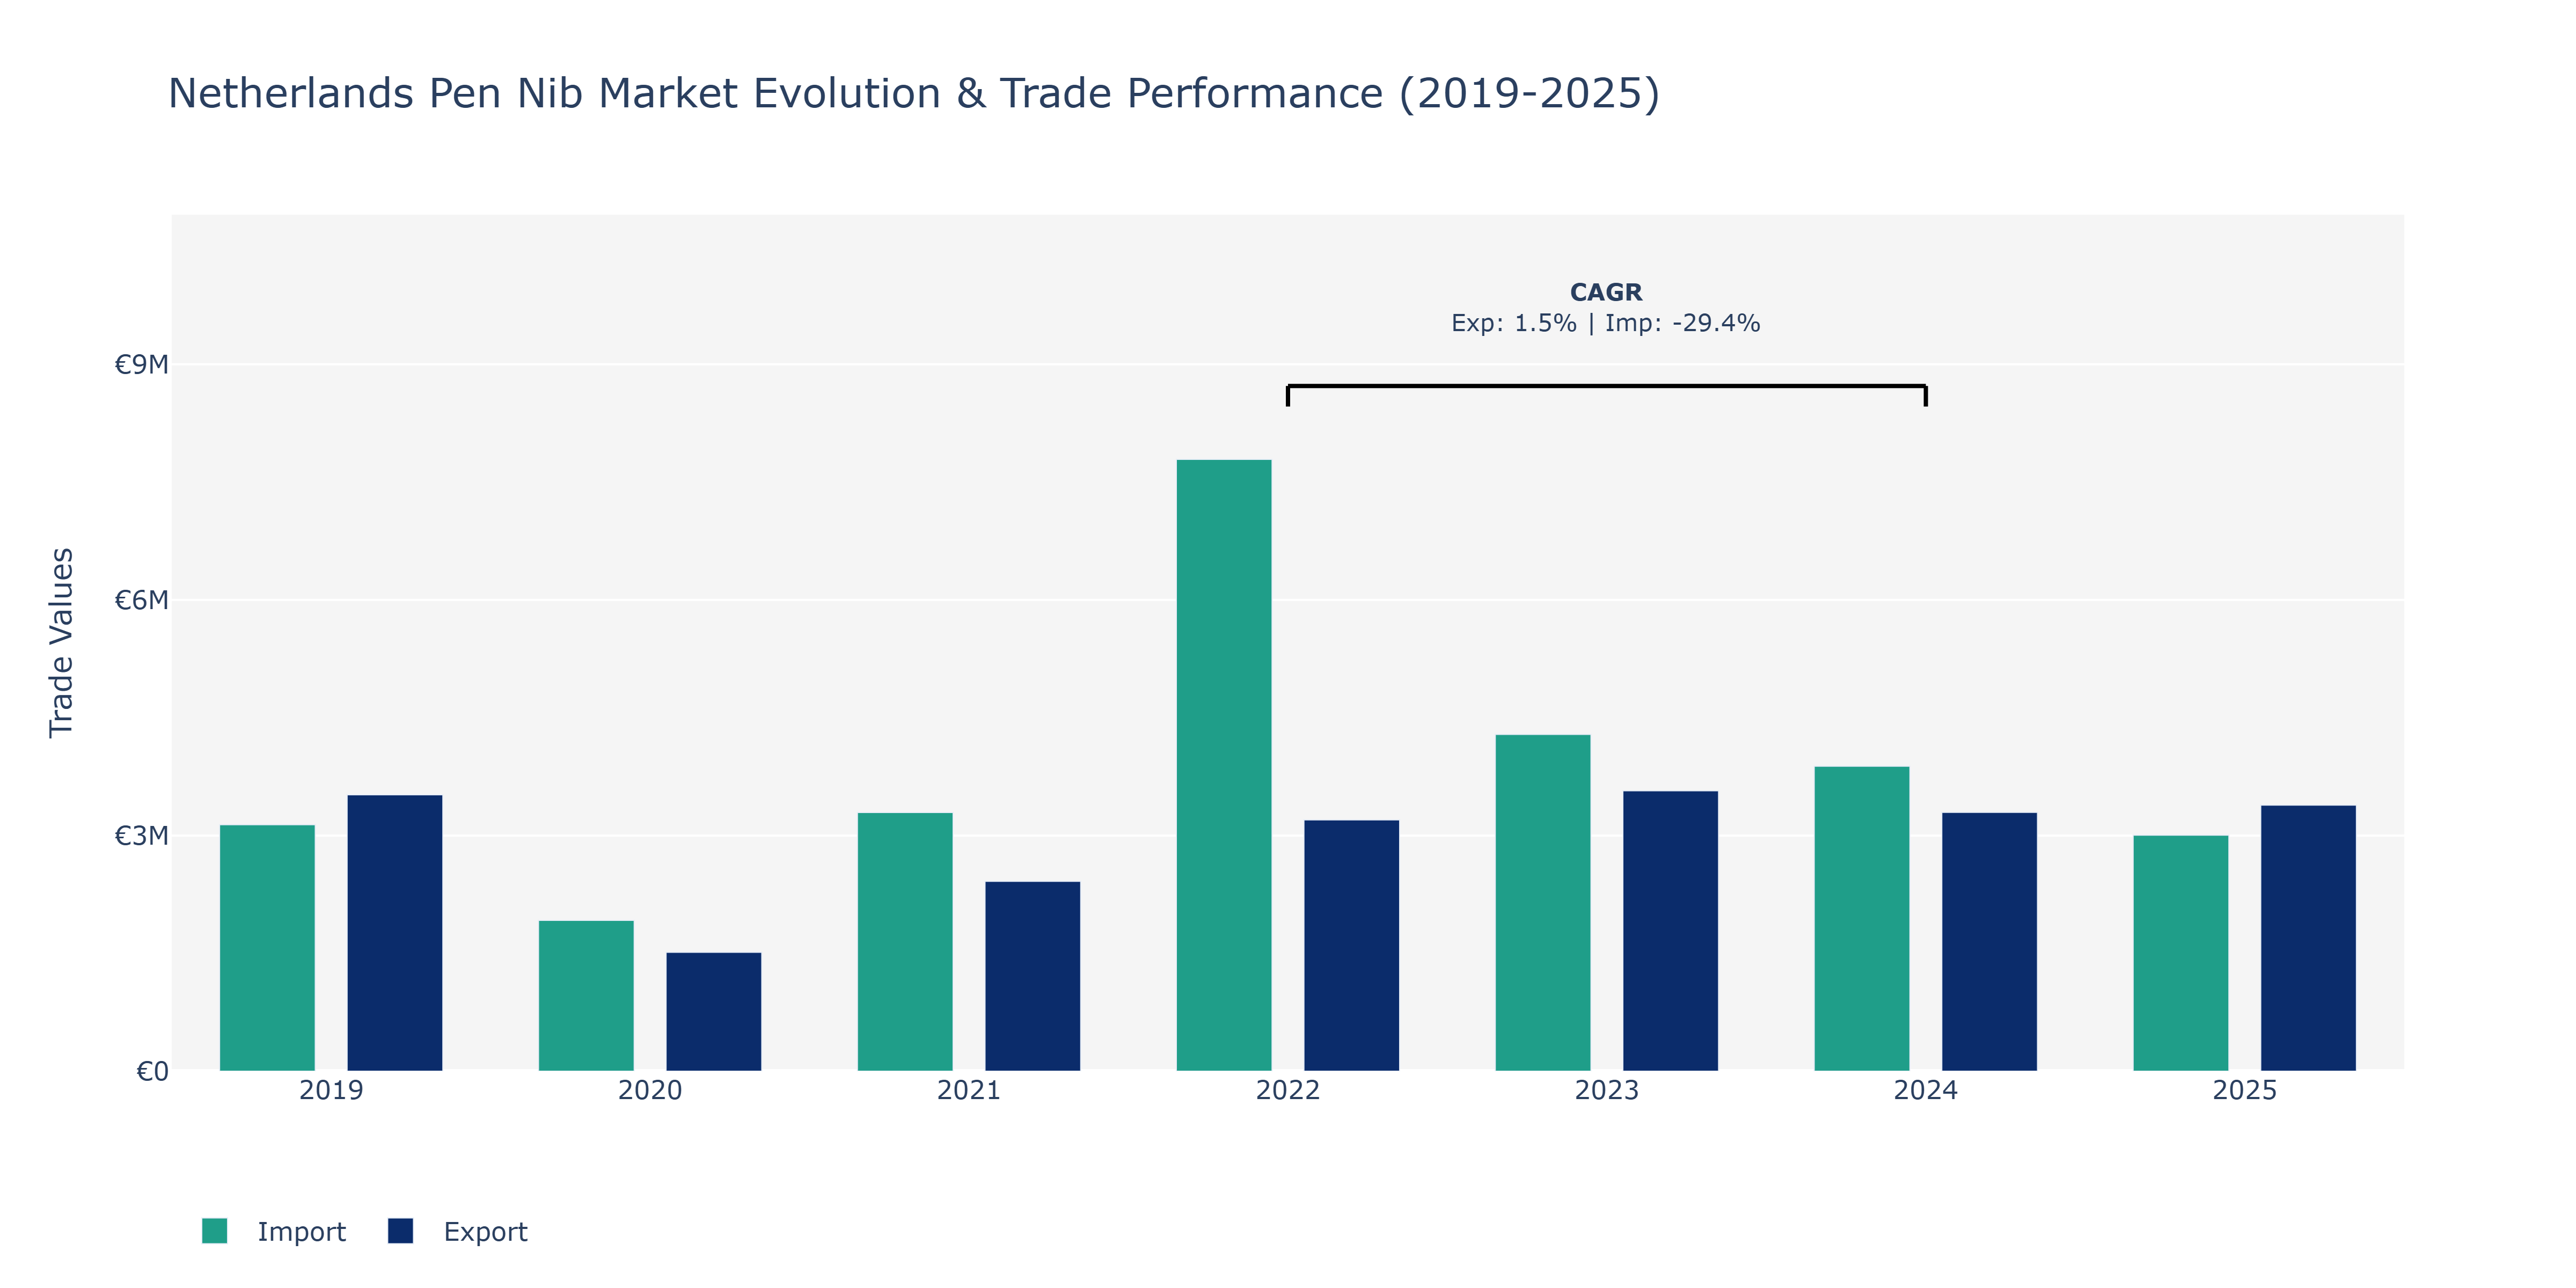
The Netherlands Pen Nib Market witnessed notable fluctuations in both Exports and Imports during the review period. In 2019, Exports stood at €3.52 million and Imports at €3.14 million, showcasing a robust trade volume. However, in 2020, Exports declined to €1.51 million while Imports increased to €1.92 million, indicating a shift in trade dynamics. The following years saw a recovery in both Exports and Imports, with 2022 marking a peak in trade activity at €3.2 million for Exports and €7.79 million for Imports. Despite a slight decrease in 2024 to €3.3 million for Exports and €3.88 million for Imports, the market remained resilient. The fluctuations in Imports, especially the significant decline in 2020 followed by a surge in 2022, could be attributed to global economic conditions impacting demand and supply chain disruptions leading to inventory adjustments. The steady growth in Exports post-2020 reflects the market's adaptability to external factors and its ability to capitalize on emerging opportunities in the pen nib industry.
Key Highlights of the Report:
- Netherlands Pen Nib Market Outlook
- Market Size of Netherlands Pen Nib Market, 2025
- Forecast of Netherlands Pen Nib Market, 2032
- Historical Data and Forecast of Netherlands Pen Nib Revenues & Volume for the Period 2022 - 2032F
- Netherlands Pen Nib Market Trend Evolution
- Netherlands Pen Nib Market Drivers and Challenges
- Netherlands Pen Nib Price Trends
- Netherlands Pen Nib Porter`s Five Forces
- Netherlands Pen Nib Industry Life Cycle
- Historical Data and Forecast of Netherlands Pen Nib Market Revenues & Volume By Type for the Period 2022 - 2032F
- Historical Data and Forecast of Netherlands Pen Nib Market Revenues & Volume By Stainless Nib for the Period 2022 - 2032F
- Historical Data and Forecast of Netherlands Pen Nib Market Revenues & Volume By Gold Nib for the Period 2022 - 2032F
- Historical Data and Forecast of Netherlands Pen Nib Market Revenues & Volume By Application for the Period 2022 - 2032F
- Historical Data and Forecast of Netherlands Pen Nib Market Revenues & Volume By OEM for the Period 2022 - 2032F
- Historical Data and Forecast of Netherlands Pen Nib Market Revenues & Volume By Aftermarket for the Period 2022 - 2032F
- Netherlands Pen Nib Import Export Trade Statistics
- Market Opportunity Assessment By Type
- Market Opportunity Assessment By Application
- Netherlands Pen Nib Top Companies Market Share
- Netherlands Pen Nib Competitive Benchmarking By Technical and Operational Parameters
- Netherlands Pen Nib Company Profiles
- Netherlands Pen Nib Key Strategic Recommendations
Frequently Asked Questions About the Market Study (FAQs):
6Wresearch actively monitors the Netherlands Pen Nib Market and publishes its comprehensive annual report, highlighting emerging trends, growth drivers, revenue analysis, and forecast outlook. Our insights help businesses to make data-backed strategic decisions with ongoing market dynamics. Our analysts track relevent industries related to the Netherlands Pen Nib Market, allowing our clients with actionable intelligence and reliable forecasts tailored to emerging regional needs.
Yes, we provide customisation as per your requirements. To learn more, feel free to contact us on sales@6wresearch.com
1 Executive Summary |
2 Introduction |
2.1 Key Highlights of the Report |
2.2 Report Description |
2.3 Market Scope & Segmentation |
2.4 Research Methodology |
2.5 Assumptions |
3 Netherlands Pen Nib Market Overview |
3.1 Netherlands Country Macro Economic Indicators |
3.2 Netherlands Pen Nib Market Revenues & Volume, 2022 & 2032F |
3.3 Netherlands Pen Nib Market - Industry Life Cycle |
3.4 Netherlands Pen Nib Market - Porter's Five Forces |
3.5 Netherlands Pen Nib Market Revenues & Volume Share, By Type, 2022 & 2032F |
3.6 Netherlands Pen Nib Market Revenues & Volume Share, By Application, 2022 & 2032F |
4 Netherlands Pen Nib Market Dynamics |
4.1 Impact Analysis |
4.2 Market Drivers |
4.2.1 Increasing demand for premium and customized pen nibs in the Netherlands |
4.2.2 Growing popularity of calligraphy and hand-lettering as a hobby |
4.2.3 Technological advancements in pen nib manufacturing leading to innovative products |
4.3 Market Restraints |
4.3.1 Competition from digital writing tools and devices impacting traditional pen nib sales |
4.3.2 Volatility in raw material prices affecting production costs |
4.3.3 Regulatory challenges related to environmental sustainability and product safety |
5 Netherlands Pen Nib Market Trends |
6 Netherlands Pen Nib Market Segmentations |
6.1 Netherlands Pen Nib Market, By Type |
6.1.1 Overview and Analysis |
6.1.2 Netherlands Pen Nib Market Revenues & Volume, By Stainless Nib, 2022 - 2032F |
6.1.3 Netherlands Pen Nib Market Revenues & Volume, By Gold Nib, 2022 - 2032F |
6.2 Netherlands Pen Nib Market, By Application |
6.2.1 Overview and Analysis |
6.2.2 Netherlands Pen Nib Market Revenues & Volume, By OEM, 2022 - 2032F |
6.2.3 Netherlands Pen Nib Market Revenues & Volume, By Aftermarket, 2022 - 2032F |
7 Netherlands Pen Nib Market Import-Export Trade Statistics |
7.1 Netherlands Pen Nib Market Export to Major Countries |
7.2 Netherlands Pen Nib Market Imports from Major Countries |
8 Netherlands Pen Nib Market Key Performance Indicators |
8.1 Average selling price (ASP) of pen nibs in the Netherlands |
8.2 Number of new product launches in the pen nib market |
8.3 Customer satisfaction and retention rates for pen nib manufacturers |
8.4 Innovation index measuring the level of technological advancements in pen nib manufacturing |
8.5 Sustainability metrics such as percentage of recyclable materials used in pen nib production |
9 Netherlands Pen Nib Market - Opportunity Assessment |
9.1 Netherlands Pen Nib Market Opportunity Assessment, By Type, 2022 & 2032F |
9.2 Netherlands Pen Nib Market Opportunity Assessment, By Application, 2022 & 2032F |
10 Netherlands Pen Nib Market - Competitive Landscape |
10.1 Netherlands Pen Nib Market Revenue Share, By Companies, 2025 |
10.2 Netherlands Pen Nib Market Competitive Benchmarking, By Operating and Technical Parameters |
11 Company Profiles |
12 Recommendations | 13 Disclaimer |
Export potential assessment - trade Analytics for 2030
Export potential enables firms to identify high-growth global markets with greater confidence by combining advanced trade intelligence with a structured quantitative methodology. The framework analyzes emerging demand trends and country-level import patterns while integrating macroeconomic and trade datasets such as GDP and population forecasts, bilateral import–export flows, tariff structures, elasticity differentials between developed and developing economies, geographic distance, and import demand projections. Using weighted trade values from 2020–2024 as the base period to project country-to-country export potential for 2030, these inputs are operationalized through calculated drivers such as gravity model parameters, tariff impact factors, and projected GDP per-capita growth. Through an analysis of hidden potentials, demand hotspots, and market conditions that are most favorable to success, this method enables firms to focus on target countries, maximize returns, and global expansion with data, backed by accuracy.
By factoring in the projected importer demand gap that is currently unmet and could be potential opportunity, it identifies the potential for the Exporter (Country) among 190 countries, against the general trade analysis, which identifies the biggest importer or exporter.
To discover high-growth global markets and optimize your business strategy:
Click Here
Pricing
- Single User License$ 1,995
- Department License$ 2,400
- Site License$ 3,120
- Global License$ 3,795

Search
Thought Leadership and Analyst Meet


Our Clients
Latest Reports
- Philippines Polyhydroxybutyrate-co-Hydroxyvalerate Market (2026-2032) | Trends, Insights, Challenges, Restraints, Competition, Size, Value, Forecast, Pricing, Share, Outlook, Revenue, Investment Opportunities, Strategy, Drivers, Demand, Growth, segmentation, Analysis, Companies
- Peru Polyhydroxybutyrate-co-Hydroxyvalerate Market (2026-2032) | Growth, Demand, Challenges, Share, Trends, Analysis, Pricing, Investment Opportunities, Drivers, Value, Forecast, Competition, Size, Companies, Insights, Outlook, Restraints, segmentation, Revenue, Strategy
- Pakistan Polyhydroxybutyrate-co-Hydroxyvalerate Market (2026-2032) | Restraints, segmentation, Pricing, Forecast, Share, Strategy, Competition, Trends, Insights, Drivers, Challenges, Growth, Revenue, Outlook, Value, Investment Opportunities, Companies, Size, Analysis, Demand
- Oman Polyhydroxybutyrate-co-Hydroxyvalerate Market (2026-2032) | Drivers, segmentation, Insights, Competition, Pricing, Outlook, Size, Revenue, Challenges, Forecast, Analysis, Growth, Value, Share, Trends, Investment Opportunities, Strategy, Restraints, Companies, Demand
- Nigeria Polyhydroxybutyrate-co-Hydroxyvalerate Market (2026-2032) | Value, Investment Opportunities, Analysis, Revenue, Restraints, Pricing, Outlook, Competition, Demand, Growth, Forecast, Companies, Trends, Challenges, segmentation, Drivers, Insights, Share, Size, Strategy
- Nepal Polyhydroxybutyrate-co-Hydroxyvalerate Market (2026-2032) | Insights, Analysis, Drivers, Share, Revenue, Demand, segmentation, Investment Opportunities, Competition, Forecast, Growth, Pricing, Companies, Strategy, Trends, Restraints, Challenges, Outlook, Size, Value
- Myanmar Polyhydroxybutyrate-co-Hydroxyvalerate Market (2026-2032) | Outlook, Revenue, Strategy, Restraints, Drivers, segmentation, Share, Forecast, Competition, Insights, Growth, Pricing, Size, Demand, Value, Companies, Trends, Challenges, Investment Opportunities, Analysis
- Morocco Polyhydroxybutyrate-co-Hydroxyvalerate Market (2026-2032) | Outlook, Investment Opportunities, Restraints, Strategy, Forecast, Challenges, Drivers, Growth, Companies, segmentation, Trends, Size, Competition, Revenue, Demand, Insights, Share, Analysis, Value, Pricing
- Mexico Polyhydroxybutyrate-co-Hydroxyvalerate Market (2026-2032) | Size, Drivers, Outlook, Share, Strategy, Growth, Pricing, Challenges, Companies, Demand, Value, Investment Opportunities, Restraints, Trends, Forecast, segmentation, Analysis, Insights, Competition, Revenue
- Malaysia Polyhydroxybutyrate-co-Hydroxyvalerate Market (2026-2032) | Share, segmentation, Size, Companies, Analysis, Insights, Forecast, Value, Revenue, Drivers, Restraints, Challenges, Investment Opportunities, Trends, Competition, Strategy, Demand, Growth, Outlook, Pricing
Industry Events and Analyst Meet

HIMTEX 2026

India Refining Summit 2026

India EV Show 2026

EV tech India Expo 2026

Auto Tech Asia 2026
Whitepaper
- Middle East & Africa Commercial Security Market Click here to view more.
- Middle East & Africa Fire Safety Systems & Equipment Market Click here to view more.
- GCC Drone Market Click here to view more.
- Middle East Lighting Fixture Market Click here to view more.
- GCC Physical & Perimeter Security Market Click here to view more.
6WResearch In News
- Doha a strategic location for EV manufacturing hub: IPA Qatar
- Demand for luxury TVs surging in the GCC, says Samsung
- Empowering Growth: The Thriving Journey of Bangladesh’s Cable Industry
- Demand for luxury TVs surging in the GCC, says Samsung
- Video call with a traditional healer? Once unthinkable, it’s now common in South Africa
- Intelligent Buildings To Smooth GCC’s Path To Net Zero