Netherlands Propionic acid Market (2026-2032) | Forecast, Size, Companies, Growth, Share, Analysis, Revenue, Outlook, Segmentation, Trends, Value & Industry
Market Forecast By Application (Herbicides, Rubber Products, Plasticizers, Food Preservatives, Others), By End use Industry (Pharmaceuticals, Personal Care, Food & Beverage, Agriculture, Others) And Competitive Landscape
| Product Code: ETC4746315 | Publication Date: Nov 2023 | Updated Date: Apr 2026 | Product Type: Market Research Report | |
| Publisher: 6Wresearch | Author: Sachin Kumar Rai | No. of Pages: 60 | No. of Figures: 30 | No. of Tables: 5 |
Netherlands Propionic Acid Market Size (2020-2030)
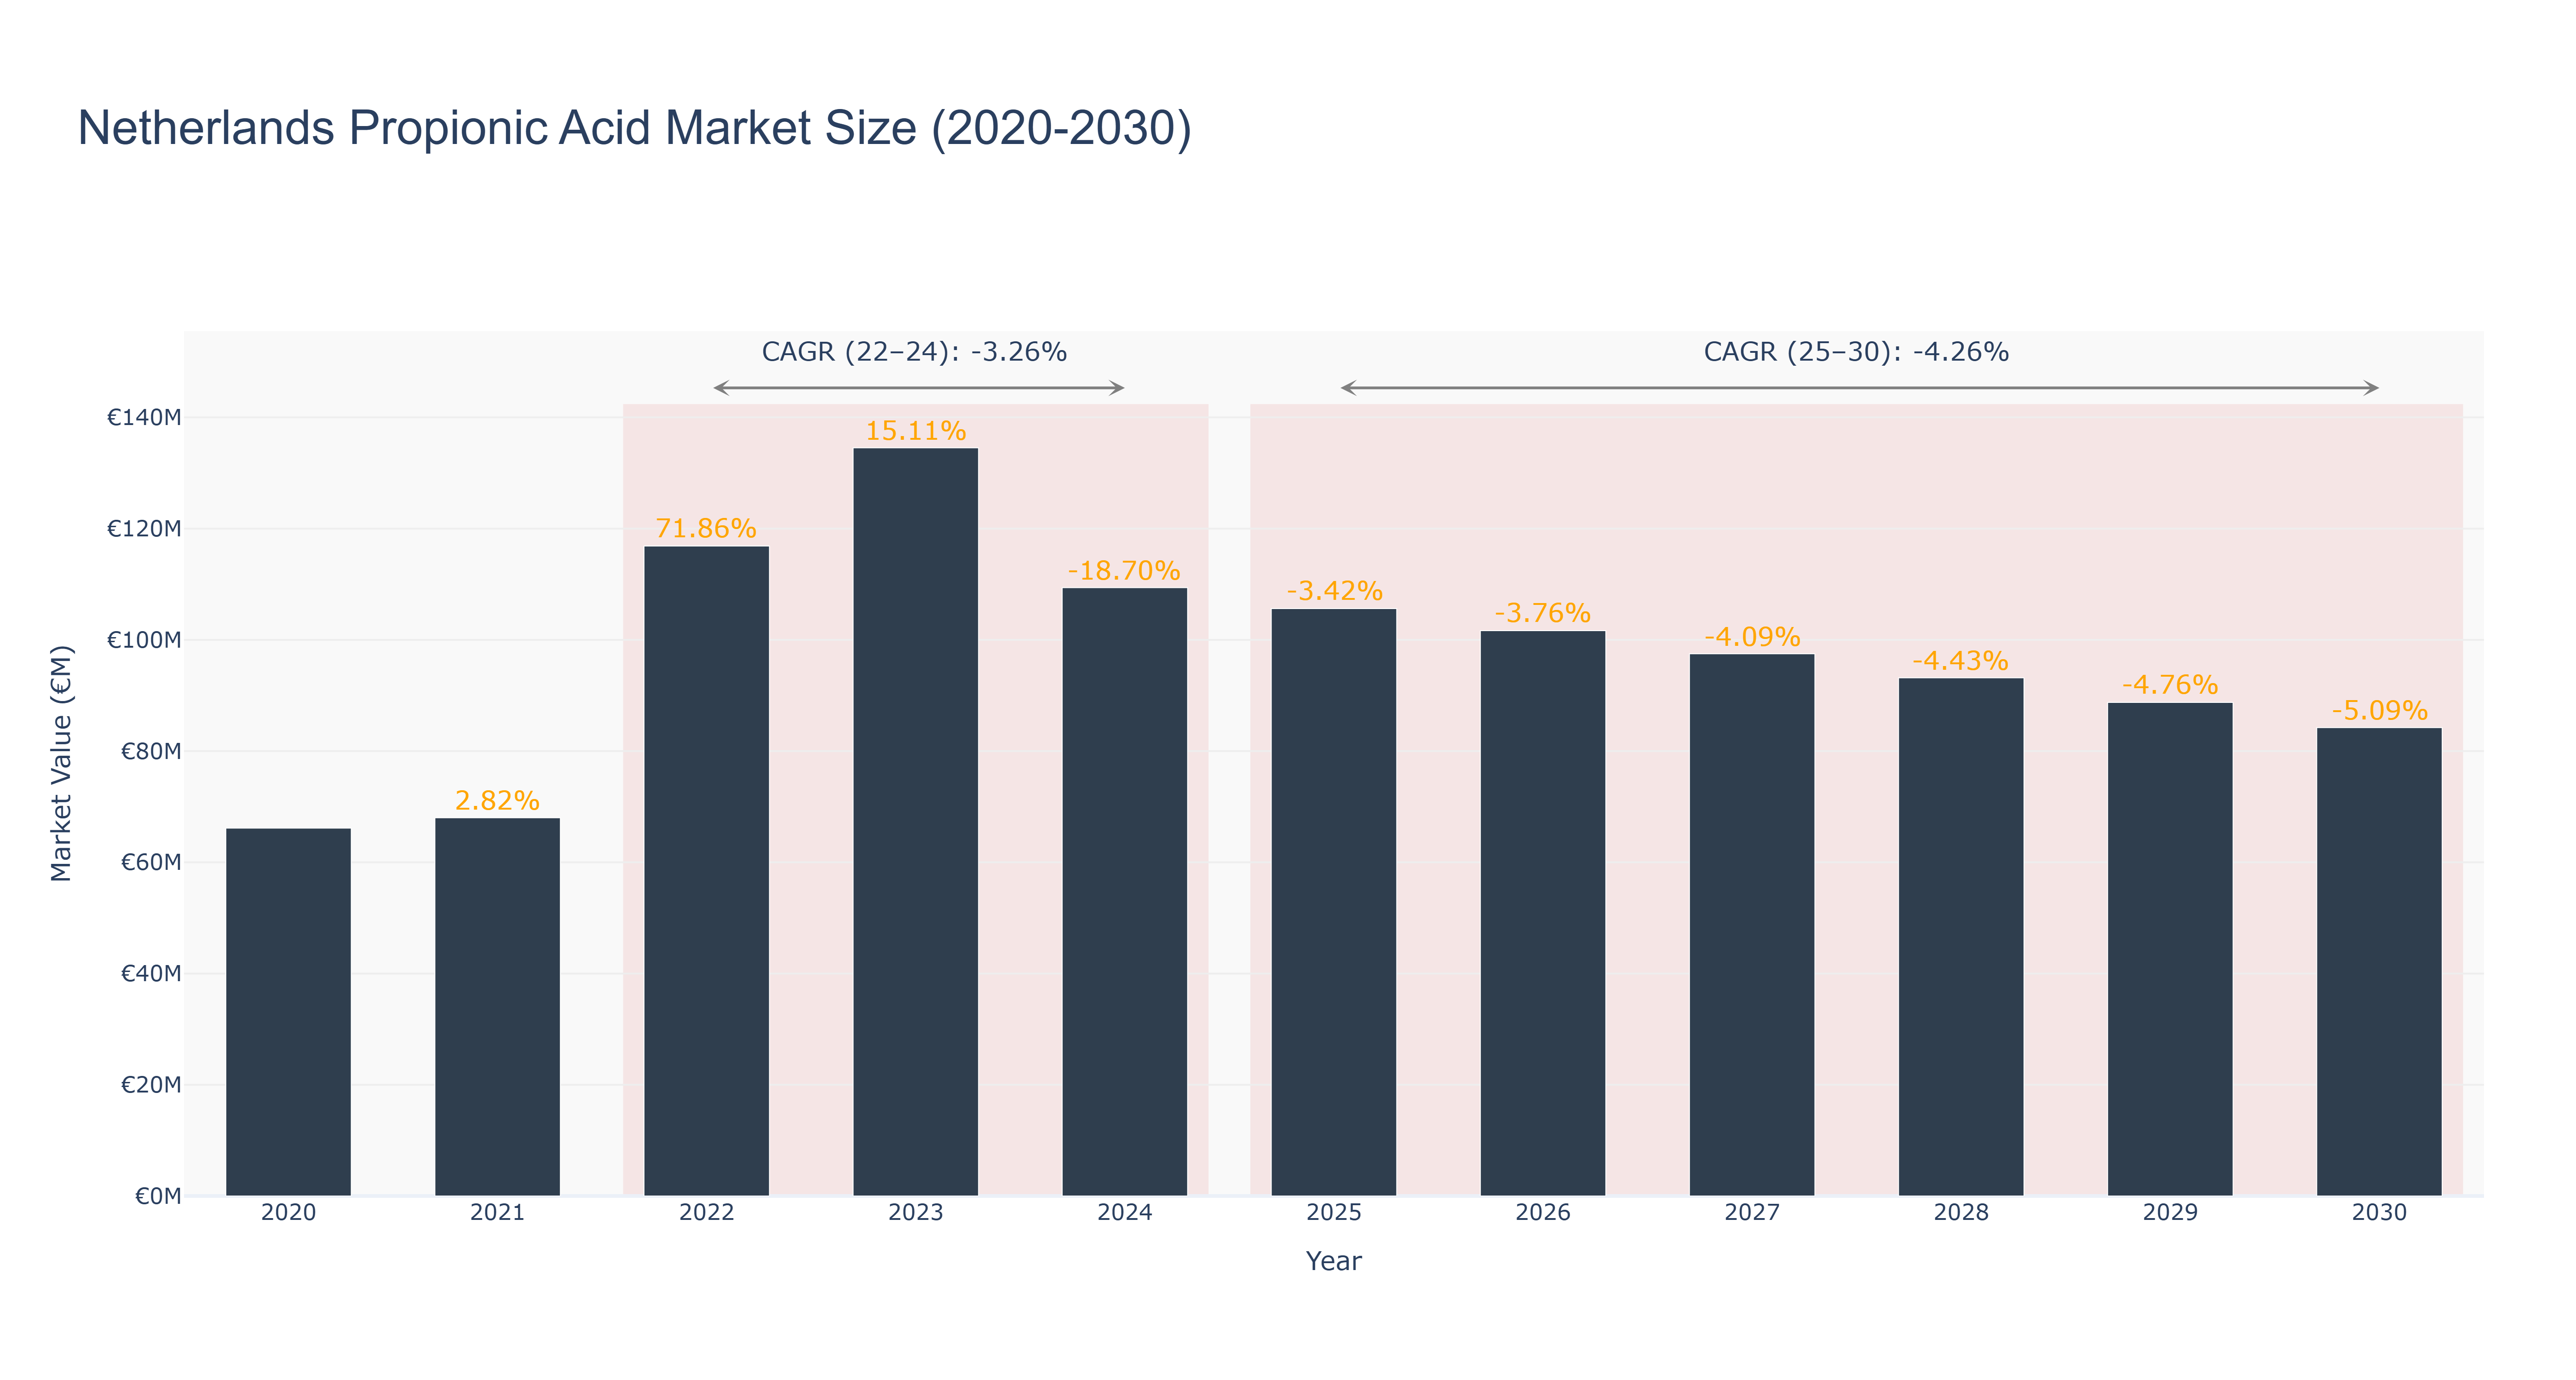
The Netherlands Propionic Acid Market experienced significant fluctuations from 2020 to 2024, with a peak market size of €116.88 million in 2022, reflecting an impressive growth rate of 71.86% compared to the previous year. However, the subsequent period saw a decline, with actual market size dropping to €109.38 million in 2024, resulting in a compound annual growth rate (CAGR) of -3.26% for the 2022-2024 timeframe. The forecasted period from 2025 to 2030 anticipates continued contraction, with projected market sizes decreasing from €105.63 million in 2025 to €84.23 million by 2030, reflecting a CAGR of -4.26%. This downturn may be attributed to factors such as increased competition, regulatory challenges, and potential shifts in demand for alternative preservatives. As the market adjusts, stakeholders should closely monitor macroeconomic trends and innovations in propionic acid applications that could influence future recovery.
Netherlands Propionic Acid Market: Production & Trade Performance (2019-2025)
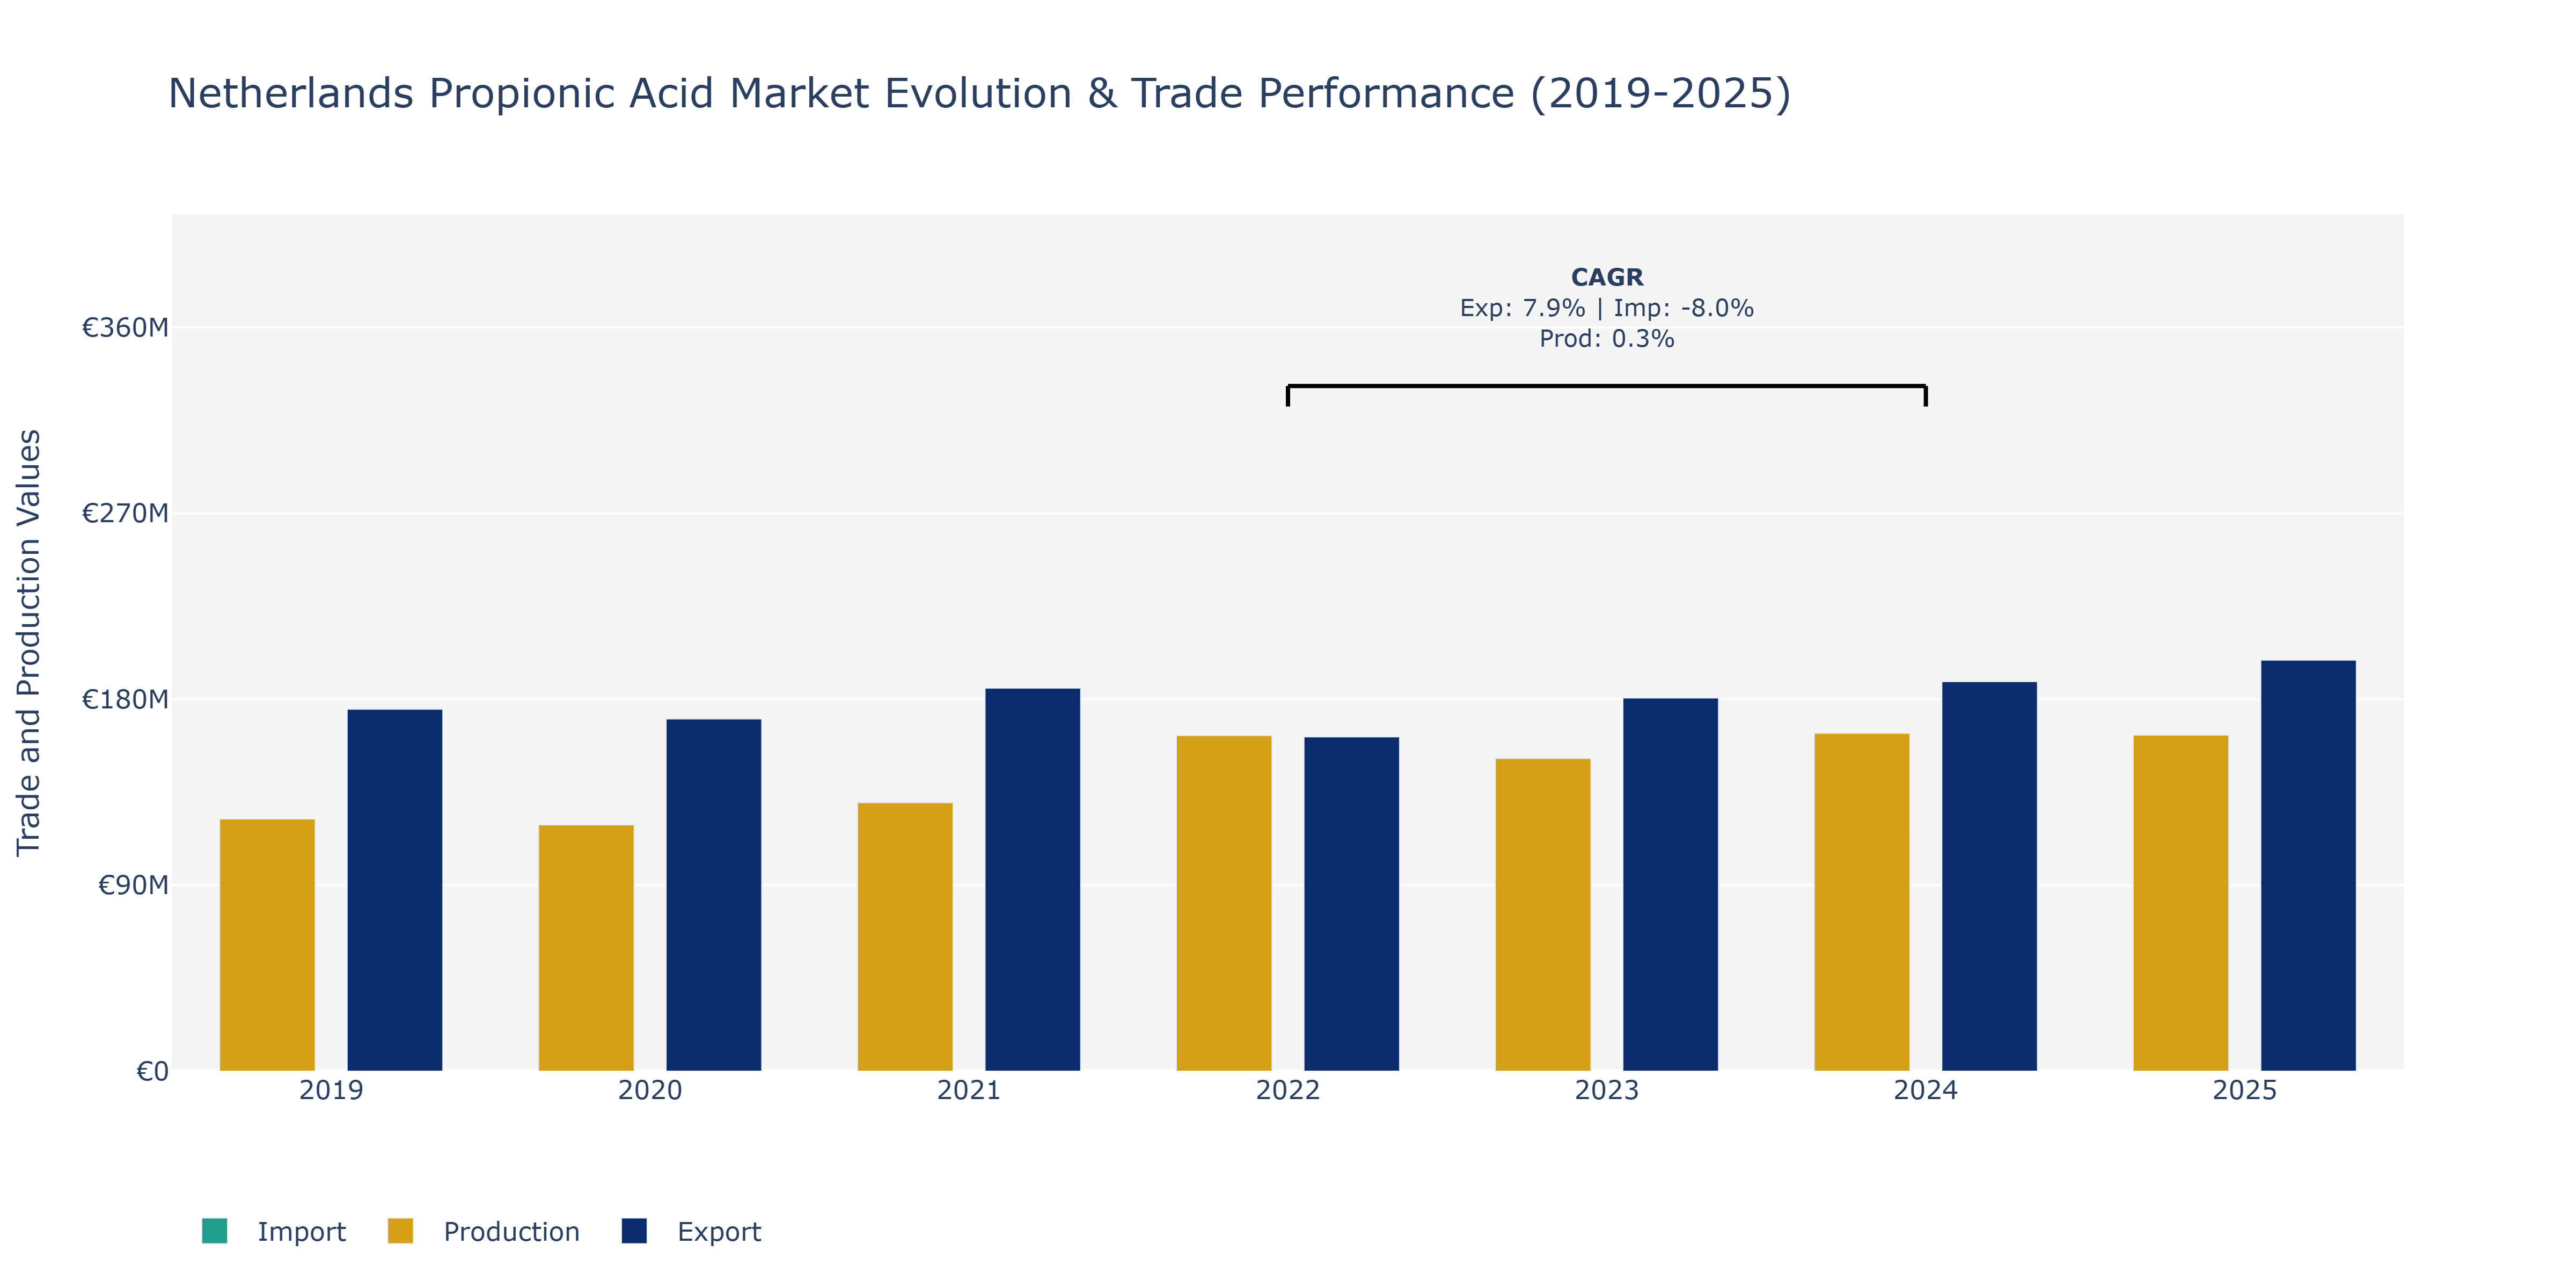
The Netherlands Propionic Acid Market witnessed fluctuations in Exports, Imports, and Production from 2019 to 2025. Exports saw a peak in 2025 at approximately €199 million, showcasing a steady growth trend over the years despite minor declines in 2020 and 2022. On the other hand, Imports fluctuated, with the highest value in 2022 at around €133.63 million and the lowest in 2020 at about €95 million. Production levels peaked in 2024 at €163.5 million, with a slight increase from 2019. The rise in Exports can be attributed to increased global demand for propionic acid, driven by its extensive application in food preservation and animal feed. The fluctuating Imports may reflect changing domestic consumption patterns or regulatory shifts affecting trade volumes. The marginal Production growth aligns with the modest CAGR of 0.33%, indicating stable local manufacturing capabilities. These trends suggest a dynamic market influenced by both domestic and international factors, emphasizing the need for strategic market positioning and supply chain management to leverage growth opportunities in the propionic acid sector.
Key Highlights of the Report:
- Netherlands Propionic acid Market Outlook
- Market Size of Netherlands Propionic acid Market, 2025
- Forecast of Netherlands Propionic acid Market, 2032
- Historical Data and Forecast of Netherlands Propionic acid Revenues & Volume for the Period 2022 - 2032F
- Netherlands Propionic acid Market Trend Evolution
- Netherlands Propionic acid Market Drivers and Challenges
- Netherlands Propionic acid Price Trends
- Netherlands Propionic acid Porter`s Five Forces
- Netherlands Propionic acid Industry Life Cycle
- Historical Data and Forecast of Netherlands Propionic acid Market Revenues & Volume By Application for the Period 2022 - 2032F
- Historical Data and Forecast of Netherlands Propionic acid Market Revenues & Volume By Herbicides for the Period 2022 - 2032F
- Historical Data and Forecast of Netherlands Propionic acid Market Revenues & Volume By Rubber Products for the Period 2022 - 2032F
- Historical Data and Forecast of Netherlands Propionic acid Market Revenues & Volume By Plasticizers for the Period 2022 - 2032F
- Historical Data and Forecast of Netherlands Propionic acid Market Revenues & Volume By Food Preservatives for the Period 2022 - 2032F
- Historical Data and Forecast of Netherlands Propionic acid Market Revenues & Volume By Others for the Period 2022 - 2032F
- Historical Data and Forecast of Netherlands Propionic acid Market Revenues & Volume By End use Industry for the Period 2022 - 2032F
- Historical Data and Forecast of Netherlands Propionic acid Market Revenues & Volume By Pharmaceuticals for the Period 2022 - 2032F
- Historical Data and Forecast of Netherlands Propionic acid Market Revenues & Volume By Personal Care for the Period 2022 - 2032F
- Historical Data and Forecast of Netherlands Propionic acid Market Revenues & Volume By Food & Beverage for the Period 2022 - 2032F
- Historical Data and Forecast of Netherlands Propionic acid Market Revenues & Volume By Agriculture for the Period 2022 - 2032F
- Historical Data and Forecast of Netherlands Propionic acid Market Revenues & Volume By Others for the Period 2022 - 2032F
- Netherlands Propionic acid Import Export Trade Statistics
- Market Opportunity Assessment By Application
- Market Opportunity Assessment By End use Industry
- Netherlands Propionic acid Top Companies Market Share
- Netherlands Propionic acid Competitive Benchmarking By Technical and Operational Parameters
- Netherlands Propionic acid Company Profiles
- Netherlands Propionic acid Key Strategic Recommendations
Frequently Asked Questions About the Market Study (FAQs):
6Wresearch actively monitors the Netherlands Propionic acid Market and publishes its comprehensive annual report, highlighting emerging trends, growth drivers, revenue analysis, and forecast outlook. Our insights help businesses to make data-backed strategic decisions with ongoing market dynamics. Our analysts track relevent industries related to the Netherlands Propionic acid Market, allowing our clients with actionable intelligence and reliable forecasts tailored to emerging regional needs.
Yes, we provide customisation as per your requirements. To learn more, feel free to contact us on sales@6wresearch.com
1 Executive Summary |
2 Introduction |
2.1 Key Highlights of the Report |
2.2 Report Description |
2.3 Market Scope & Segmentation |
2.4 Research Methodology |
2.5 Assumptions |
3 Netherlands Propionic acid Market Overview |
3.1 Netherlands Country Macro Economic Indicators |
3.2 Netherlands Propionic acid Market Revenues & Volume, 2022 & 2032F |
3.3 Netherlands Propionic acid Market - Industry Life Cycle |
3.4 Netherlands Propionic acid Market - Porter's Five Forces |
3.5 Netherlands Propionic acid Market Revenues & Volume Share, By Application, 2022 & 2032F |
3.6 Netherlands Propionic acid Market Revenues & Volume Share, By End use Industry, 2022 & 2032F |
4 Netherlands Propionic acid Market Dynamics |
4.1 Impact Analysis |
4.2 Market Drivers |
4.2.1 Increasing demand for propionic acid in food and feed preservation industries. |
4.2.2 Growing awareness regarding the benefits of propionic acid in animal nutrition. |
4.2.3 Rising adoption of propionic acid as a mold inhibitor in bakery products. |
4.3 Market Restraints |
4.3.1 Fluctuating prices of raw materials used in propionic acid production. |
4.3.2 Stringent regulations related to the usage of propionic acid in food products. |
5 Netherlands Propionic acid Market Trends |
6 Netherlands Propionic acid Market Segmentations |
6.1 Netherlands Propionic acid Market, By Application |
6.1.1 Overview and Analysis |
6.1.2 Netherlands Propionic acid Market Revenues & Volume, By Herbicides, 2022 - 2032F |
6.1.3 Netherlands Propionic acid Market Revenues & Volume, By Rubber Products, 2022 - 2032F |
6.1.4 Netherlands Propionic acid Market Revenues & Volume, By Plasticizers, 2022 - 2032F |
6.1.5 Netherlands Propionic acid Market Revenues & Volume, By Food Preservatives, 2022 - 2032F |
6.1.6 Netherlands Propionic acid Market Revenues & Volume, By Others, 2022 - 2032F |
6.2 Netherlands Propionic acid Market, By End use Industry |
6.2.1 Overview and Analysis |
6.2.2 Netherlands Propionic acid Market Revenues & Volume, By Pharmaceuticals, 2022 - 2032F |
6.2.3 Netherlands Propionic acid Market Revenues & Volume, By Personal Care, 2022 - 2032F |
6.2.4 Netherlands Propionic acid Market Revenues & Volume, By Food & Beverage, 2022 - 2032F |
6.2.5 Netherlands Propionic acid Market Revenues & Volume, By Agriculture, 2022 - 2032F |
6.2.6 Netherlands Propionic acid Market Revenues & Volume, By Others, 2022 - 2032F |
7 Netherlands Propionic acid Market Import-Export Trade Statistics |
7.1 Netherlands Propionic acid Market Export to Major Countries |
7.2 Netherlands Propionic acid Market Imports from Major Countries |
8 Netherlands Propionic acid Market Key Performance Indicators |
8.1 Percentage of market share held by propionic acid in the food preservation industry. |
8.2 Number of new product launches containing propionic acid in the feed industry. |
8.3 Growth rate of research and development investments in propionic acid applications. |
9 Netherlands Propionic acid Market - Opportunity Assessment |
9.1 Netherlands Propionic acid Market Opportunity Assessment, By Application, 2022 & 2032F |
9.2 Netherlands Propionic acid Market Opportunity Assessment, By End use Industry, 2022 & 2032F |
10 Netherlands Propionic acid Market - Competitive Landscape |
10.1 Netherlands Propionic acid Market Revenue Share, By Companies, 2025 |
10.2 Netherlands Propionic acid Market Competitive Benchmarking, By Operating and Technical Parameters |
11 Company Profiles |
12 Recommendations | 13 Disclaimer |
Export potential assessment - trade Analytics for 2030
Export potential enables firms to identify high-growth global markets with greater confidence by combining advanced trade intelligence with a structured quantitative methodology. The framework analyzes emerging demand trends and country-level import patterns while integrating macroeconomic and trade datasets such as GDP and population forecasts, bilateral import–export flows, tariff structures, elasticity differentials between developed and developing economies, geographic distance, and import demand projections. Using weighted trade values from 2020–2024 as the base period to project country-to-country export potential for 2030, these inputs are operationalized through calculated drivers such as gravity model parameters, tariff impact factors, and projected GDP per-capita growth. Through an analysis of hidden potentials, demand hotspots, and market conditions that are most favorable to success, this method enables firms to focus on target countries, maximize returns, and global expansion with data, backed by accuracy.
By factoring in the projected importer demand gap that is currently unmet and could be potential opportunity, it identifies the potential for the Exporter (Country) among 190 countries, against the general trade analysis, which identifies the biggest importer or exporter.
To discover high-growth global markets and optimize your business strategy:
Click Here
Pricing
- Single User License$ 1,995
- Department License$ 2,400
- Site License$ 3,120
- Global License$ 3,795

Search
Thought Leadership and Analyst Meet


Our Clients
Latest Reports
- Philippines Polyhydroxybutyrate-co-Hydroxyvalerate Market (2026-2032) | Trends, Insights, Challenges, Restraints, Competition, Size, Value, Forecast, Pricing, Share, Outlook, Revenue, Investment Opportunities, Strategy, Drivers, Demand, Growth, segmentation, Analysis, Companies
- Peru Polyhydroxybutyrate-co-Hydroxyvalerate Market (2026-2032) | Growth, Demand, Challenges, Share, Trends, Analysis, Pricing, Investment Opportunities, Drivers, Value, Forecast, Competition, Size, Companies, Insights, Outlook, Restraints, segmentation, Revenue, Strategy
- Pakistan Polyhydroxybutyrate-co-Hydroxyvalerate Market (2026-2032) | Restraints, segmentation, Pricing, Forecast, Share, Strategy, Competition, Trends, Insights, Drivers, Challenges, Growth, Revenue, Outlook, Value, Investment Opportunities, Companies, Size, Analysis, Demand
- Oman Polyhydroxybutyrate-co-Hydroxyvalerate Market (2026-2032) | Drivers, segmentation, Insights, Competition, Pricing, Outlook, Size, Revenue, Challenges, Forecast, Analysis, Growth, Value, Share, Trends, Investment Opportunities, Strategy, Restraints, Companies, Demand
- Nigeria Polyhydroxybutyrate-co-Hydroxyvalerate Market (2026-2032) | Value, Investment Opportunities, Analysis, Revenue, Restraints, Pricing, Outlook, Competition, Demand, Growth, Forecast, Companies, Trends, Challenges, segmentation, Drivers, Insights, Share, Size, Strategy
- Nepal Polyhydroxybutyrate-co-Hydroxyvalerate Market (2026-2032) | Insights, Analysis, Drivers, Share, Revenue, Demand, segmentation, Investment Opportunities, Competition, Forecast, Growth, Pricing, Companies, Strategy, Trends, Restraints, Challenges, Outlook, Size, Value
- Myanmar Polyhydroxybutyrate-co-Hydroxyvalerate Market (2026-2032) | Outlook, Revenue, Strategy, Restraints, Drivers, segmentation, Share, Forecast, Competition, Insights, Growth, Pricing, Size, Demand, Value, Companies, Trends, Challenges, Investment Opportunities, Analysis
- Morocco Polyhydroxybutyrate-co-Hydroxyvalerate Market (2026-2032) | Outlook, Investment Opportunities, Restraints, Strategy, Forecast, Challenges, Drivers, Growth, Companies, segmentation, Trends, Size, Competition, Revenue, Demand, Insights, Share, Analysis, Value, Pricing
- Mexico Polyhydroxybutyrate-co-Hydroxyvalerate Market (2026-2032) | Size, Drivers, Outlook, Share, Strategy, Growth, Pricing, Challenges, Companies, Demand, Value, Investment Opportunities, Restraints, Trends, Forecast, segmentation, Analysis, Insights, Competition, Revenue
- Malaysia Polyhydroxybutyrate-co-Hydroxyvalerate Market (2026-2032) | Share, segmentation, Size, Companies, Analysis, Insights, Forecast, Value, Revenue, Drivers, Restraints, Challenges, Investment Opportunities, Trends, Competition, Strategy, Demand, Growth, Outlook, Pricing
Industry Events and Analyst Meet

HIMTEX 2026

India Refining Summit 2026

India EV Show 2026

EV tech India Expo 2026

Auto Tech Asia 2026
Whitepaper
- Middle East & Africa Commercial Security Market Click here to view more.
- Middle East & Africa Fire Safety Systems & Equipment Market Click here to view more.
- GCC Drone Market Click here to view more.
- Middle East Lighting Fixture Market Click here to view more.
- GCC Physical & Perimeter Security Market Click here to view more.
6WResearch In News
- Doha a strategic location for EV manufacturing hub: IPA Qatar
- Demand for luxury TVs surging in the GCC, says Samsung
- Empowering Growth: The Thriving Journey of Bangladesh’s Cable Industry
- Demand for luxury TVs surging in the GCC, says Samsung
- Video call with a traditional healer? Once unthinkable, it’s now common in South Africa
- Intelligent Buildings To Smooth GCC’s Path To Net Zero