Netherlands Rugged Servers Market (2026-2032) | Analysis, Segmentation, Companies, Forecast, Revenue, Industry, Share, Outlook, Trends, Value, Growth & Size
Market Forecast By Offering (Hardware, Software & Services), By Type (Dedicated, Standard), By Application (Military & Aerospace, Telecommunication, Industrial, Energy & Power, Marine), By Memory Size (<256 GB, 256 GB†™512 GB, >512 GB†™1 TB, >1TB) And Competitive Landscape
| Product Code: ETC5612791 | Publication Date: Nov 2023 | Updated Date: Mar 2026 | Product Type: Market Research Report | |
| Publisher: 6Wresearch | Author: Ravi Bhandari | No. of Pages: 60 | No. of Figures: 30 | No. of Tables: 5 |
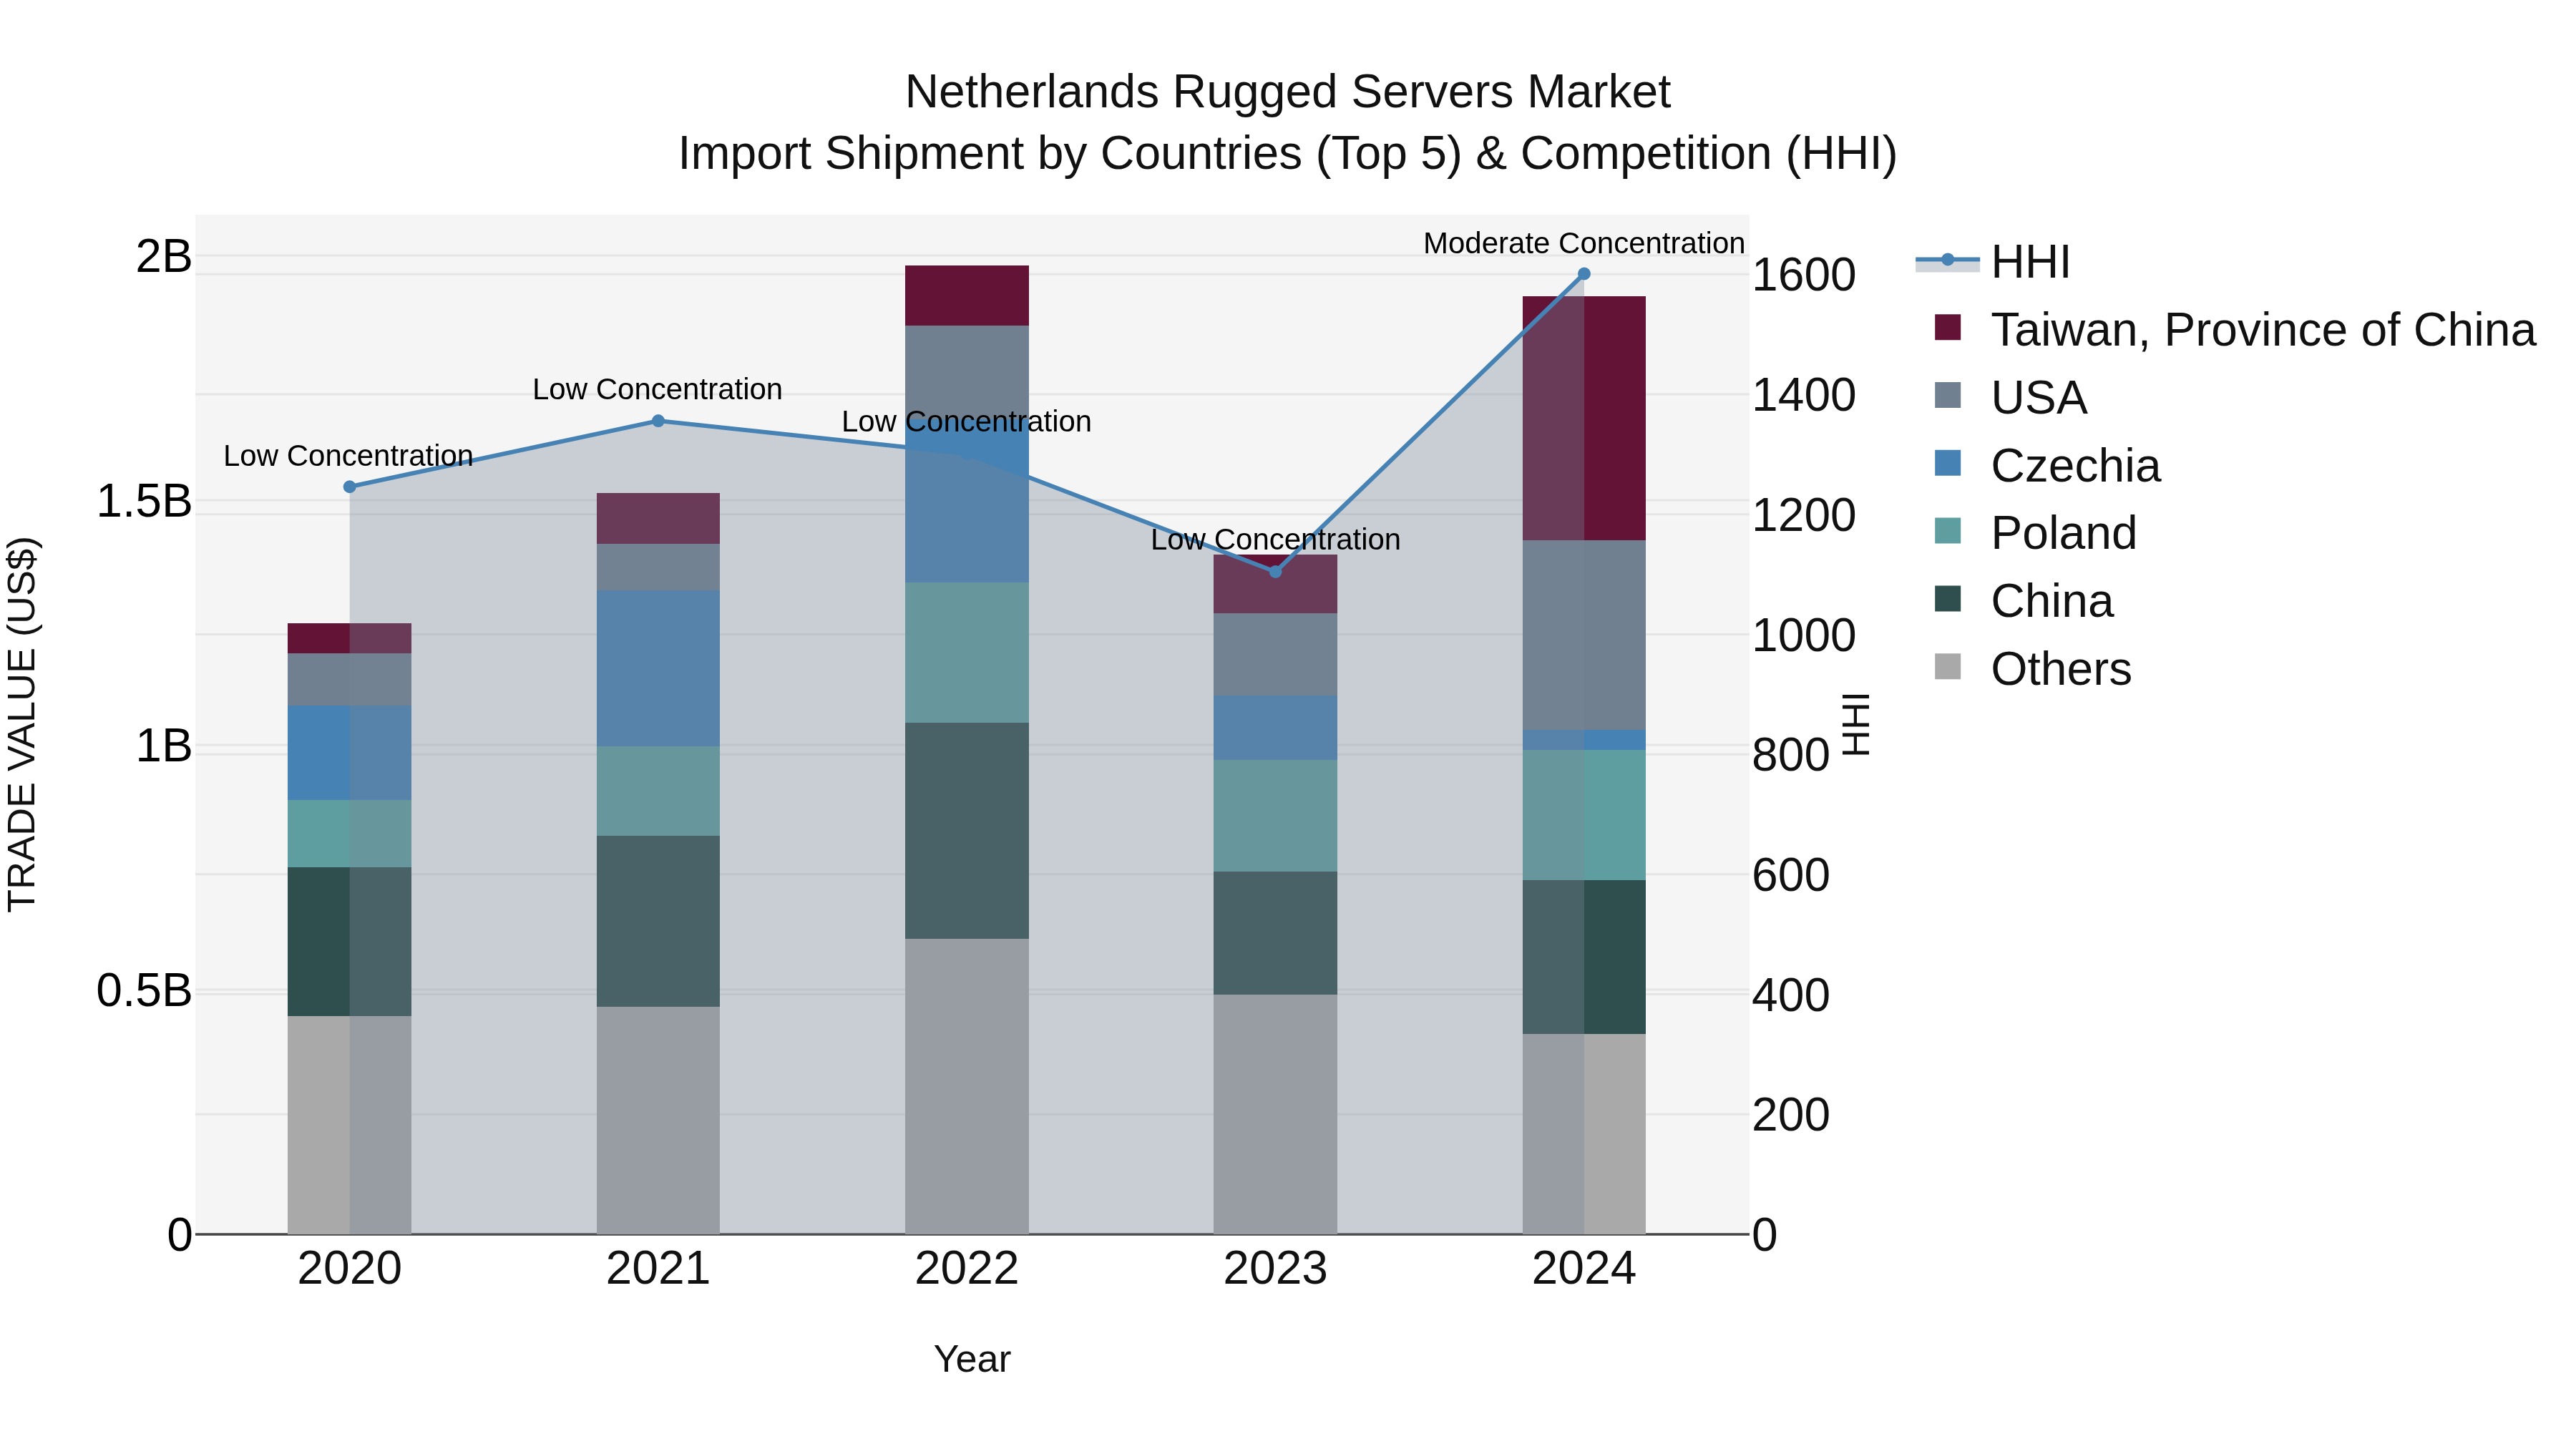
Netherlands Rugged Servers Market Top 5 Importing Countries and Market Competition (HHI) Analysis
The Netherlands saw a significant increase in rugged servers import shipments in 2024, with top exporting countries being Taiwan, USA, China, Poland, and Hungary. The market experienced a shift from low to moderate concentration, indicating a more competitive landscape. The compound annual growth rate (CAGR) for the period 2020-2024 was a promising 11.33%, with a notable growth rate of 38.09% from 2023 to 2024. This data suggests a growing demand for rugged servers in the Netherlands, presenting opportunities for market expansion and innovation.
Key Highlights of the Report:
- Netherlands Rugged Servers Market Outlook
- Market Size of Netherlands Rugged Servers Market, 2025
- Forecast of Netherlands Rugged Servers Market, 2032
- Historical Data and Forecast of Netherlands Rugged Servers Revenues & Volume for the Period 2022 - 2032F
- Netherlands Rugged Servers Market Trend Evolution
- Netherlands Rugged Servers Market Drivers and Challenges
- Netherlands Rugged Servers Price Trends
- Netherlands Rugged Servers Porter`s Five Forces
- Netherlands Rugged Servers Industry Life Cycle
- Historical Data and Forecast of Netherlands Rugged Servers Market Revenues & Volume By Offering for the Period 2022 - 2032F
- Historical Data and Forecast of Netherlands Rugged Servers Market Revenues & Volume By Hardware for the Period 2022 - 2032F
- Historical Data and Forecast of Netherlands Rugged Servers Market Revenues & Volume By Software & Services for the Period 2022 - 2032F
- Historical Data and Forecast of Netherlands Rugged Servers Market Revenues & Volume By Type for the Period 2022 - 2032F
- Historical Data and Forecast of Netherlands Rugged Servers Market Revenues & Volume By Dedicated for the Period 2022 - 2032F
- Historical Data and Forecast of Netherlands Rugged Servers Market Revenues & Volume By Standard for the Period 2022 - 2032F
- Historical Data and Forecast of Netherlands Rugged Servers Market Revenues & Volume By Application for the Period 2022 - 2032F
- Historical Data and Forecast of Netherlands Rugged Servers Market Revenues & Volume By Military & Aerospace for the Period 2022 - 2032F
- Historical Data and Forecast of Netherlands Rugged Servers Market Revenues & Volume By Telecommunication for the Period 2022 - 2032F
- Historical Data and Forecast of Netherlands Rugged Servers Market Revenues & Volume By Industrial for the Period 2022 - 2032F
- Historical Data and Forecast of Netherlands Rugged Servers Market Revenues & Volume By Energy & Power for the Period 2022 - 2032F
- Historical Data and Forecast of Netherlands Rugged Servers Market Revenues & Volume By Marine for the Period 2022 - 2032F
- Historical Data and Forecast of Netherlands Rugged Servers Market Revenues & Volume By Memory Size for the Period 2022 - 2032F
- Historical Data and Forecast of Netherlands Rugged Servers Market Revenues & Volume By <256 GB for the Period 2022 - 2032F
- Historical Data and Forecast of Netherlands Rugged Servers Market Revenues & Volume By 256 GB???512 GB for the Period 2022 - 2032F
- Historical Data and Forecast of Netherlands Rugged Servers Market Revenues & Volume By >512 GB???1 TB for the Period 2022 - 2032F
- Historical Data and Forecast of Netherlands Rugged Servers Market Revenues & Volume By >1TB for the Period 2022 - 2032F
- Netherlands Rugged Servers Import Export Trade Statistics
- Market Opportunity Assessment By Offering
- Market Opportunity Assessment By Type
- Market Opportunity Assessment By Application
- Market Opportunity Assessment By Memory Size
- Netherlands Rugged Servers Top Companies Market Share
- Netherlands Rugged Servers Competitive Benchmarking By Technical and Operational Parameters
- Netherlands Rugged Servers Company Profiles
- Netherlands Rugged Servers Key Strategic Recommendations
Frequently Asked Questions About the Market Study (FAQs):
6Wresearch actively monitors the Netherlands Rugged Servers Market and publishes its comprehensive annual report, highlighting emerging trends, growth drivers, revenue analysis, and forecast outlook. Our insights help businesses to make data-backed strategic decisions with ongoing market dynamics. Our analysts track relevent industries related to the Netherlands Rugged Servers Market, allowing our clients with actionable intelligence and reliable forecasts tailored to emerging regional needs.
Yes, we provide customisation as per your requirements. To learn more, feel free to contact us on sales@6wresearch.com
1 Executive Summary |
2 Introduction |
2.1 Key Highlights of the Report |
2.2 Report Description |
2.3 Market Scope & Segmentation |
2.4 Research Methodology |
2.5 Assumptions |
3 Netherlands Rugged Servers Market Overview |
3.1 Netherlands Country Macro Economic Indicators |
3.2 Netherlands Rugged Servers Market Revenues & Volume, 2022 & 2032F |
3.3 Netherlands Rugged Servers Market - Industry Life Cycle |
3.4 Netherlands Rugged Servers Market - Porter's Five Forces |
3.5 Netherlands Rugged Servers Market Revenues & Volume Share, By Offering, 2022 & 2032F |
3.6 Netherlands Rugged Servers Market Revenues & Volume Share, By Type, 2022 & 2032F |
3.7 Netherlands Rugged Servers Market Revenues & Volume Share, By Application, 2022 & 2032F |
3.8 Netherlands Rugged Servers Market Revenues & Volume Share, By Memory Size, 2022 & 2032F |
4 Netherlands Rugged Servers Market Dynamics |
4.1 Impact Analysis |
4.2 Market Drivers |
4.2.1 Increasing demand for rugged servers in military and defense applications due to their durability and reliability in harsh environments. |
4.2.2 Growing adoption of rugged servers in industrial automation and IoT applications for reliable data processing and storage. |
4.2.3 Favorable government initiatives and investments in enhancing critical infrastructure, boosting the demand for rugged servers in sectors such as energy, transportation, and healthcare. |
4.3 Market Restraints |
4.3.1 High initial investment costs associated with rugged servers compared to traditional servers, limiting adoption among small and medium-sized enterprises. |
4.3.2 Limited availability of skilled workforce for maintenance and support of rugged servers, leading to potential downtime and higher operational costs. |
4.3.3 Challenges in integrating rugged servers with existing IT infrastructure and software systems, hindering seamless deployment and utilization. |
5 Netherlands Rugged Servers Market Trends |
6 Netherlands Rugged Servers Market Segmentations |
6.1 Netherlands Rugged Servers Market, By Offering |
6.1.1 Overview and Analysis |
6.1.2 Netherlands Rugged Servers Market Revenues & Volume, By Hardware, 2022 - 2032F |
6.1.3 Netherlands Rugged Servers Market Revenues & Volume, By Software & Services, 2022 - 2032F |
6.2 Netherlands Rugged Servers Market, By Type |
6.2.1 Overview and Analysis |
6.2.2 Netherlands Rugged Servers Market Revenues & Volume, By Dedicated, 2022 - 2032F |
6.2.3 Netherlands Rugged Servers Market Revenues & Volume, By Standard, 2022 - 2032F |
6.3 Netherlands Rugged Servers Market, By Application |
6.3.1 Overview and Analysis |
6.3.2 Netherlands Rugged Servers Market Revenues & Volume, By Military & Aerospace, 2022 - 2032F |
6.3.3 Netherlands Rugged Servers Market Revenues & Volume, By Telecommunication, 2022 - 2032F |
6.3.4 Netherlands Rugged Servers Market Revenues & Volume, By Industrial, 2022 - 2032F |
6.3.5 Netherlands Rugged Servers Market Revenues & Volume, By Energy & Power, 2022 - 2032F |
6.3.6 Netherlands Rugged Servers Market Revenues & Volume, By Marine, 2022 - 2032F |
6.4 Netherlands Rugged Servers Market, By Memory Size |
6.4.1 Overview and Analysis |
6.4.2 Netherlands Rugged Servers Market Revenues & Volume, By <256 GB, 2022 - 2032F |
6.4.3 Netherlands Rugged Servers Market Revenues & Volume, By 256 GB???512 GB, 2022 - 2032F |
6.4.4 Netherlands Rugged Servers Market Revenues & Volume, By >512 GB???1 TB, 2022 - 2032F |
6.4.5 Netherlands Rugged Servers Market Revenues & Volume, By >1TB, 2022 - 2032F |
7 Netherlands Rugged Servers Market Import-Export Trade Statistics |
7.1 Netherlands Rugged Servers Market Export to Major Countries |
7.2 Netherlands Rugged Servers Market Imports from Major Countries |
8 Netherlands Rugged Servers Market Key Performance Indicators |
8.1 Mean Time Between Failures (MTBF) of rugged servers to measure reliability and durability. |
8.2 Average response time for technical support and maintenance services to assess the efficiency of post-sales support. |
8.3 Number of successful deployments of rugged servers in critical infrastructure projects to gauge market penetration and acceptance in key sectors. |
9 Netherlands Rugged Servers Market - Opportunity Assessment |
9.1 Netherlands Rugged Servers Market Opportunity Assessment, By Offering, 2022 & 2032F |
9.2 Netherlands Rugged Servers Market Opportunity Assessment, By Type, 2022 & 2032F |
9.3 Netherlands Rugged Servers Market Opportunity Assessment, By Application, 2022 & 2032F |
9.4 Netherlands Rugged Servers Market Opportunity Assessment, By Memory Size, 2022 & 2032F |
10 Netherlands Rugged Servers Market - Competitive Landscape |
10.1 Netherlands Rugged Servers Market Revenue Share, By Companies, 2025 |
10.2 Netherlands Rugged Servers Market Competitive Benchmarking, By Operating and Technical Parameters |
11 Company Profiles |
12 Recommendations | 13 Disclaimer |
Global Go To Market Strategy - 2030
Export potential enables firms to identify high-growth global markets with greater confidence by combining advanced trade intelligence with a structured quantitative methodology. The framework analyzes emerging demand trends and country-level import patterns while integrating macroeconomic and trade datasets such as GDP and population forecasts, bilateral import–export flows, tariff structures, elasticity differentials between developed and developing economies, geographic distance, and import demand projections. Using weighted trade values from 2020–2024 as the base period to project country-to-country export potential for 2030, these inputs are operationalized through calculated drivers such as gravity model parameters, tariff impact factors, and projected GDP per-capita growth. Through an analysis of hidden potentials, demand hotspots, and market conditions that are most favorable to success, this method enables firms to focus on target countries, maximize returns, and global expansion with data, backed by accuracy.
By factoring in the projected importer demand gap that is currently unmet and could be potential opportunity, it identifies the potential for the Exporter (Country) among 190 countries, against the general trade analysis, which identifies the biggest importer or exporter.
To discover high-growth global markets and optimize your business strategy:
Click Here
Pricing
- Single User License$ 1,995
- Department License$ 2,400
- Site License$ 3,120
- Global License$ 3,795

Leadership Perspectives from Industry Events
Search
Thought Leadership and Analyst Meet


Our Clients
6WResearch In News
- India Air Conditioner Market Set for Strong Rebound in 2026 After Weather-Led Correction and GST-Driven Recovery: 6Wresearch
- ADAS in India: How Automatic Emergency Braking, Blind Spot Detection & Driver Monitoring are Transforming Road Safety
- Doha a strategic location for EV manufacturing hub: IPA Qatar
- Demand for luxury TVs surging in the GCC, says Samsung
- Empowering Growth: The Thriving Journey of Bangladesh’s Cable Industry
- Demand for luxury TVs surging in the GCC, says Samsung
Latest Reports
- Poland Fire Protection Systems Market (2026-2032)
- Cape Verde Portable Hand-Thrown Extinguisher Market (2026-2032)
- Canada Portable Hand-Thrown Extinguisher Market (2026-2032)
- Cameroon Portable Hand-Thrown Extinguisher Market (2026-2032)
- Burundi Portable Hand-Thrown Extinguisher Market (2026-2032)
- Burkina Faso Portable Hand-Thrown Extinguisher Market (2026-2032)
- Bulgaria Portable Hand-Thrown Extinguisher Market (2026-2032)
- Brunei Portable Hand-Thrown Extinguisher Market (2026-2032)
- Botswana Portable Hand-Thrown Extinguisher Market (2026-2032)
- Bosnia and Herzegovina Portable Hand-Thrown Extinguisher Market (2026-2032)
Industry Events and Analyst Meet

HIMTEX 2026

India Refining Summit 2026

India EV Show 2026

EV tech India Expo 2026

Auto Tech Asia 2026
Whitepaper
- Middle East & Africa Commercial Security Market Click here to view more.
- Middle East & Africa Fire Safety Systems & Equipment Market Click here to view more.
- GCC Drone Market Click here to view more.
- Middle East Lighting Fixture Market Click here to view more.
- GCC Physical & Perimeter Security Market Click here to view more.