Netherlands Silver Market (2026-2032) | Segmentation, Revenue, Companies, Outlook, Analysis, Growth, Forecast, Size, Share, Industry, Value & Trends
Market Forecast By Type (Sterling Silver, German Silver, Coin Silver, Britannia Silver, Mexican Silver, Russian Silver, Oxidized Silver, Others), By Application (Silverware, Industrial, Jewelry, Investment, Photographic , Films, Electrical And Electronics, Pharmaceuticals) And Competitive Landscape
| Product Code: ETC5214342 | Publication Date: Nov 2023 | Updated Date: Apr 2026 | Product Type: Market Research Report | |
| Publisher: 6Wresearch | Author: Shubham Padhi | No. of Pages: 60 | No. of Figures: 30 | No. of Tables: 5 |
Netherlands Silver Market Size (2020-2030)
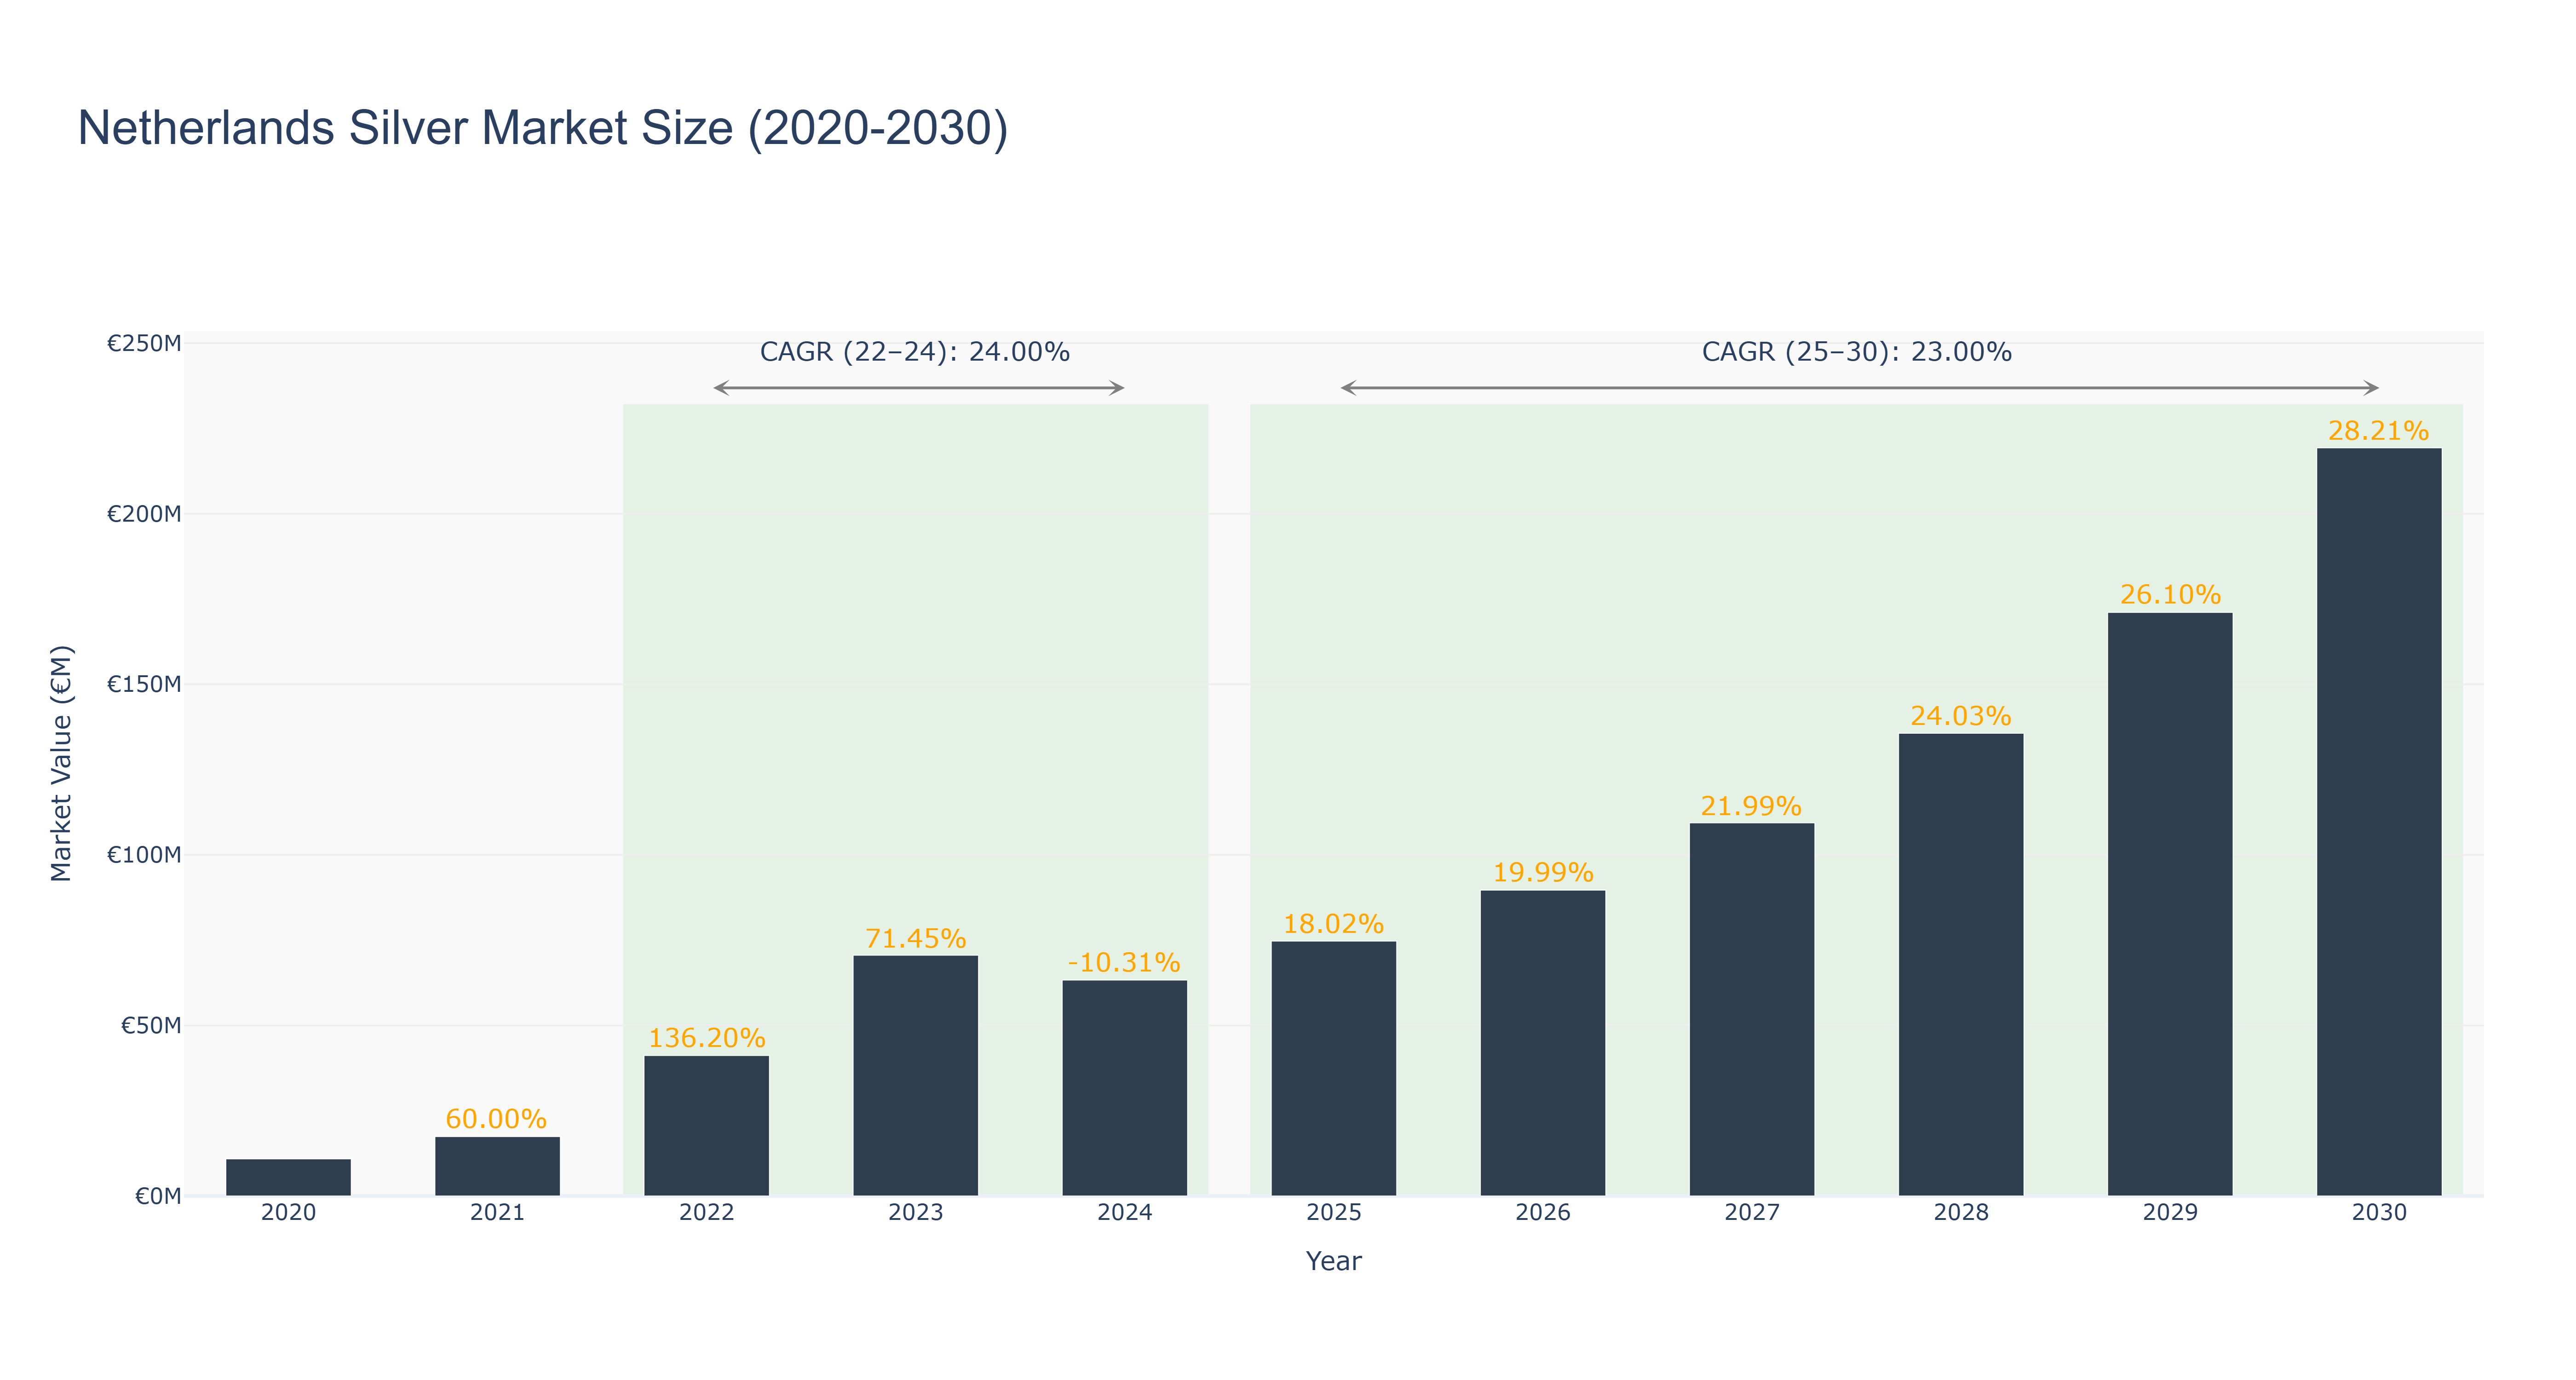
Netherlands Silver Market has shown a fluctuating trend over the past decade. The peak market size of €219.34 million is forecasted for 2030, with a steady growth trajectory. Notably, the market experienced a decline in 2024 to €63.33 million, attributed to a temporary market correction. The subsequent years saw a significant rebound, reaching €135.67 million in 2028. The CAGR for the period 2022-24 stands at 24.00%, reflecting a period of adjustment, while the CAGR for 2025-30 is projected at 23.00%, indicating sustained growth. Industry drivers such as technological advancements and changing consumer preferences have contributed to the market's resilience. Looking ahead, the Netherlands Silver Market is poised for further expansion, with upcoming initiatives in sustainable silver mining and innovative product design set to drive growth in the near future.
Netherlands Silver Market: Production & Trade Performance (2019-2025)
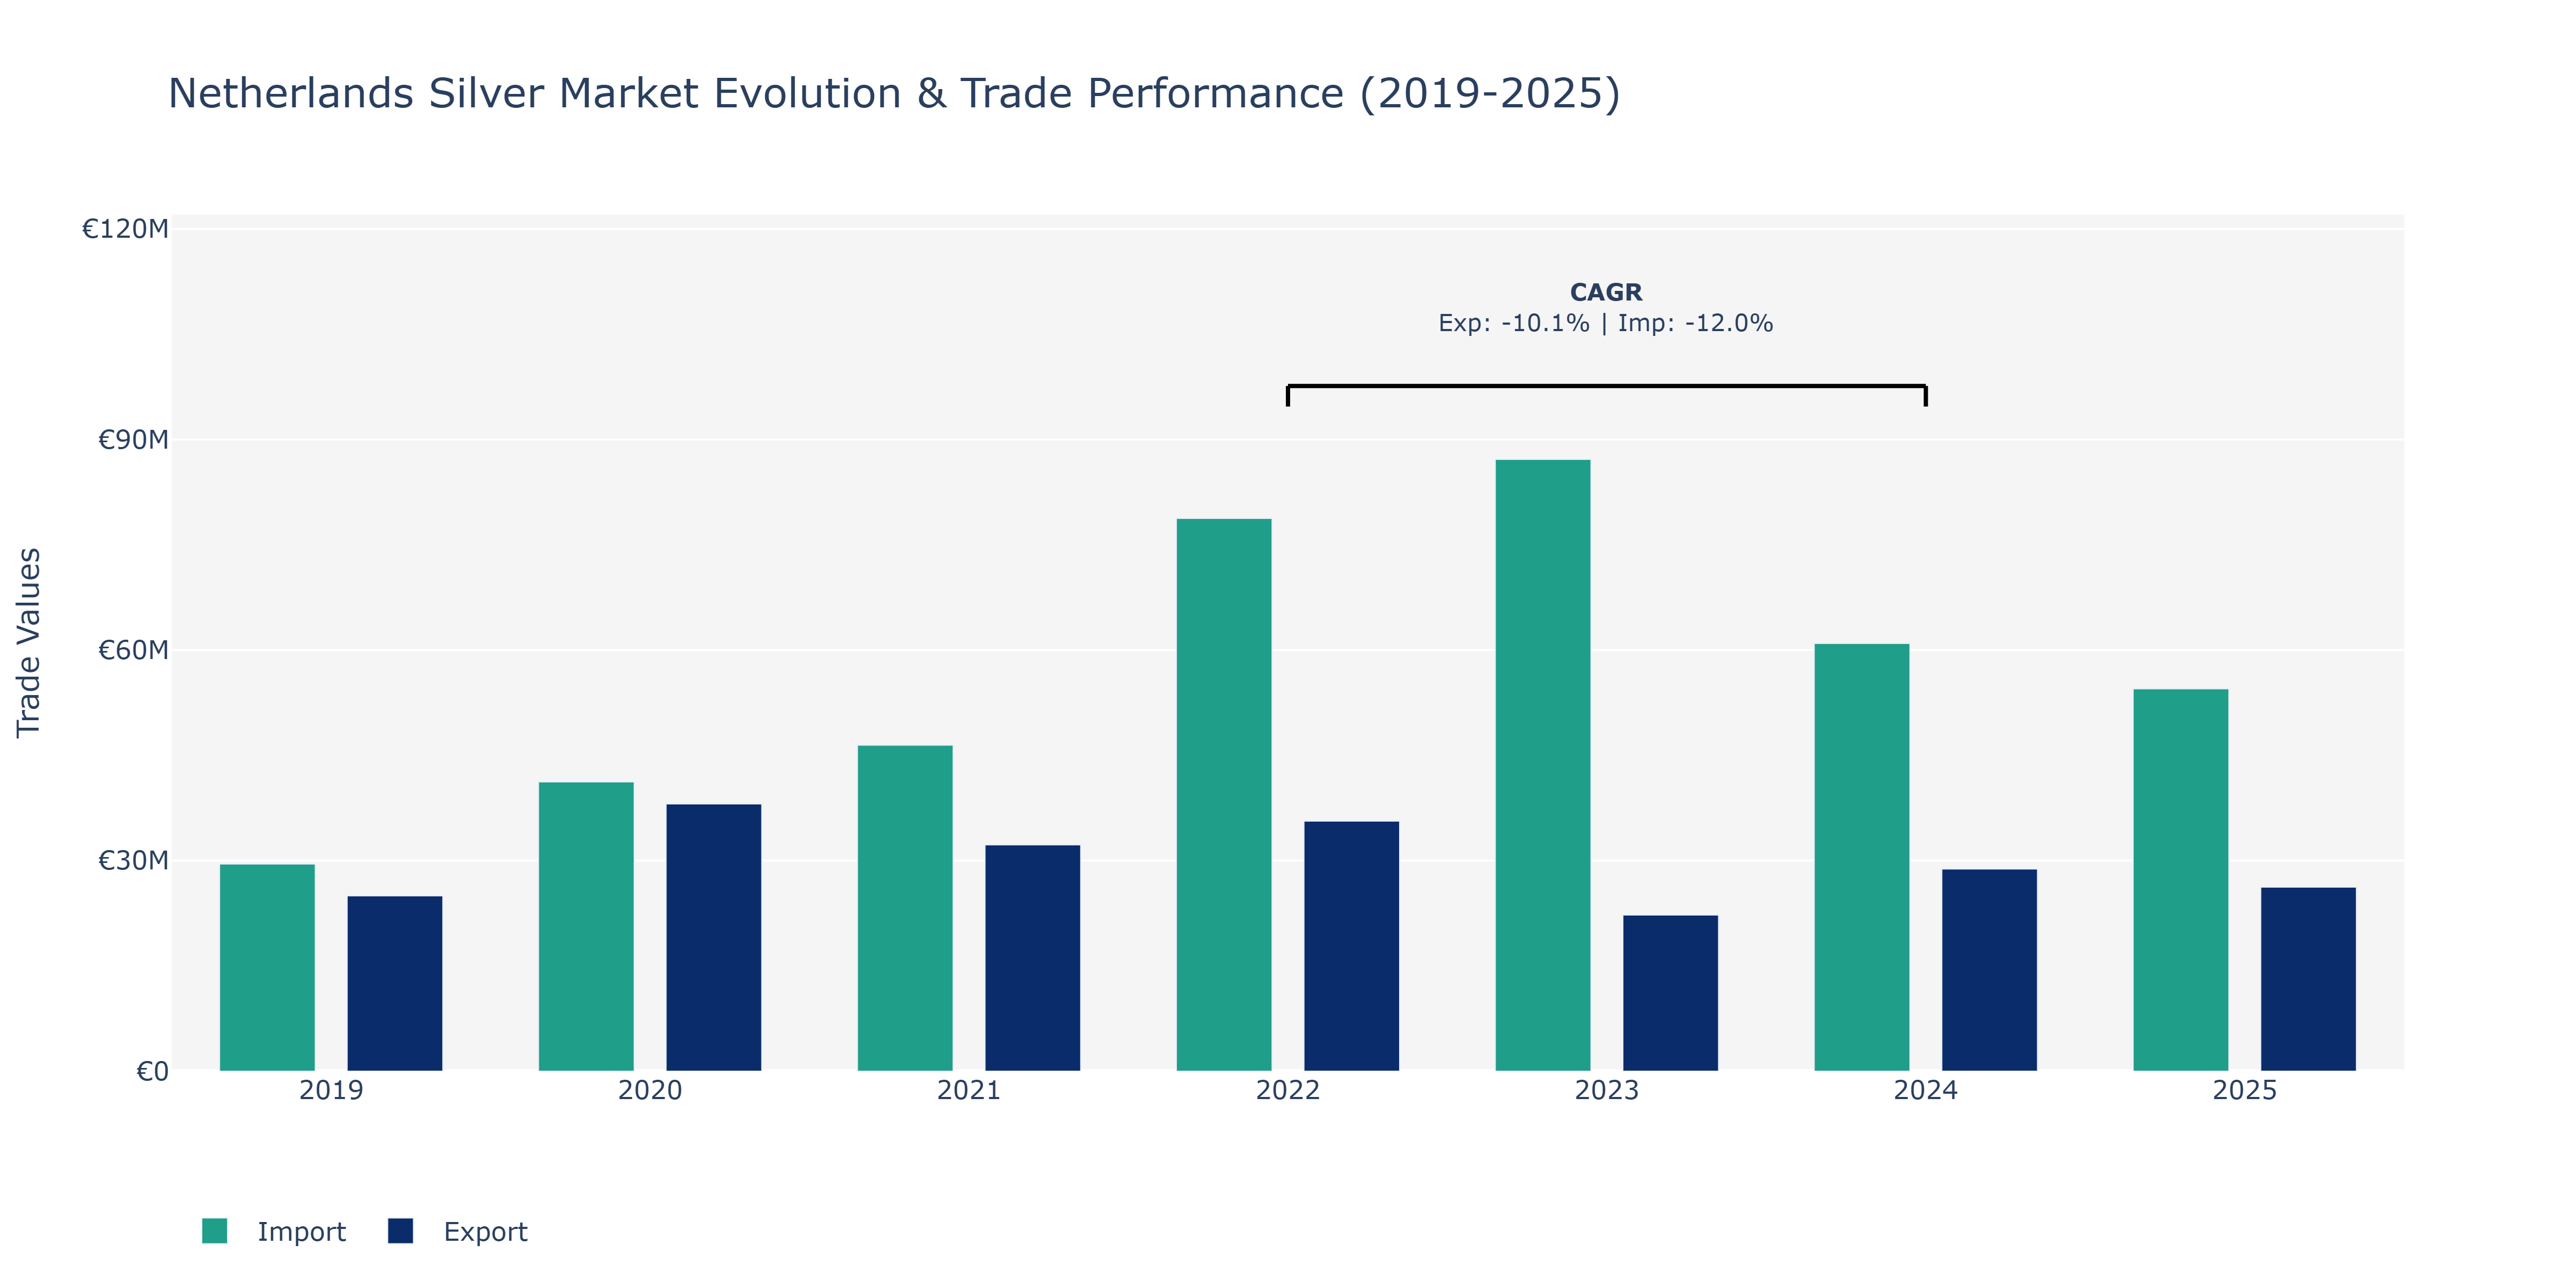
The Netherlands Silver Market witnessed fluctuations in both Exports and Imports from 2019 to 2025. Exports showed a peak in 2020 at €38.07 million, indicating a substantial increase from €24.99 million in 2019. However, the trend reversed in the following years, with a notable decline in 2023 to €22.25 million before a slight recovery in 2024 to €28.8 million. Conversely, Imports consistently increased over the years, reaching €87.16 million in 2023, the highest in the period. The peak Imports coincided with a surge in 2022 to €78.74 million. Factors influencing these trends could include global economic conditions impacting demand for silver products, changes in trade policies affecting cross-border transactions, and shifts in consumer preferences towards silver goods. The sharp decrease in Exports in 2023 might reflect a temporary market adjustment, potentially due to supply chain disruptions or shifts in production hubs. Further analysis could reveal the long-term implications of these fluctuations on the Netherlands Silver Market.
Key Highlights of the Report:
- Netherlands Silver Market Outlook
- Market Size of Netherlands Silver Market, 2025
- Forecast of Netherlands Silver Market, 2032
- Historical Data and Forecast of Netherlands Silver Revenues & Volume for the Period 2022 - 2032F
- Netherlands Silver Market Trend Evolution
- Netherlands Silver Market Drivers and Challenges
- Netherlands Silver Price Trends
- Netherlands Silver Porter`s Five Forces
- Netherlands Silver Industry Life Cycle
- Historical Data and Forecast of Netherlands Silver Market Revenues & Volume By Type for the Period 2022 - 2032F
- Historical Data and Forecast of Netherlands Silver Market Revenues & Volume By Sterling Silver for the Period 2022 - 2032F
- Historical Data and Forecast of Netherlands Silver Market Revenues & Volume By German Silver for the Period 2022 - 2032F
- Historical Data and Forecast of Netherlands Silver Market Revenues & Volume By Coin Silver for the Period 2022 - 2032F
- Historical Data and Forecast of Netherlands Silver Market Revenues & Volume By Britannia Silver for the Period 2022 - 2032F
- Historical Data and Forecast of Netherlands Silver Market Revenues & Volume By Mexican Silver for the Period 2022 - 2032F
- Historical Data and Forecast of Netherlands Silver Market Revenues & Volume By Russian Silver for the Period 2022 - 2032F
- Historical Data and Forecast of Netherlands Silver Market Revenues & Volume By Oxidized Silver for the Period 2022 - 2032F
- Historical Data and Forecast of Netherlands Sterling Silver Silver Market Revenues & Volume By Others for the Period 2022 - 2032F
- Historical Data and Forecast of Netherlands Silver Market Revenues & Volume By Application for the Period 2022 - 2032F
- Historical Data and Forecast of Netherlands Silver Market Revenues & Volume By Silverware for the Period 2022 - 2032F
- Historical Data and Forecast of Netherlands Silver Market Revenues & Volume By Industrial for the Period 2022 - 2032F
- Historical Data and Forecast of Netherlands Silver Market Revenues & Volume By Jewelry for the Period 2022 - 2032F
- Historical Data and Forecast of Netherlands Silver Market Revenues & Volume By Investment for the Period 2022 - 2032F
- Historical Data and Forecast of Netherlands Silver Market Revenues & Volume By Photographic for the Period 2022 - 2032F
- Historical Data and Forecast of Netherlands Silver Market Revenues & Volume By Films for the Period 2022 - 2032F
- Historical Data and Forecast of Netherlands Silver Market Revenues & Volume By Electrical And Electronics for the Period 2022 - 2032F
- Historical Data and Forecast of Netherlands Silver Market Revenues & Volume By Pharmaceuticals for the Period 2022 - 2032F
- Netherlands Silver Import Export Trade Statistics
- Market Opportunity Assessment By Type
- Market Opportunity Assessment By Application
- Netherlands Silver Top Companies Market Share
- Netherlands Silver Competitive Benchmarking By Technical and Operational Parameters
- Netherlands Silver Company Profiles
- Netherlands Silver Key Strategic Recommendations
Frequently Asked Questions About the Market Study (FAQs):
6Wresearch actively monitors the Netherlands Silver Market and publishes its comprehensive annual report, highlighting emerging trends, growth drivers, revenue analysis, and forecast outlook. Our insights help businesses to make data-backed strategic decisions with ongoing market dynamics. Our analysts track relevent industries related to the Netherlands Silver Market, allowing our clients with actionable intelligence and reliable forecasts tailored to emerging regional needs.
Yes, we provide customisation as per your requirements. To learn more, feel free to contact us on sales@6wresearch.com
1 Executive Summary |
2 Introduction |
2.1 Key Highlights of the Report |
2.2 Report Description |
2.3 Market Scope & Segmentation |
2.4 Research Methodology |
2.5 Assumptions |
3 Netherlands Silver Market Overview |
3.1 Netherlands Country Macro Economic Indicators |
3.2 Netherlands Silver Market Revenues & Volume, 2022 & 2032F |
3.3 Netherlands Silver Market - Industry Life Cycle |
3.4 Netherlands Silver Market - Porter's Five Forces |
3.5 Netherlands Silver Market Revenues & Volume Share, By Type, 2022 & 2032F |
3.6 Netherlands Silver Market Revenues & Volume Share, By Application, 2022 & 2032F |
4 Netherlands Silver Market Dynamics |
4.1 Impact Analysis |
4.2 Market Drivers |
4.2.1 Growing disposable income of consumers in the Netherlands |
4.2.2 Increasing trend of sustainable and ethical consumerism |
4.2.3 Rising demand for silver jewelry as a fashion statement |
4.3 Market Restraints |
4.3.1 Fluctuating silver prices in the global market |
4.3.2 Competition from alternative materials like stainless steel and brass in the jewelry industry |
5 Netherlands Silver Market Trends |
6 Netherlands Silver Market Segmentations |
6.1 Netherlands Silver Market, By Type |
6.1.1 Overview and Analysis |
6.1.2 Netherlands Silver Market Revenues & Volume, By Sterling Silver, 2022 - 2032F |
6.1.3 Netherlands Silver Market Revenues & Volume, By German Silver, 2022 - 2032F |
6.1.4 Netherlands Silver Market Revenues & Volume, By Coin Silver, 2022 - 2032F |
6.1.5 Netherlands Silver Market Revenues & Volume, By Britannia Silver, 2022 - 2032F |
6.1.6 Netherlands Silver Market Revenues & Volume, By Mexican Silver, 2022 - 2032F |
6.1.7 Netherlands Silver Market Revenues & Volume, By Russian Silver, 2022 - 2032F |
6.1.9 Netherlands Silver Market Revenues & Volume, By Others, 2022 - 2032F |
6.1.10 Netherlands Silver Market Revenues & Volume, By Others, 2022 - 2032F |
6.2 Netherlands Silver Market, By Application |
6.2.1 Overview and Analysis |
6.2.2 Netherlands Silver Market Revenues & Volume, By Silverware, 2022 - 2032F |
6.2.3 Netherlands Silver Market Revenues & Volume, By Industrial, 2022 - 2032F |
6.2.4 Netherlands Silver Market Revenues & Volume, By Jewelry, 2022 - 2032F |
6.2.5 Netherlands Silver Market Revenues & Volume, By Investment, 2022 - 2032F |
6.2.6 Netherlands Silver Market Revenues & Volume, By Photographic , 2022 - 2032F |
6.2.7 Netherlands Silver Market Revenues & Volume, By Films, 2022 - 2032F |
6.2.8 Netherlands Silver Market Revenues & Volume, By Pharmaceuticals, 2022 - 2032F |
6.2.9 Netherlands Silver Market Revenues & Volume, By Pharmaceuticals, 2022 - 2032F |
7 Netherlands Silver Market Import-Export Trade Statistics |
7.1 Netherlands Silver Market Export to Major Countries |
7.2 Netherlands Silver Market Imports from Major Countries |
8 Netherlands Silver Market Key Performance Indicators |
8.1 Average spending per consumer on silver products |
8.2 Number of new sustainable and ethical silver products introduced in the market |
8.3 % of market share held by silver jewelry compared to other materials |
8.4 Consumer sentiment towards silver products |
8.5 Number of online searches for silver jewelry in the Netherlands |
9 Netherlands Silver Market - Opportunity Assessment |
9.1 Netherlands Silver Market Opportunity Assessment, By Type, 2022 & 2032F |
9.2 Netherlands Silver Market Opportunity Assessment, By Application, 2022 & 2032F |
10 Netherlands Silver Market - Competitive Landscape |
10.1 Netherlands Silver Market Revenue Share, By Companies, 2025 |
10.2 Netherlands Silver Market Competitive Benchmarking, By Operating and Technical Parameters |
11 Company Profiles |
12 Recommendations | 13 Disclaimer |
Export potential assessment - trade Analytics for 2030
Export potential enables firms to identify high-growth global markets with greater confidence by combining advanced trade intelligence with a structured quantitative methodology. The framework analyzes emerging demand trends and country-level import patterns while integrating macroeconomic and trade datasets such as GDP and population forecasts, bilateral import–export flows, tariff structures, elasticity differentials between developed and developing economies, geographic distance, and import demand projections. Using weighted trade values from 2020–2024 as the base period to project country-to-country export potential for 2030, these inputs are operationalized through calculated drivers such as gravity model parameters, tariff impact factors, and projected GDP per-capita growth. Through an analysis of hidden potentials, demand hotspots, and market conditions that are most favorable to success, this method enables firms to focus on target countries, maximize returns, and global expansion with data, backed by accuracy.
By factoring in the projected importer demand gap that is currently unmet and could be potential opportunity, it identifies the potential for the Exporter (Country) among 190 countries, against the general trade analysis, which identifies the biggest importer or exporter.
To discover high-growth global markets and optimize your business strategy:
Click Here
Pricing
- Single User License$ 1,995
- Department License$ 2,400
- Site License$ 3,120
- Global License$ 3,795

Search
Thought Leadership and Analyst Meet


Our Clients
Latest Reports
- France Thermally Conductive Filler Dispersants Market (2026-2032) | Challenges, Restraints, Value, Share, Size, segmentation, Analysis, Trends, Investment Opportunities, Outlook, Pricing, Demand, Forecast, Revenue, Companies, Growth, Drivers, Strategy, Insights, Competition
- Egypt Thermally Conductive Filler Dispersants Market (2026-2032) | Competition, Forecast, Strategy, Value, Insights, Outlook, Investment Opportunities, Pricing, Demand, Share, segmentation, Drivers, Size, Companies, Restraints, Growth, Trends, Revenue, Challenges, Analysis
- Czech Republic Thermally Conductive Filler Dispersants Market (2026-2032) | Forecast, Pricing, Analysis, Drivers, Insights, Size, Demand, Growth, Challenges, segmentation, Competition, Outlook, Trends, Investment Opportunities, Companies, Strategy, Revenue, Share, Value, Restraints
- Colombia Thermally Conductive Filler Dispersants Market (2026-2032) | segmentation, Trends, Share, Drivers, Strategy, Companies, Demand, Insights, Size, Challenges, Value, Competition, Analysis, Growth, Revenue, Restraints, Forecast, Pricing, Outlook, Investment Opportunities
- China Thermally Conductive Filler Dispersants Market (2026-2032) | Restraints, Investment Opportunities, Pricing, Companies, Share, Size, Challenges, Trends, Outlook, Value, Analysis, Competition, Revenue, Drivers, Forecast, Demand, Insights, Growth, Strategy, segmentation
- Chile Thermally Conductive Filler Dispersants Market (2026-2032) | Investment Opportunities, Trends, Value, Restraints, Share, Companies, Forecast, segmentation, Pricing, Challenges, Demand, Size, Analysis, Drivers, Outlook, Growth, Competition, Strategy, Revenue, Insights
- Cambodia Thermally Conductive Filler Dispersants Market (2026-2032) | Analysis, Share, Outlook, Strategy, Pricing, Demand, Size, Growth, segmentation, Insights, Revenue, Forecast, Challenges, Competition, Companies, Investment Opportunities, Trends, Restraints, Value, Drivers
- Brazil Thermally Conductive Filler Dispersants Market (2026-2032) | Restraints, Forecast, Competition, Size, Revenue, Value, Investment Opportunities, Trends, Insights, Outlook, Growth, Analysis, Drivers, segmentation, Pricing, Challenges, Strategy, Share, Companies, Demand
- Bangladesh Thermally Conductive Filler Dispersants Market (2026-2032) | Restraints, Trends, Analysis, Competition, Insights, Forecast, Value, Investment Opportunities, Pricing, Share, Demand, Outlook, Revenue, segmentation, Companies, Drivers, Growth, Size, Challenges, Strategy
- Bahrain Thermally Conductive Filler Dispersants Market (2026-2032) | Trends, Outlook, Pricing, Demand, Value, Competition, Forecast, Growth, segmentation, Revenue, Companies, Analysis, Insights, Size, Drivers, Challenges, Strategy, Investment Opportunities, Share, Restraints
Industry Events and Analyst Meet

HIMTEX 2026

India Refining Summit 2026

India EV Show 2026

EV tech India Expo 2026

Auto Tech Asia 2026
Whitepaper
- Middle East & Africa Commercial Security Market Click here to view more.
- Middle East & Africa Fire Safety Systems & Equipment Market Click here to view more.
- GCC Drone Market Click here to view more.
- Middle East Lighting Fixture Market Click here to view more.
- GCC Physical & Perimeter Security Market Click here to view more.
6WResearch In News
- Doha a strategic location for EV manufacturing hub: IPA Qatar
- Demand for luxury TVs surging in the GCC, says Samsung
- Empowering Growth: The Thriving Journey of Bangladesh’s Cable Industry
- Demand for luxury TVs surging in the GCC, says Samsung
- Video call with a traditional healer? Once unthinkable, it’s now common in South Africa
- Intelligent Buildings To Smooth GCC’s Path To Net Zero