Netherlands Small Molecule CDMO Market (2026-2032) | Demand, Segments, Value, Revenue, Growth, Consumer Insights, Supply, Strategy, Companies, Size, Share, Restraints, Outlook, Opportunities, Forecast, Strategic Insights, Industry, Challenges, Competitive, Pricing Analysis, Competition, Drivers, Analysis, Trends, Investment Trends, Segmentation
Market Forecast By Service Type (Drug Substance Development, Drug Product Manufacturing, Formulation Services, Analytical Testing, Packaging & Logistics), By API Type (Generic APIs, Specialty APIs, Biotech APIs, Oncology Drug APIs, High-Potency APIs), By Drug Development Stage (Early-Stage Discovery, Preclinical Trials, Clinical Trials Phase 1, Commercial Manufacturing, Post- Surveillance), By Facility Type (Pilot Scale, Large-Scale Production, R&D Facilities, Sterile Manufacturing Units, Integrated Supply Chain Management), By Regulatory Compliance (US FDA & EMA Approved, GMP & ISO 13485 Certified, WHO GMP Standards, Good Laboratory Practices, Hazardous Material Handling) And Competitive Landscape
| Product Code: ETC10815372 | Publication Date: Apr 2025 | Updated Date: Apr 2026 | Product Type: Market Research Report | |
| Publisher: 6Wresearch | No. of Pages: 65 | No. of Figures: 34 | No. of Tables: 19 | |
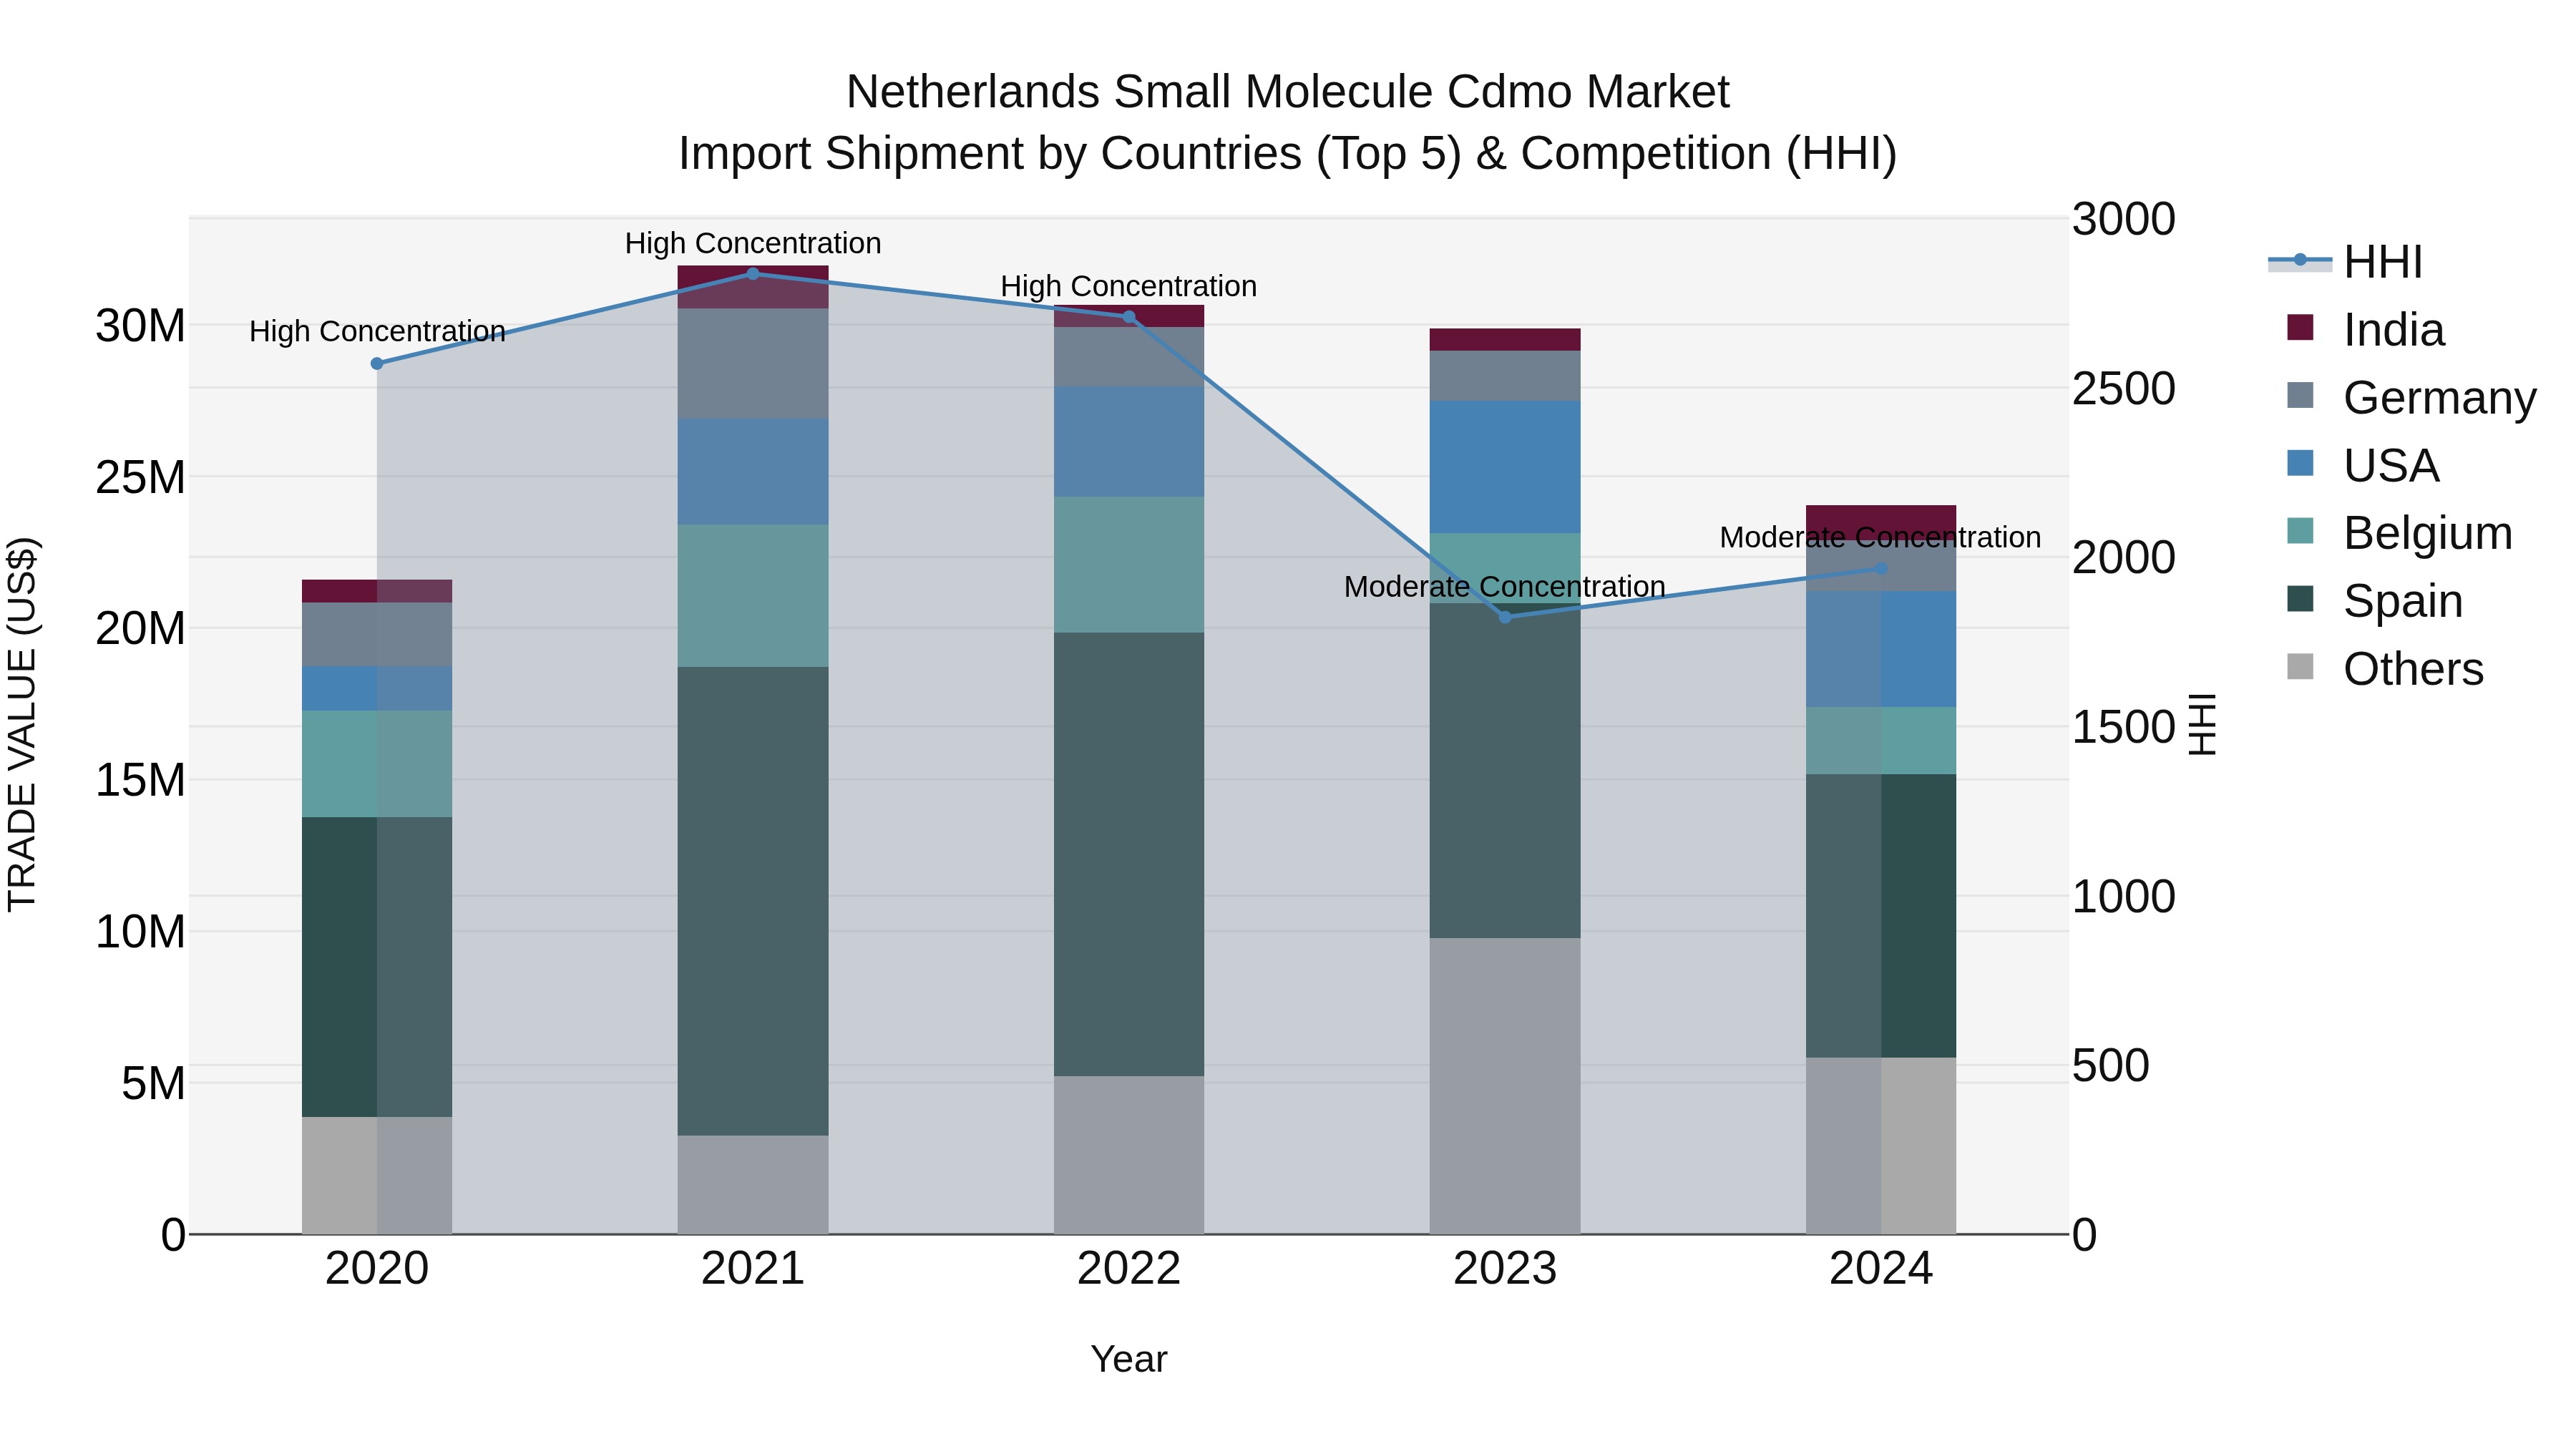
Netherlands Small Molecule Cdmo Market Top 5 Importing Countries and Market Competition (HHI) Analysis
In 2024, the Netherlands saw significant small molecule CDMO import shipments, with top exporters being Spain, USA, Belgium, Germany, and India. Despite moderate concentration levels indicated by the HHI, the industry experienced steady growth with a CAGR of 2.72% from 2020-2024. However, there was a notable decline in growth rate from 2023 to 2024 at -19.52%, potentially reflecting changing market dynamics or external factors impacting the import landscape. Monitoring these trends can provide valuable insights for companies operating in this sector.
Key Highlights of the Report:
- Netherlands Small Molecule CDMO Market Outlook
- Market Size of Netherlands Small Molecule CDMO Market, 2025
- Forecast of Netherlands Small Molecule CDMO Market, 2032
- Historical Data and Forecast of Netherlands Small Molecule CDMO Revenues & Volume for the Period 2022 - 2032F
- Netherlands Small Molecule CDMO Market Trend Evolution
- Netherlands Small Molecule CDMO Market Drivers and Challenges
- Netherlands Small Molecule CDMO Price Trends
- Netherlands Small Molecule CDMO Porter's Five Forces
- Netherlands Small Molecule CDMO Industry Life Cycle
- Historical Data and Forecast of Netherlands Small Molecule CDMO Market Revenues & Volume By Service Type for the Period 2022 - 2032F
- Historical Data and Forecast of Netherlands Small Molecule CDMO Market Revenues & Volume By Drug Substance Development for the Period 2022 - 2032F
- Historical Data and Forecast of Netherlands Small Molecule CDMO Market Revenues & Volume By Drug Product Manufacturing for the Period 2022 - 2032F
- Historical Data and Forecast of Netherlands Small Molecule CDMO Market Revenues & Volume By Formulation Services for the Period 2022 - 2032F
- Historical Data and Forecast of Netherlands Small Molecule CDMO Market Revenues & Volume By Analytical Testing for the Period 2022 - 2032F
- Historical Data and Forecast of Netherlands Small Molecule CDMO Market Revenues & Volume By Packaging & Logistics for the Period 2022 - 2032F
- Historical Data and Forecast of Netherlands Small Molecule CDMO Market Revenues & Volume By API Type for the Period 2022 - 2032F
- Historical Data and Forecast of Netherlands Small Molecule CDMO Market Revenues & Volume By Generic APIs for the Period 2022 - 2032F
- Historical Data and Forecast of Netherlands Small Molecule CDMO Market Revenues & Volume By Specialty APIs for the Period 2022 - 2032F
- Historical Data and Forecast of Netherlands Small Molecule CDMO Market Revenues & Volume By Biotech APIs for the Period 2022 - 2032F
- Historical Data and Forecast of Netherlands Small Molecule CDMO Market Revenues & Volume By Oncology Drug APIs for the Period 2022 - 2032F
- Historical Data and Forecast of Netherlands Small Molecule CDMO Market Revenues & Volume By High-Potency APIs for the Period 2022 - 2032F
- Historical Data and Forecast of Netherlands Small Molecule CDMO Market Revenues & Volume By Drug Development Stage for the Period 2022 - 2032F
- Historical Data and Forecast of Netherlands Small Molecule CDMO Market Revenues & Volume By Early-Stage Discovery for the Period 2022 - 2032F
- Historical Data and Forecast of Netherlands Small Molecule CDMO Market Revenues & Volume By Preclinical Trials for the Period 2022 - 2032F
- Historical Data and Forecast of Netherlands Small Molecule CDMO Market Revenues & Volume By Clinical Trials Phase 1 for the Period 2022 - 2032F
- Historical Data and Forecast of Netherlands Small Molecule CDMO Market Revenues & Volume By Commercial Manufacturing for the Period 2022 - 2032F
- Historical Data and Forecast of Netherlands Small Molecule CDMO Market Revenues & Volume By Post- Surveillance for the Period 2022 - 2032F
- Historical Data and Forecast of Netherlands Small Molecule CDMO Market Revenues & Volume By Facility Type for the Period 2022 - 2032F
- Historical Data and Forecast of Netherlands Small Molecule CDMO Market Revenues & Volume By Pilot Scale for the Period 2022 - 2032F
- Historical Data and Forecast of Netherlands Small Molecule CDMO Market Revenues & Volume By Large-Scale Production for the Period 2022 - 2032F
- Historical Data and Forecast of Netherlands Small Molecule CDMO Market Revenues & Volume By R&D Facilities for the Period 2022 - 2032F
- Historical Data and Forecast of Netherlands Small Molecule CDMO Market Revenues & Volume By Sterile Manufacturing Units for the Period 2022 - 2032F
- Historical Data and Forecast of Netherlands Small Molecule CDMO Market Revenues & Volume By Integrated Supply Chain Management for the Period 2022 - 2032F
- Historical Data and Forecast of Netherlands Small Molecule CDMO Market Revenues & Volume By Regulatory Compliance for the Period 2022 - 2032F
- Historical Data and Forecast of Netherlands Small Molecule CDMO Market Revenues & Volume By US FDA & EMA Approved for the Period 2022 - 2032F
- Historical Data and Forecast of Netherlands Small Molecule CDMO Market Revenues & Volume By GMP & ISO 13485 Certified for the Period 2022 - 2032F
- Historical Data and Forecast of Netherlands Small Molecule CDMO Market Revenues & Volume By WHO GMP Standards for the Period 2022 - 2032F
- Historical Data and Forecast of Netherlands Small Molecule CDMO Market Revenues & Volume By Good Laboratory Practices for the Period 2022 - 2032F
- Historical Data and Forecast of Netherlands Small Molecule CDMO Market Revenues & Volume By Hazardous Material Handling for the Period 2022 - 2032F
- Netherlands Small Molecule CDMO Import Export Trade Statistics
- Market Opportunity Assessment By Service Type
- Market Opportunity Assessment By API Type
- Market Opportunity Assessment By Drug Development Stage
- Market Opportunity Assessment By Facility Type
- Market Opportunity Assessment By Regulatory Compliance
- Netherlands Small Molecule CDMO Top Companies Market Share
- Netherlands Small Molecule CDMO Competitive Benchmarking By Technical and Operational Parameters
- Netherlands Small Molecule CDMO Company Profiles
- Netherlands Small Molecule CDMO Key Strategic Recommendations
Frequently Asked Questions About the Market Study (FAQs):
6Wresearch actively monitors the Netherlands Small Molecule CDMO Market and publishes its comprehensive annual report, highlighting emerging trends, growth drivers, revenue analysis, and forecast outlook. Our insights help businesses to make data-backed strategic decisions with ongoing market dynamics. Our analysts track relevent industries related to the Netherlands Small Molecule CDMO Market, allowing our clients with actionable intelligence and reliable forecasts tailored to emerging regional needs.
Yes, we provide customisation as per your requirements. To learn more, feel free to contact us on sales@6wresearch.com
1 Executive Summary |
2 Introduction |
2.1 Key Highlights of the Report |
2.2 Report Description |
2.3 Market Scope & Segmentation |
2.4 Research Methodology |
2.5 Assumptions |
3 Netherlands Small Molecule CDMO Market Overview |
3.1 Netherlands Country Macro Economic Indicators |
3.2 Netherlands Small Molecule CDMO Market Revenues & Volume, 2022 & 2032F |
3.3 Netherlands Small Molecule CDMO Market - Industry Life Cycle |
3.4 Netherlands Small Molecule CDMO Market - Porter's Five Forces |
3.5 Netherlands Small Molecule CDMO Market Revenues & Volume Share, By Service Type, 2022 & 2032F |
3.6 Netherlands Small Molecule CDMO Market Revenues & Volume Share, By API Type, 2022 & 2032F |
3.7 Netherlands Small Molecule CDMO Market Revenues & Volume Share, By Drug Development Stage, 2022 & 2032F |
3.8 Netherlands Small Molecule CDMO Market Revenues & Volume Share, By Facility Type, 2022 & 2032F |
3.9 Netherlands Small Molecule CDMO Market Revenues & Volume Share, By Regulatory Compliance, 2022 & 2032F |
4 Netherlands Small Molecule CDMO Market Dynamics |
4.1 Impact Analysis |
4.2 Market Drivers |
4.2.1 Increasing demand for outsourcing of drug development and manufacturing services by pharmaceutical companies to reduce costs and focus on core competencies. |
4.2.2 Growing trend of strategic partnerships and collaborations between pharmaceutical companies and contract development and manufacturing organizations (CDMOs) to access specialized expertise and capabilities. |
4.2.3 Advancements in small molecule drug development technologies and manufacturing processes driving the need for specialized CDMO services. |
4.3 Market Restraints |
4.3.1 Regulatory challenges and compliance requirements impacting the operations and timelines of small molecule CDMOs. |
4.3.2 Increasing competition in the small molecule CDMO market leading to pricing pressures and margin constraints. |
4.3.3 Market volatility and uncertainties related to global economic conditions affecting the overall demand for CDMO services. |
5 Netherlands Small Molecule CDMO Market Trends |
6 Netherlands Small Molecule CDMO Market, By Types |
6.1 Netherlands Small Molecule CDMO Market, By Service Type |
6.1.1 Overview and Analysis |
6.1.2 Netherlands Small Molecule CDMO Market Revenues & Volume, By Service Type, 2022 - 2032F |
6.1.3 Netherlands Small Molecule CDMO Market Revenues & Volume, By Drug Substance Development, 2022 - 2032F |
6.1.4 Netherlands Small Molecule CDMO Market Revenues & Volume, By Drug Product Manufacturing, 2022 - 2032F |
6.1.5 Netherlands Small Molecule CDMO Market Revenues & Volume, By Formulation Services, 2022 - 2032F |
6.1.6 Netherlands Small Molecule CDMO Market Revenues & Volume, By Analytical Testing, 2022 - 2032F |
6.1.7 Netherlands Small Molecule CDMO Market Revenues & Volume, By Packaging & Logistics, 2022 - 2032F |
6.2 Netherlands Small Molecule CDMO Market, By API Type |
6.2.1 Overview and Analysis |
6.2.2 Netherlands Small Molecule CDMO Market Revenues & Volume, By Generic APIs, 2022 - 2032F |
6.2.3 Netherlands Small Molecule CDMO Market Revenues & Volume, By Specialty APIs, 2022 - 2032F |
6.2.4 Netherlands Small Molecule CDMO Market Revenues & Volume, By Biotech APIs, 2022 - 2032F |
6.2.5 Netherlands Small Molecule CDMO Market Revenues & Volume, By Oncology Drug APIs, 2022 - 2032F |
6.2.6 Netherlands Small Molecule CDMO Market Revenues & Volume, By High-Potency APIs, 2022 - 2032F |
6.3 Netherlands Small Molecule CDMO Market, By Drug Development Stage |
6.3.1 Overview and Analysis |
6.3.2 Netherlands Small Molecule CDMO Market Revenues & Volume, By Early-Stage Discovery, 2022 - 2032F |
6.3.3 Netherlands Small Molecule CDMO Market Revenues & Volume, By Preclinical Trials, 2022 - 2032F |
6.3.4 Netherlands Small Molecule CDMO Market Revenues & Volume, By Clinical Trials Phase 1, 2022 - 2032F |
6.3.5 Netherlands Small Molecule CDMO Market Revenues & Volume, By Commercial Manufacturing, 2022 - 2032F |
6.3.6 Netherlands Small Molecule CDMO Market Revenues & Volume, By Post- Surveillance, 2022 - 2032F |
6.4 Netherlands Small Molecule CDMO Market, By Facility Type |
6.4.1 Overview and Analysis |
6.4.2 Netherlands Small Molecule CDMO Market Revenues & Volume, By Pilot Scale, 2022 - 2032F |
6.4.3 Netherlands Small Molecule CDMO Market Revenues & Volume, By Large-Scale Production, 2022 - 2032F |
6.4.4 Netherlands Small Molecule CDMO Market Revenues & Volume, By R&D Facilities, 2022 - 2032F |
6.4.5 Netherlands Small Molecule CDMO Market Revenues & Volume, By Sterile Manufacturing Units, 2022 - 2032F |
6.4.6 Netherlands Small Molecule CDMO Market Revenues & Volume, By Integrated Supply Chain Management, 2022 - 2032F |
6.5 Netherlands Small Molecule CDMO Market, By Regulatory Compliance |
6.5.1 Overview and Analysis |
6.5.2 Netherlands Small Molecule CDMO Market Revenues & Volume, By US FDA & EMA Approved, 2022 - 2032F |
6.5.3 Netherlands Small Molecule CDMO Market Revenues & Volume, By GMP & ISO 13485 Certified, 2022 - 2032F |
6.5.4 Netherlands Small Molecule CDMO Market Revenues & Volume, By WHO GMP Standards, 2022 - 2032F |
6.5.5 Netherlands Small Molecule CDMO Market Revenues & Volume, By Good Laboratory Practices, 2022 - 2032F |
6.5.6 Netherlands Small Molecule CDMO Market Revenues & Volume, By Hazardous Material Handling, 2022 - 2032F |
7 Netherlands Small Molecule CDMO Market Import-Export Trade Statistics |
7.1 Netherlands Small Molecule CDMO Market Export to Major Countries |
7.2 Netherlands Small Molecule CDMO Market Imports from Major Countries |
8 Netherlands Small Molecule CDMO Market Key Performance Indicators |
8.1 Capacity utilization rates of small molecule CDMOs. |
8.2 Percentage of repeat business and customer retention rates. |
8.3 Time-to-market for new drug products developed by CDMOs. |
8.4 Quality metrics such as batch rejection rates and compliance with regulatory standards. |
8.5 Innovation index measuring the introduction of new technologies and services by small molecule CDMOs. |
9 Netherlands Small Molecule CDMO Market - Opportunity Assessment |
9.1 Netherlands Small Molecule CDMO Market Opportunity Assessment, By Service Type, 2022 & 2032F |
9.2 Netherlands Small Molecule CDMO Market Opportunity Assessment, By API Type, 2022 & 2032F |
9.3 Netherlands Small Molecule CDMO Market Opportunity Assessment, By Drug Development Stage, 2022 & 2032F |
9.4 Netherlands Small Molecule CDMO Market Opportunity Assessment, By Facility Type, 2022 & 2032F |
9.5 Netherlands Small Molecule CDMO Market Opportunity Assessment, By Regulatory Compliance, 2022 & 2032F |
10 Netherlands Small Molecule CDMO Market - Competitive Landscape |
10.1 Netherlands Small Molecule CDMO Market Revenue Share, By Companies, 2025 |
10.2 Netherlands Small Molecule CDMO Market Competitive Benchmarking, By Operating and Technical Parameters |
11 Company Profiles |
12 Recommendations |
13 Disclaimer |
Export potential assessment - trade Analytics for 2030
Export potential enables firms to identify high-growth global markets with greater confidence by combining advanced trade intelligence with a structured quantitative methodology. The framework analyzes emerging demand trends and country-level import patterns while integrating macroeconomic and trade datasets such as GDP and population forecasts, bilateral import–export flows, tariff structures, elasticity differentials between developed and developing economies, geographic distance, and import demand projections. Using weighted trade values from 2020–2024 as the base period to project country-to-country export potential for 2030, these inputs are operationalized through calculated drivers such as gravity model parameters, tariff impact factors, and projected GDP per-capita growth. Through an analysis of hidden potentials, demand hotspots, and market conditions that are most favorable to success, this method enables firms to focus on target countries, maximize returns, and global expansion with data, backed by accuracy.
By factoring in the projected importer demand gap that is currently unmet and could be potential opportunity, it identifies the potential for the Exporter (Country) among 190 countries, against the general trade analysis, which identifies the biggest importer or exporter.
To discover high-growth global markets and optimize your business strategy:
Click Here
Pricing
- Single User License$ 1,995
- Department License$ 2,400
- Site License$ 3,120
- Global License$ 3,795

Search
Thought Leadership and Analyst Meet


Our Clients
Latest Reports
- Canada Cloud CFD Market (2026-2032) | Size & Revenue, Industry, Growth, Competitive Landscape, Forecast, Segmentation, Value, Outlook, Trends, Share, Analysis, Companies
- Taiwan Food Delivery Platform Market (2026-2032) | Companies, Outlook, Analysis, Trends, Value, Revenue, Segmentation, Share, Forecast, Competitive Landscape, Growth, Size & Forecast
- United Kingdom (UK) Long-term Care Insurance Market (2026-2032) | Growth, Share, Consumer Insights, Drivers, Opportunities, Competition, Pricing Analysis, Segments, Restraints, Companies, Competitive, Value, Outlook, Size, Demand, Analysis, Challenges, Strategic Insights, Investment Trends, Revenue, Trends, Supply, Forecast
- United Kingdom (UK) Long Term Care Market (2026-2032) | Companies, Outlook, Analysis, Trends, Value, Revenue, Segmentation, Share, Forecast, Competitive Landscape, Growth, Size & Forecast
- Iraq Insulation and Waterproofing Market (2026-2032) | Outlook, Drivers, Growth, Size, Share, Industry, Revenue, Trends, Demand, Competitive, Strategic Insights, Opportunities, Segments, Companies, Challenges, Strategy, Consumer Insights, Analysis, Investment Trends, Value, Segmentation, Forecast, Restraints
- India Switchgear Market Outlook (2026-2032) | Size, Share, Trends, Growth, Revenue, Forecast, Analysis, Value, Outlook
- Pakistan Contraceptive Implants Market (2025-2031) | Demand, Growth, Size, Share, Industry, Pricing Analysis, Competitive, Strategic Insights, Strategy, Consumer Insights, Analysis, Investment Trends, Opportunities, Revenue, Segments, Value, Segmentation, Supply, Forecast, Restraints, Outlook, Competition, Drivers, Trends, Companies, Challenges
- Sri Lanka Packaging Market (2026-2032) | Outlook, Competition, Drivers, Trends, Demand, Pricing Analysis, Competitive, Strategic Insights, Companies, Challenges, Strategy, Consumer Insights, Analysis, Investment Trends, Opportunities, Growth, Size, Share, Industry, Revenue, Segments, Value, Segmentation, Supply, Forecast, Restraints
- India Kids Watches Market (2026-2032) | Strategy, Consumer Insights, Analysis, Investment Trends, Opportunities, Growth, Size, Share, Industry, Revenue, Segments, Value, Segmentation, Supply, Forecast, Restraints, Outlook, Competition, Drivers, Trends, Demand, Pricing Analysis, Competitive, Strategic Insights, Companies, Challenges
- Saudi Arabia Core Assurance Service Market (2025-2031) | Strategy, Consumer Insights, Analysis, Investment Trends, Opportunities, Growth, Size, Share, Industry, Revenue, Segments, Value, Segmentation, Supply, Forecast, Restraints, Outlook, Competition, Drivers, Trends, Demand, Pricing Analysis, Competitive, Strategic Insights, Companies, Challenges
Industry Events and Analyst Meet

India EV Show 2026

EV tech India Expo 2026

Auto Tech Asia 2026

Battery Tech India 2026

Smart Production Solutions Guangzhou 2026
Whitepaper
- Middle East & Africa Commercial Security Market Click here to view more.
- Middle East & Africa Fire Safety Systems & Equipment Market Click here to view more.
- GCC Drone Market Click here to view more.
- Middle East Lighting Fixture Market Click here to view more.
- GCC Physical & Perimeter Security Market Click here to view more.
6WResearch In News
- Doha a strategic location for EV manufacturing hub: IPA Qatar
- Demand for luxury TVs surging in the GCC, says Samsung
- Empowering Growth: The Thriving Journey of Bangladesh’s Cable Industry
- Demand for luxury TVs surging in the GCC, says Samsung
- Video call with a traditional healer? Once unthinkable, it’s now common in South Africa
- Intelligent Buildings To Smooth GCC’s Path To Net Zero