Netherlands Standard Interactive Video Wall Market (2025-2031) | Competitive Landscape, Segmentation, Size & Revenue, Outlook, Growth, Share, Trends, Forecast, Companies, Value, Industry, Analysis
Market Forecast By Display Unit (Liquid Crystal Display (LCD), Light Emitting Diode (LED), Laser-Powered Phosphor Display (LPD)), By Frame Size (2X2, 3X3, 4X4, Others), By Deployment Type (Touch-Based, Touch Less, Multi Touch), By Organizational Size (Small and Medium Scale Enterprise, Large Scale Enterprise), By End User (Retail, Corporate, Transportation, Healthcare, Hospitality, Museum, IT and Telecommunication, Government and Defense), By Distribution Channel (Online, Offline) And Competitive Landscape
| Product Code: ETC8549537 | Publication Date: Sep 2024 | Updated Date: Nov 2025 | Product Type: Market Research Report | |
| Publisher: 6Wresearch | Author: Summon Dutta | No. of Pages: 75 | No. of Figures: 35 | No. of Tables: 20 |
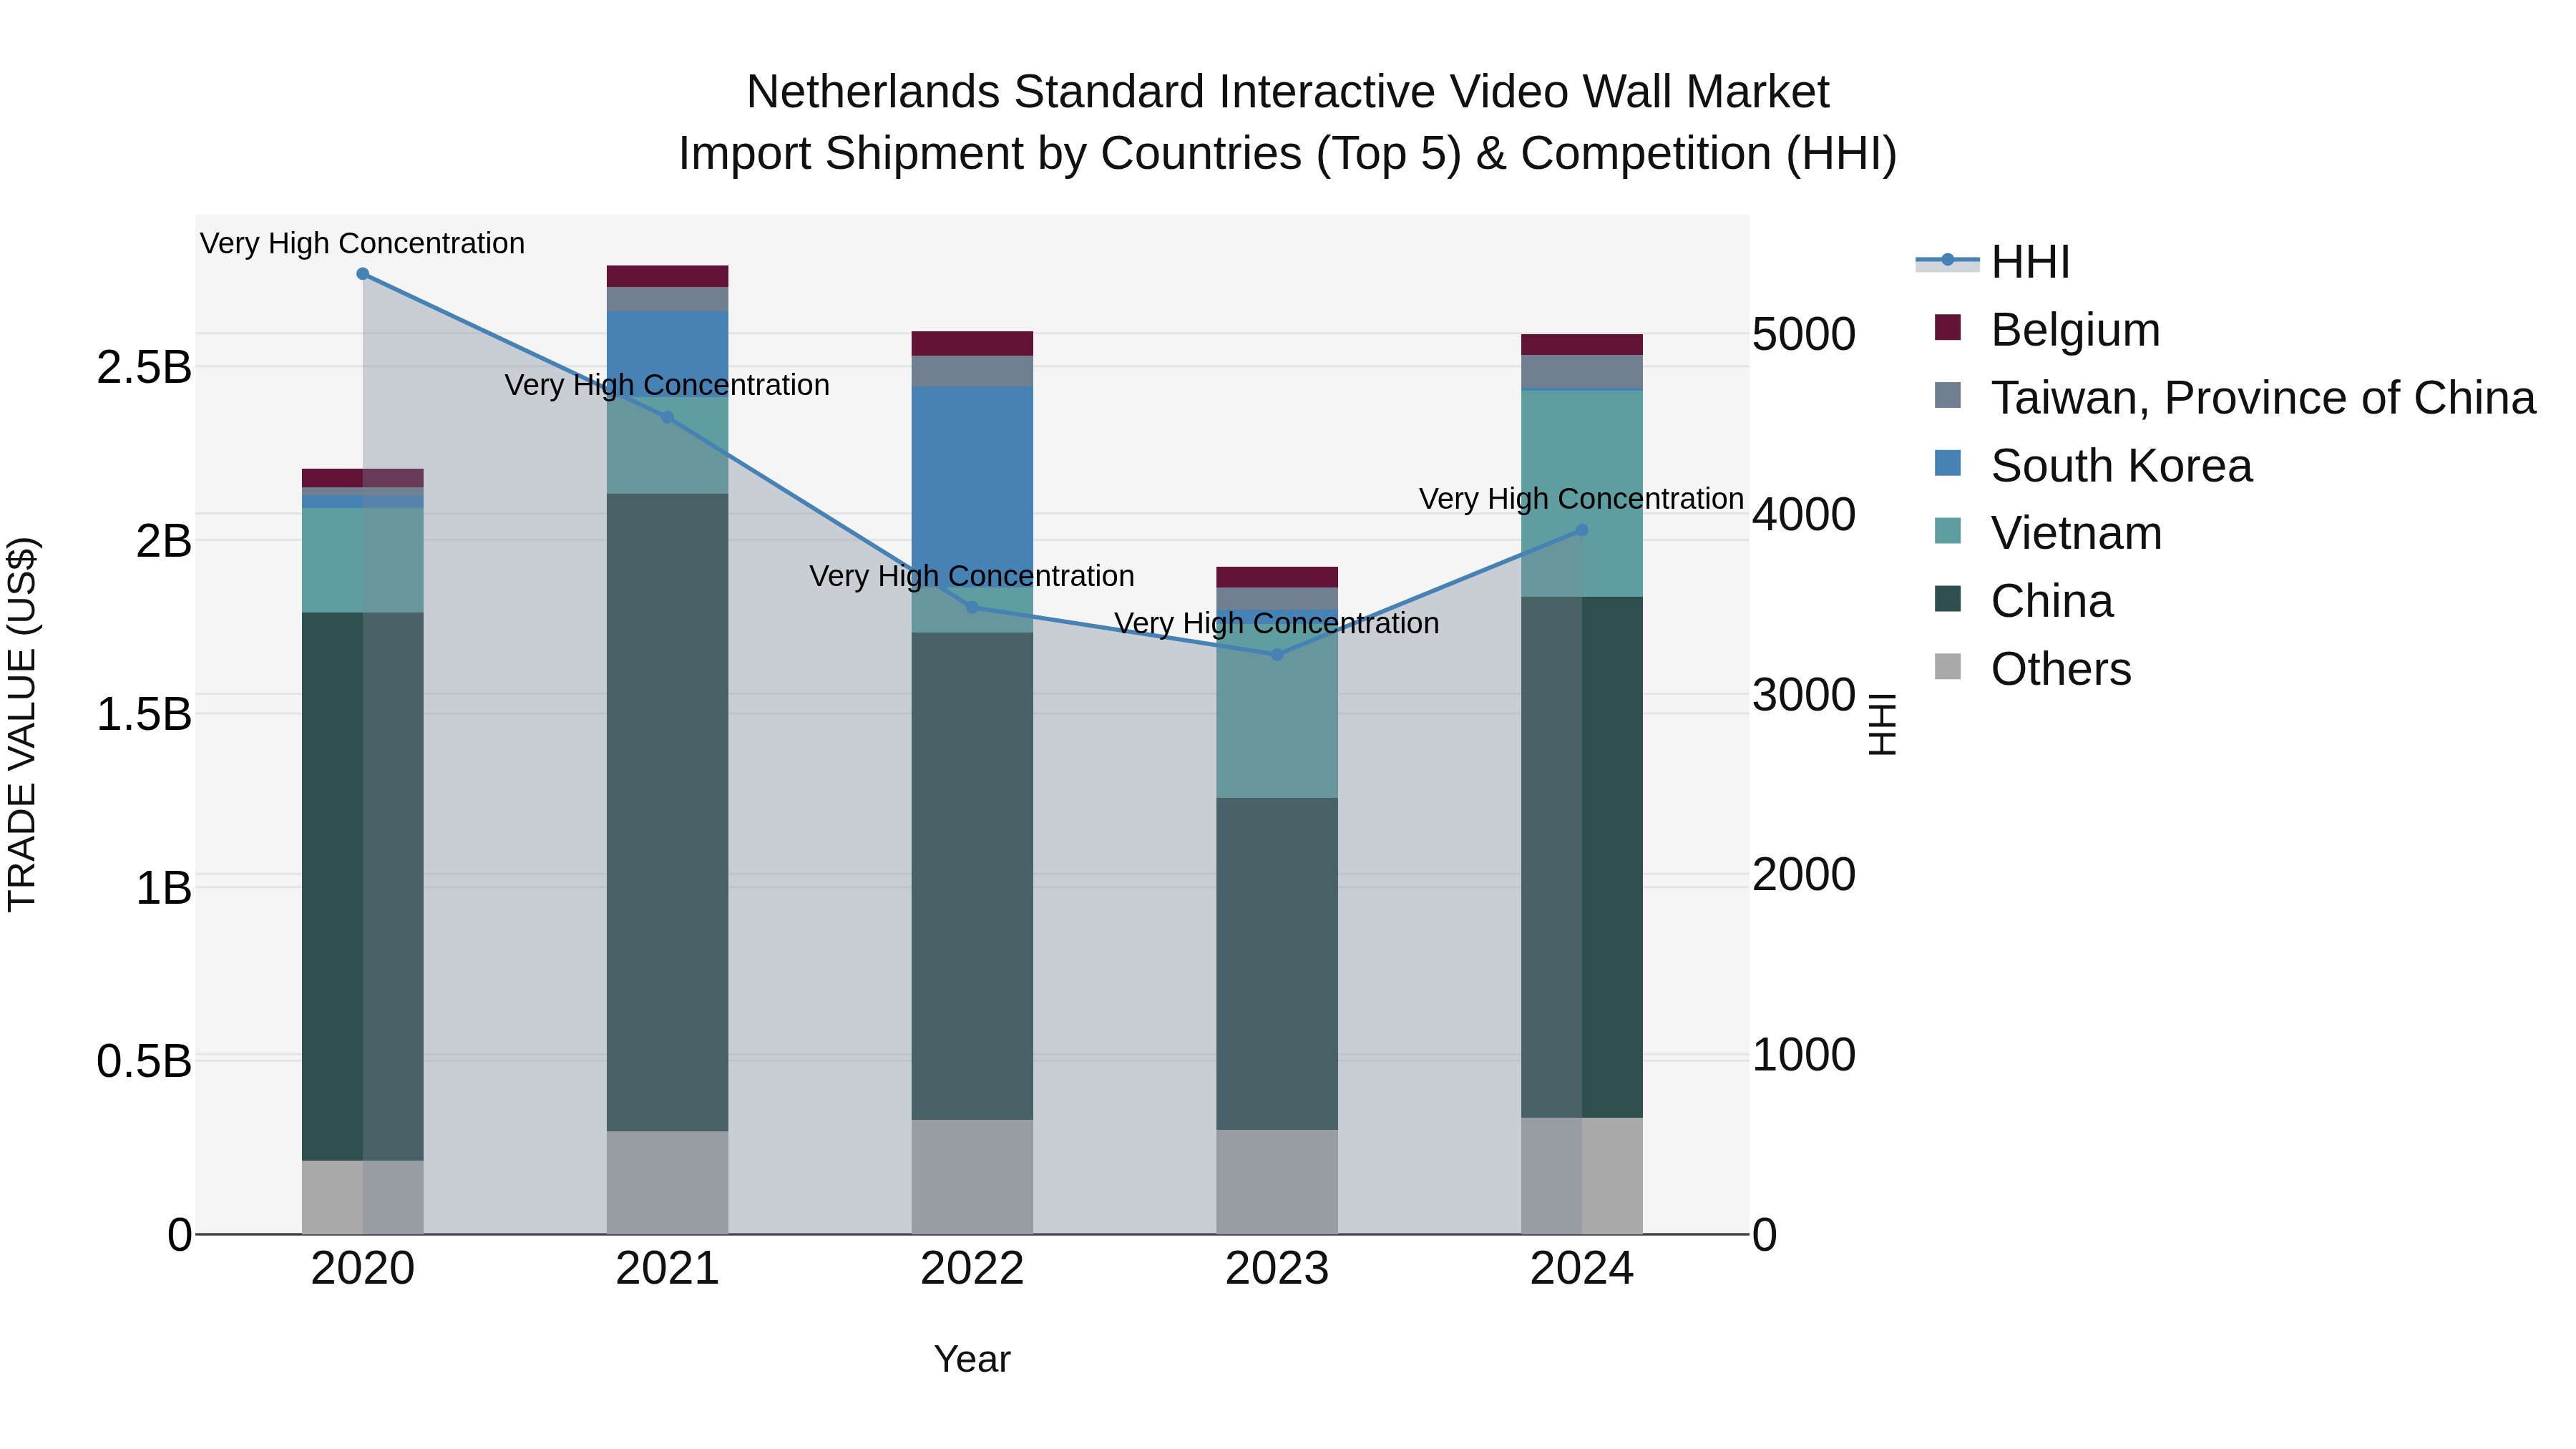
Netherlands Standard Interactive Video Wall Market Import Shipment by Countries (Top 5) & Competition (HHI)
The Netherlands continues to be a key destination for interactive video wall imports, with top exporting countries in 2024 including China, Vietnam, and Taiwan. Despite a high Herfindahl-Hirschman Index indicating market concentration, the industry saw steady growth with a Compound Annual Growth Rate of 4.12% from 2020 to 2024. The impressive growth rate of 34.8% from 2023 to 2024 suggests a strong upward trajectory for the market, pointing towards increasing demand and opportunities for both suppliers and consumers in the interactive video wall sector.
Key Highlights of the Report:
- Netherlands Standard Interactive Video Wall Market Outlook
- Market Size of Netherlands Standard Interactive Video Wall Market, 2024
- Forecast of Netherlands Standard Interactive Video Wall Market, 2031
- Historical Data and Forecast of Netherlands Standard Interactive Video Wall Revenues & Volume for the Period 2021- 2031
- Netherlands Standard Interactive Video Wall Market Trend Evolution
- Netherlands Standard Interactive Video Wall Market Drivers and Challenges
- Netherlands Standard Interactive Video Wall Price Trends
- Netherlands Standard Interactive Video Wall Porter's Five Forces
- Netherlands Standard Interactive Video Wall Industry Life Cycle
- Historical Data and Forecast of Netherlands Standard Interactive Video Wall Market Revenues & Volume By Display Unit for the Period 2021- 2031
- Historical Data and Forecast of Netherlands Standard Interactive Video Wall Market Revenues & Volume By Liquid Crystal Display (LCD) for the Period 2021- 2031
- Historical Data and Forecast of Netherlands Standard Interactive Video Wall Market Revenues & Volume By Light Emitting Diode (LED) for the Period 2021- 2031
- Historical Data and Forecast of Netherlands Standard Interactive Video Wall Market Revenues & Volume By Laser-Powered Phosphor Display (LPD) for the Period 2021- 2031
- Historical Data and Forecast of Netherlands Standard Interactive Video Wall Market Revenues & Volume By Frame Size for the Period 2021- 2031
- Historical Data and Forecast of Netherlands Standard Interactive Video Wall Market Revenues & Volume By 2X2 for the Period 2021- 2031
- Historical Data and Forecast of Netherlands Standard Interactive Video Wall Market Revenues & Volume By 3X3 for the Period 2021- 2031
- Historical Data and Forecast of Netherlands Standard Interactive Video Wall Market Revenues & Volume By 4X4 for the Period 2021- 2031
- Historical Data and Forecast of Netherlands Standard Interactive Video Wall Market Revenues & Volume By Others for the Period 2021- 2031
- Historical Data and Forecast of Netherlands Standard Interactive Video Wall Market Revenues & Volume By Deployment Type for the Period 2021- 2031
- Historical Data and Forecast of Netherlands Standard Interactive Video Wall Market Revenues & Volume By Touch-Based for the Period 2021- 2031
- Historical Data and Forecast of Netherlands Standard Interactive Video Wall Market Revenues & Volume By Touch Less for the Period 2021- 2031
- Historical Data and Forecast of Netherlands Standard Interactive Video Wall Market Revenues & Volume By Multi Touch for the Period 2021- 2031
- Historical Data and Forecast of Netherlands Standard Interactive Video Wall Market Revenues & Volume By Organizational Size for the Period 2021- 2031
- Historical Data and Forecast of Netherlands Standard Interactive Video Wall Market Revenues & Volume By Small and Medium Scale Enterprise for the Period 2021- 2031
- Historical Data and Forecast of Netherlands Standard Interactive Video Wall Market Revenues & Volume By Large Scale Enterprise for the Period 2021- 2031
- Historical Data and Forecast of Netherlands Standard Interactive Video Wall Market Revenues & Volume By End User for the Period 2021- 2031
- Historical Data and Forecast of Netherlands Standard Interactive Video Wall Market Revenues & Volume By Retail for the Period 2021- 2031
- Historical Data and Forecast of Netherlands Standard Interactive Video Wall Market Revenues & Volume By Corporate for the Period 2021- 2031
- Historical Data and Forecast of Netherlands Standard Interactive Video Wall Market Revenues & Volume By Transportation for the Period 2021- 2031
- Historical Data and Forecast of Netherlands Standard Interactive Video Wall Market Revenues & Volume By Healthcare for the Period 2021- 2031
- Historical Data and Forecast of Netherlands Standard Interactive Video Wall Market Revenues & Volume By Hospitality for the Period 2021- 2031
- Historical Data and Forecast of Netherlands Standard Interactive Video Wall Market Revenues & Volume By Museum for the Period 2021- 2031
- Historical Data and Forecast of Netherlands Standard Interactive Video Wall Market Revenues & Volume By IT and Telecommunication for the Period 2021- 2031
- Historical Data and Forecast of Netherlands Standard Interactive Video Wall Market Revenues & Volume By Government and Defense for the Period 2021- 2031
- Historical Data and Forecast of Netherlands Standard Interactive Video Wall Market Revenues & Volume By Distribution Channel for the Period 2021- 2031
- Historical Data and Forecast of Netherlands Standard Interactive Video Wall Market Revenues & Volume By Online for the Period 2021- 2031
- Historical Data and Forecast of Netherlands Standard Interactive Video Wall Market Revenues & Volume By Offline for the Period 2021- 2031
- Netherlands Standard Interactive Video Wall Import Export Trade Statistics
- Market Opportunity Assessment By Display Unit
- Market Opportunity Assessment By Frame Size
- Market Opportunity Assessment By Deployment Type
- Market Opportunity Assessment By Organizational Size
- Market Opportunity Assessment By End User
- Market Opportunity Assessment By Distribution Channel
- Netherlands Standard Interactive Video Wall Top Companies Market Share
- Netherlands Standard Interactive Video Wall Competitive Benchmarking By Technical and Operational Parameters
- Netherlands Standard Interactive Video Wall Company Profiles
- Netherlands Standard Interactive Video Wall Key Strategic Recommendations
Frequently Asked Questions About the Market Study (FAQs):
6Wresearch actively monitors the Netherlands Standard Interactive Video Wall Market and publishes its comprehensive annual report, highlighting emerging trends, growth drivers, revenue analysis, and forecast outlook. Our insights help businesses to make data-backed strategic decisions with ongoing market dynamics. Our analysts track relevent industries related to the Netherlands Standard Interactive Video Wall Market, allowing our clients with actionable intelligence and reliable forecasts tailored to emerging regional needs.
Yes, we provide customisation as per your requirements. To learn more, feel free to contact us on sales@6wresearch.com
1 Executive Summary |
2 Introduction |
2.1 Key Highlights of the Report |
2.2 Report Description |
2.3 Market Scope & Segmentation |
2.4 Research Methodology |
2.5 Assumptions |
3 Netherlands Standard Interactive Video Wall Market Overview |
3.1 Netherlands Country Macro Economic Indicators |
3.2 Netherlands Standard Interactive Video Wall Market Revenues & Volume, 2021 & 2031F |
3.3 Netherlands Standard Interactive Video Wall Market - Industry Life Cycle |
3.4 Netherlands Standard Interactive Video Wall Market - Porter's Five Forces |
3.5 Netherlands Standard Interactive Video Wall Market Revenues & Volume Share, By Display Unit, 2021 & 2031F |
3.6 Netherlands Standard Interactive Video Wall Market Revenues & Volume Share, By Frame Size, 2021 & 2031F |
3.7 Netherlands Standard Interactive Video Wall Market Revenues & Volume Share, By Deployment Type, 2021 & 2031F |
3.8 Netherlands Standard Interactive Video Wall Market Revenues & Volume Share, By Organizational Size, 2021 & 2031F |
3.9 Netherlands Standard Interactive Video Wall Market Revenues & Volume Share, By End User, 2021 & 2031F |
3.10 Netherlands Standard Interactive Video Wall Market Revenues & Volume Share, By Distribution Channel, 2021 & 2031F |
4 Netherlands Standard Interactive Video Wall Market Dynamics |
4.1 Impact Analysis |
4.2 Market Drivers |
4.2.1 Increasing demand for interactive and engaging display solutions in public spaces and events |
4.2.2 Technological advancements leading to more affordable and accessible interactive video wall solutions |
4.2.3 Growing adoption of digital signage for advertising and information dissemination purposes |
4.3 Market Restraints |
4.3.1 High initial investment and maintenance costs associated with interactive video walls |
4.3.2 Limited awareness and understanding of the benefits of interactive video walls among potential customers |
4.3.3 Challenges in integrating interactive video walls with existing infrastructure and systems |
5 Netherlands Standard Interactive Video Wall Market Trends |
6 Netherlands Standard Interactive Video Wall Market, By Types |
6.1 Netherlands Standard Interactive Video Wall Market, By Display Unit |
6.1.1 Overview and Analysis |
6.1.2 Netherlands Standard Interactive Video Wall Market Revenues & Volume, By Display Unit, 2021- 2031F |
6.1.3 Netherlands Standard Interactive Video Wall Market Revenues & Volume, By Liquid Crystal Display (LCD), 2021- 2031F |
6.1.4 Netherlands Standard Interactive Video Wall Market Revenues & Volume, By Light Emitting Diode (LED), 2021- 2031F |
6.1.5 Netherlands Standard Interactive Video Wall Market Revenues & Volume, By Laser-Powered Phosphor Display (LPD), 2021- 2031F |
6.2 Netherlands Standard Interactive Video Wall Market, By Frame Size |
6.2.1 Overview and Analysis |
6.2.2 Netherlands Standard Interactive Video Wall Market Revenues & Volume, By 2X2, 2021- 2031F |
6.2.3 Netherlands Standard Interactive Video Wall Market Revenues & Volume, By 3X3, 2021- 2031F |
6.2.4 Netherlands Standard Interactive Video Wall Market Revenues & Volume, By 4X4, 2021- 2031F |
6.2.5 Netherlands Standard Interactive Video Wall Market Revenues & Volume, By Others, 2021- 2031F |
6.3 Netherlands Standard Interactive Video Wall Market, By Deployment Type |
6.3.1 Overview and Analysis |
6.3.2 Netherlands Standard Interactive Video Wall Market Revenues & Volume, By Touch-Based, 2021- 2031F |
6.3.3 Netherlands Standard Interactive Video Wall Market Revenues & Volume, By Touch Less, 2021- 2031F |
6.3.4 Netherlands Standard Interactive Video Wall Market Revenues & Volume, By Multi Touch, 2021- 2031F |
6.4 Netherlands Standard Interactive Video Wall Market, By Organizational Size |
6.4.1 Overview and Analysis |
6.4.2 Netherlands Standard Interactive Video Wall Market Revenues & Volume, By Small and Medium Scale Enterprise, 2021- 2031F |
6.4.3 Netherlands Standard Interactive Video Wall Market Revenues & Volume, By Large Scale Enterprise, 2021- 2031F |
6.5 Netherlands Standard Interactive Video Wall Market, By End User |
6.5.1 Overview and Analysis |
6.5.2 Netherlands Standard Interactive Video Wall Market Revenues & Volume, By Retail, 2021- 2031F |
6.5.3 Netherlands Standard Interactive Video Wall Market Revenues & Volume, By Corporate, 2021- 2031F |
6.5.4 Netherlands Standard Interactive Video Wall Market Revenues & Volume, By Transportation, 2021- 2031F |
6.5.5 Netherlands Standard Interactive Video Wall Market Revenues & Volume, By Healthcare, 2021- 2031F |
6.5.6 Netherlands Standard Interactive Video Wall Market Revenues & Volume, By Hospitality, 2021- 2031F |
6.5.7 Netherlands Standard Interactive Video Wall Market Revenues & Volume, By Museum, 2021- 2031F |
6.5.8 Netherlands Standard Interactive Video Wall Market Revenues & Volume, By Government and Defense, 2021- 2031F |
6.5.9 Netherlands Standard Interactive Video Wall Market Revenues & Volume, By Government and Defense, 2021- 2031F |
6.5.10 Netherlands Standard Interactive Video Wall Market Revenues & Volume, By Media and Entertainment, 2021- 2031F |
6.6 Netherlands Standard Interactive Video Wall Market, By Distribution Channel |
6.6.1 Overview and Analysis |
6.6.2 Netherlands Standard Interactive Video Wall Market Revenues & Volume, By Online, 2021- 2031F |
6.6.3 Netherlands Standard Interactive Video Wall Market Revenues & Volume, By Offline, 2021- 2031F |
7 Netherlands Standard Interactive Video Wall Market Import-Export Trade Statistics |
7.1 Netherlands Standard Interactive Video Wall Market Export to Major Countries |
7.2 Netherlands Standard Interactive Video Wall Market Imports from Major Countries |
8 Netherlands Standard Interactive Video Wall Market Key Performance Indicators |
8.1 Average time spent by customers interacting with the video wall |
8.2 Number of new installations of interactive video walls in public spaces |
8.3 Percentage increase in engagement metrics (such as click-through rates or interaction rates) after implementing interactive video walls |
9 Netherlands Standard Interactive Video Wall Market - Opportunity Assessment |
9.1 Netherlands Standard Interactive Video Wall Market Opportunity Assessment, By Display Unit, 2021 & 2031F |
9.2 Netherlands Standard Interactive Video Wall Market Opportunity Assessment, By Frame Size, 2021 & 2031F |
9.3 Netherlands Standard Interactive Video Wall Market Opportunity Assessment, By Deployment Type, 2021 & 2031F |
9.4 Netherlands Standard Interactive Video Wall Market Opportunity Assessment, By Organizational Size, 2021 & 2031F |
9.5 Netherlands Standard Interactive Video Wall Market Opportunity Assessment, By End User, 2021 & 2031F |
9.6 Netherlands Standard Interactive Video Wall Market Opportunity Assessment, By Distribution Channel, 2021 & 2031F |
10 Netherlands Standard Interactive Video Wall Market - Competitive Landscape |
10.1 Netherlands Standard Interactive Video Wall Market Revenue Share, By Companies, 2024 |
10.2 Netherlands Standard Interactive Video Wall Market Competitive Benchmarking, By Operating and Technical Parameters |
11 Company Profiles |
12 Recommendations |
13 Disclaimer |
Global Go To Market Strategy - 2030
Export potential enables firms to identify high-growth global markets with greater confidence by combining advanced trade intelligence with a structured quantitative methodology. The framework analyzes emerging demand trends and country-level import patterns while integrating macroeconomic and trade datasets such as GDP and population forecasts, bilateral import–export flows, tariff structures, elasticity differentials between developed and developing economies, geographic distance, and import demand projections. Using weighted trade values from 2020–2024 as the base period to project country-to-country export potential for 2030, these inputs are operationalized through calculated drivers such as gravity model parameters, tariff impact factors, and projected GDP per-capita growth. Through an analysis of hidden potentials, demand hotspots, and market conditions that are most favorable to success, this method enables firms to focus on target countries, maximize returns, and global expansion with data, backed by accuracy.
By factoring in the projected importer demand gap that is currently unmet and could be potential opportunity, it identifies the potential for the Exporter (Country) among 190 countries, against the general trade analysis, which identifies the biggest importer or exporter.
To discover high-growth global markets and optimize your business strategy:
Click Here
Pricing
- Single User License$ 1,995
- Department License$ 2,400
- Site License$ 3,120
- Global License$ 3,795

Leadership Perspectives from Industry Events
Search
Thought Leadership and Analyst Meet


Our Clients
6WResearch In News
- Doha a strategic location for EV manufacturing hub: IPA Qatar
- Demand for luxury TVs surging in the GCC, says Samsung
- Empowering Growth: The Thriving Journey of Bangladesh’s Cable Industry
- Demand for luxury TVs surging in the GCC, says Samsung
- Video call with a traditional healer? Once unthinkable, it’s now common in South Africa
- Intelligent Buildings To Smooth GCC’s Path To Net Zero
Latest Reports
- Cape Verde Portable Hand-Thrown Extinguisher Market (2026-2032)
- Canada Portable Hand-Thrown Extinguisher Market (2026-2032)
- Cameroon Portable Hand-Thrown Extinguisher Market (2026-2032)
- Burundi Portable Hand-Thrown Extinguisher Market (2026-2032)
- Burkina Faso Portable Hand-Thrown Extinguisher Market (2026-2032)
- Bulgaria Portable Hand-Thrown Extinguisher Market (2026-2032)
- Brunei Portable Hand-Thrown Extinguisher Market (2026-2032)
- Botswana Portable Hand-Thrown Extinguisher Market (2026-2032)
- Bosnia and Herzegovina Portable Hand-Thrown Extinguisher Market (2026-2032)
- Bolivia Portable Hand-Thrown Extinguisher Market (2026-2032)
Industry Events and Analyst Meet

HIMTEX 2026

India Refining Summit 2026

India EV Show 2026

EV tech India Expo 2026

Auto Tech Asia 2026
Whitepaper
- Middle East & Africa Commercial Security Market Click here to view more.
- Middle East & Africa Fire Safety Systems & Equipment Market Click here to view more.
- GCC Drone Market Click here to view more.
- Middle East Lighting Fixture Market Click here to view more.
- GCC Physical & Perimeter Security Market Click here to view more.