Netherlands Table Top Sweeteners Market (2025-2031) | Industry, Competitive Landscape, Analysis, Segmentation, Growth, Outlook, Trends, Size & Revenue, Companies, Forecast, Share, Value
Market Forecast By Type (Natural, Artificial), By Application (Dining Room, Family, Others) And Competitive Landscape
| Product Code: ETC8550181 | Publication Date: Sep 2024 | Updated Date: Nov 2025 | Product Type: Market Research Report | |
| Publisher: 6Wresearch | Author: Ravi Bhandari | No. of Pages: 75 | No. of Figures: 35 | No. of Tables: 20 |
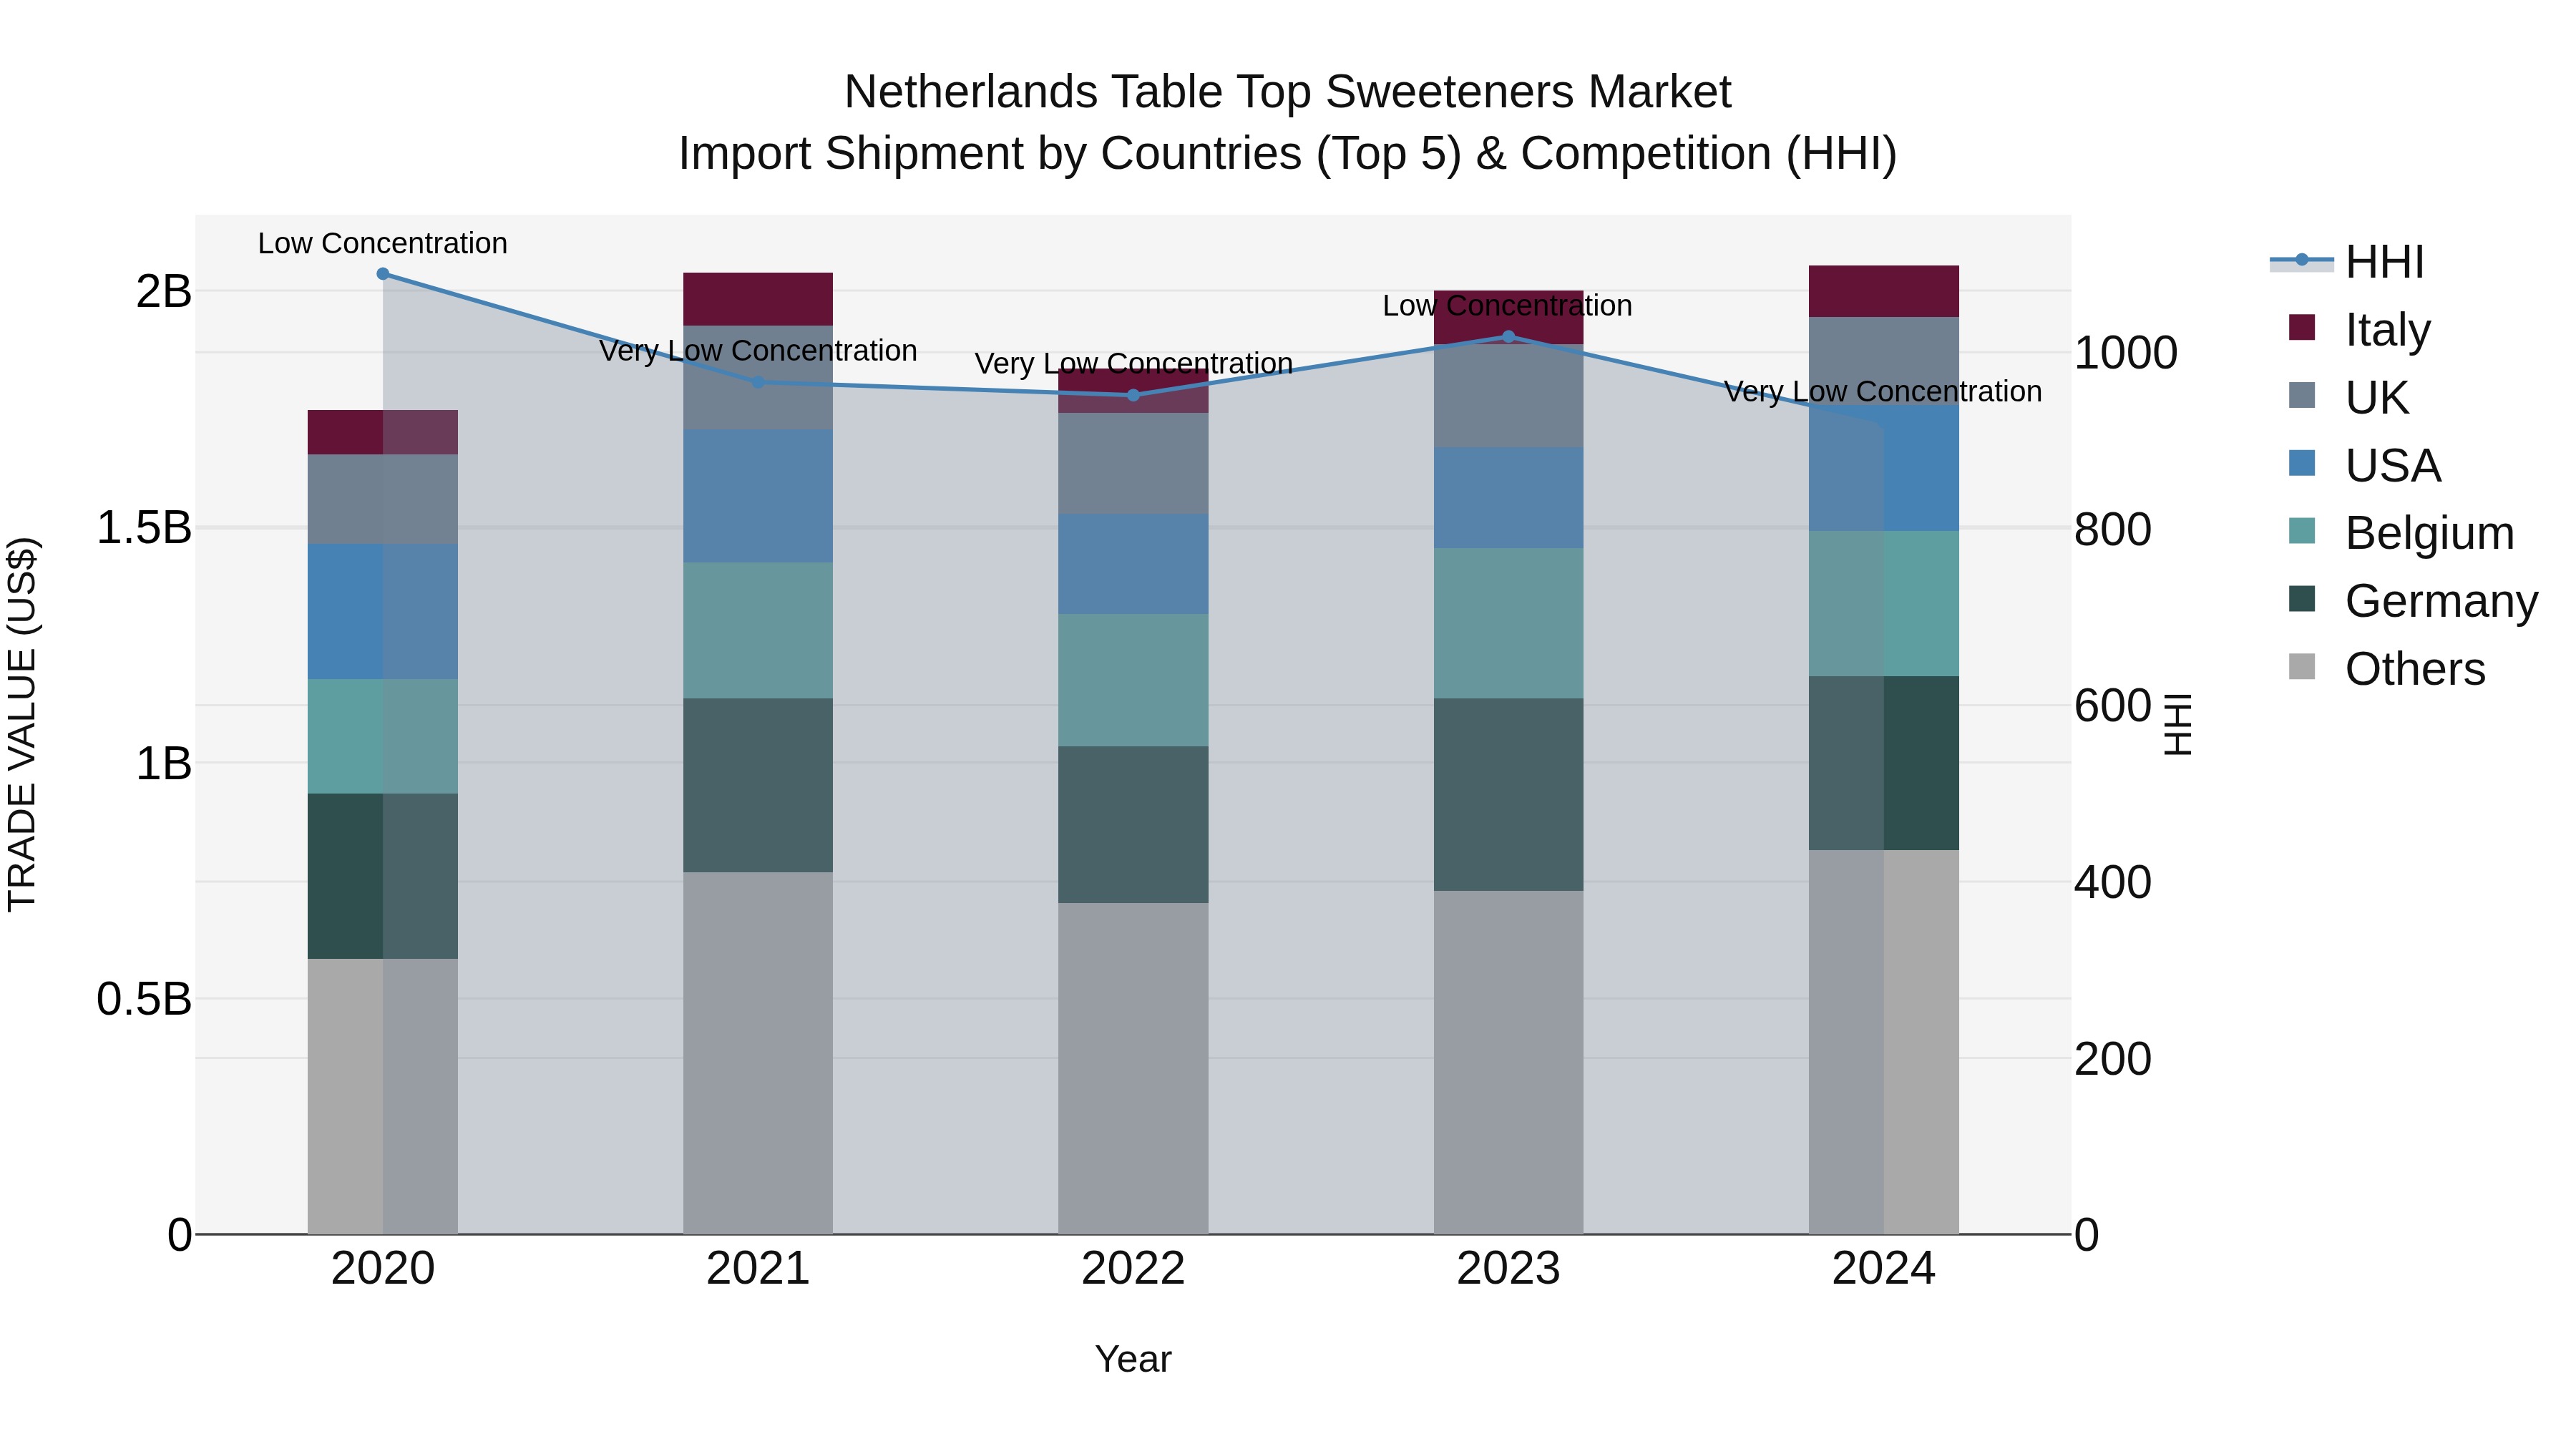
Netherlands Table Top Sweeteners Market Import Shipment by Countries (Top 5) & Competition (HHI)
The Netherlands continues to be a key destination for table top sweeteners import shipments, with top exporters including Germany, Belgium, USA, UK, and Italy in 2024. The market shows low concentration levels, with the HHI decreasing from 2023 to 2024, indicating a more competitive landscape. The compound annual growth rate (CAGR) from 2020 to 2024 stands at 4.12%, while the growth rate from 2023 to 2024 is at 2.65%, reflecting steady growth and potential opportunities for both suppliers and buyers in the market.
Netherlands Table Top Sweeteners Market Synopsis
The Netherlands Table Top Sweeteners Market is characterized by a growing consumer preference for low-calorie and sugar-free alternatives to traditional sweeteners. The market is primarily driven by health-conscious individuals seeking to manage their sugar intake and reduce overall calorie consumption. Stevia-based sweeteners have gained significant popularity due to their natural origin and zero-calorie content. Other key players in the market include sucralose and aspartame-based sweeteners, catering to different taste preferences and usage scenarios. The market is witnessing innovation in terms of product formulations, packaging, and marketing strategies to attract a wider consumer base. With increasing awareness about the health risks associated with excessive sugar consumption, the demand for table top sweeteners in the Netherlands is expected to continue growing, presenting opportunities for both established brands and new entrants in the market.
Netherlands Table Top Sweeteners Market Trends
The Table Top Sweeteners market in the Netherlands is experiencing a shift towards natural and healthier alternatives such as stevia and monk fruit sweeteners, driven by increasing consumer awareness of the health risks associated with traditional sugar consumption. There is a growing demand for sugar-free and low-calorie sweeteners among health-conscious consumers, leading to opportunities for product innovation and development of new sweetening solutions. Additionally, the rising prevalence of diabetes and obesity in the region is further fueling the market growth for table top sweeteners. Manufacturers have the opportunity to capitalize on this trend by introducing innovative products that cater to the changing preferences of consumers, such as organic and plant-based sweeteners to meet the growing demand for healthier options in the market.
Netherlands Table Top Sweeteners Market Challenges
In the Netherlands Table Top Sweeteners Market, one of the key challenges faced is the increasing consumer preference for natural sweeteners over artificial ones. This shift in consumer behavior is driven by concerns over health and wellness, leading to a growing demand for products like stevia and monk fruit extracts. Another challenge is the rising competition from sugar substitutes like agave nectar and maple syrup, which are perceived as more natural alternatives to traditional table top sweeteners. Additionally, regulatory hurdles and changing government policies regarding sweeteners can pose challenges for market players in terms of product formulation and marketing strategies. Overall, companies operating in the Netherlands Table Top Sweeteners Market need to continually innovate and adapt to changing consumer preferences and regulatory landscapes to stay competitive.
Netherlands Table Top Sweeteners Market Investment Opportunities
The Netherlands Table Top Sweeteners Market is primarily driven by the growing consumer awareness and preference for healthier, low-calorie alternatives to sugar. With increasing concerns about obesity and diabetes, consumers are seeking sugar substitutes that provide sweetness without the negative health effects associated with sugar consumption. Additionally, the rising trend of health and wellness lifestyles, coupled with the growing prevalence of diets such as keto and paleo, is fueling the demand for table top sweeteners in the Netherlands. The convenience and portability of these sweeteners also contribute to their popularity among on-the-go consumers. Furthermore, the expanding product offerings and innovations in the sweetener market, including natural and organic options, are driving further growth in the Netherlands Table Top Sweeteners Market.
Netherlands Table Top Sweeteners Market Government Polices
In the Netherlands, the Table Top Sweeteners Market is regulated by several government policies aimed at ensuring consumer safety and product quality. The Dutch Food and Consumer Product Safety Authority (NVWA) oversees the market and enforces regulations on labeling, packaging, and advertising of sweeteners to protect consumers from misleading information. The Netherlands also follows the European Union regulations on food additives, including sweeteners, to maintain consistency with international standards. Additionally, there are guidelines on the maximum allowable levels of sweeteners in food products to safeguard public health. Overall, the government policies in the Netherlands focus on promoting transparency, quality, and safety in the Table Top Sweeteners Market to benefit both consumers and manufacturers.
Netherlands Table Top Sweeteners Market Future Outlook
The Netherlands Table Top Sweeteners Market is expected to witness steady growth in the coming years, driven by increasing consumer awareness about the health risks associated with traditional sugar consumption. The growing trend towards healthier lifestyles and rising prevalence of lifestyle diseases such as diabetes and obesity are prompting consumers to seek out alternative sweetening options. Additionally, the demand for low-calorie and natural sweeteners is on the rise, further fueling market growth. Manufacturers are likely to focus on developing innovative products, such as stevia-based sweeteners, to cater to the evolving preferences of health-conscious consumers. With an emphasis on product diversification and marketing strategies that highlight the benefits of table top sweeteners, the market is poised for expansion in the forecast period.
Key Highlights of the Report:
- Netherlands Table Top Sweeteners Market Outlook
- Market Size of Netherlands Table Top Sweeteners Market, 2024
- Forecast of Netherlands Table Top Sweeteners Market, 2031
- Historical Data and Forecast of Netherlands Table Top Sweeteners Revenues & Volume for the Period 2021- 2031
- Netherlands Table Top Sweeteners Market Trend Evolution
- Netherlands Table Top Sweeteners Market Drivers and Challenges
- Netherlands Table Top Sweeteners Price Trends
- Netherlands Table Top Sweeteners Porter's Five Forces
- Netherlands Table Top Sweeteners Industry Life Cycle
- Historical Data and Forecast of Netherlands Table Top Sweeteners Market Revenues & Volume By Type for the Period 2021- 2031
- Historical Data and Forecast of Netherlands Table Top Sweeteners Market Revenues & Volume By Natural for the Period 2021- 2031
- Historical Data and Forecast of Netherlands Table Top Sweeteners Market Revenues & Volume By Artificial for the Period 2021- 2031
- Historical Data and Forecast of Netherlands Table Top Sweeteners Market Revenues & Volume By Application for the Period 2021- 2031
- Historical Data and Forecast of Netherlands Table Top Sweeteners Market Revenues & Volume By Dining Room for the Period 2021- 2031
- Historical Data and Forecast of Netherlands Table Top Sweeteners Market Revenues & Volume By Family for the Period 2021- 2031
- Historical Data and Forecast of Netherlands Table Top Sweeteners Market Revenues & Volume By Others for the Period 2021- 2031
- Netherlands Table Top Sweeteners Import Export Trade Statistics
- Market Opportunity Assessment By Type
- Market Opportunity Assessment By Application
- Netherlands Table Top Sweeteners Top Companies Market Share
- Netherlands Table Top Sweeteners Competitive Benchmarking By Technical and Operational Parameters
- Netherlands Table Top Sweeteners Company Profiles
- Netherlands Table Top Sweeteners Key Strategic Recommendations
Frequently Asked Questions About the Market Study (FAQs):
6Wresearch actively monitors the Netherlands Table Top Sweeteners Market and publishes its comprehensive annual report, highlighting emerging trends, growth drivers, revenue analysis, and forecast outlook. Our insights help businesses to make data-backed strategic decisions with ongoing market dynamics. Our analysts track relevent industries related to the Netherlands Table Top Sweeteners Market, allowing our clients with actionable intelligence and reliable forecasts tailored to emerging regional needs.
Yes, we provide customisation as per your requirements. To learn more, feel free to contact us on sales@6wresearch.com
1 Executive Summary |
2 Introduction |
2.1 Key Highlights of the Report |
2.2 Report Description |
2.3 Market Scope & Segmentation |
2.4 Research Methodology |
2.5 Assumptions |
3 Netherlands Table Top Sweeteners Market Overview |
3.1 Netherlands Country Macro Economic Indicators |
3.2 Netherlands Table Top Sweeteners Market Revenues & Volume, 2021 & 2031F |
3.3 Netherlands Table Top Sweeteners Market - Industry Life Cycle |
3.4 Netherlands Table Top Sweeteners Market - Porter's Five Forces |
3.5 Netherlands Table Top Sweeteners Market Revenues & Volume Share, By Type, 2021 & 2031F |
3.6 Netherlands Table Top Sweeteners Market Revenues & Volume Share, By Application, 2021 & 2031F |
4 Netherlands Table Top Sweeteners Market Dynamics |
4.1 Impact Analysis |
4.2 Market Drivers |
4.2.1 Increasing consumer awareness about health and wellness leading to a shift towards low-calorie sweeteners. |
4.2.2 Rising prevalence of lifestyle diseases such as diabetes and obesity, driving the demand for sugar substitutes. |
4.2.3 Growing preference for convenience and on-the-go consumption, boosting the market for table top sweeteners. |
4.3 Market Restraints |
4.3.1 Concerns regarding the safety and long-term health effects of artificial sweeteners may hinder market growth. |
4.3.2 Fluctuating prices of raw materials used in sweeteners production can impact the profitability of market players. |
5 Netherlands Table Top Sweeteners Market Trends |
6 Netherlands Table Top Sweeteners Market, By Types |
6.1 Netherlands Table Top Sweeteners Market, By Type |
6.1.1 Overview and Analysis |
6.1.2 Netherlands Table Top Sweeteners Market Revenues & Volume, By Type, 2021- 2031F |
6.1.3 Netherlands Table Top Sweeteners Market Revenues & Volume, By Natural, 2021- 2031F |
6.1.4 Netherlands Table Top Sweeteners Market Revenues & Volume, By Artificial, 2021- 2031F |
6.2 Netherlands Table Top Sweeteners Market, By Application |
6.2.1 Overview and Analysis |
6.2.2 Netherlands Table Top Sweeteners Market Revenues & Volume, By Dining Room, 2021- 2031F |
6.2.3 Netherlands Table Top Sweeteners Market Revenues & Volume, By Family, 2021- 2031F |
6.2.4 Netherlands Table Top Sweeteners Market Revenues & Volume, By Others, 2021- 2031F |
7 Netherlands Table Top Sweeteners Market Import-Export Trade Statistics |
7.1 Netherlands Table Top Sweeteners Market Export to Major Countries |
7.2 Netherlands Table Top Sweeteners Market Imports from Major Countries |
8 Netherlands Table Top Sweeteners Market Key Performance Indicators |
8.1 Consumer adoption rate of table top sweeteners as a sugar substitute. |
8.2 Number of new product launches and innovations in the table top sweeteners segment. |
8.3 Consumer perception and acceptance of natural sweeteners over artificial sweeteners. |
9 Netherlands Table Top Sweeteners Market - Opportunity Assessment |
9.1 Netherlands Table Top Sweeteners Market Opportunity Assessment, By Type, 2021 & 2031F |
9.2 Netherlands Table Top Sweeteners Market Opportunity Assessment, By Application, 2021 & 2031F |
10 Netherlands Table Top Sweeteners Market - Competitive Landscape |
10.1 Netherlands Table Top Sweeteners Market Revenue Share, By Companies, 2024 |
10.2 Netherlands Table Top Sweeteners Market Competitive Benchmarking, By Operating and Technical Parameters |
11 Company Profiles |
12 Recommendations |
13 Disclaimer |
Global Go To Market Strategy - 2030
Export potential enables firms to identify high-growth global markets with greater confidence by combining advanced trade intelligence with a structured quantitative methodology. The framework analyzes emerging demand trends and country-level import patterns while integrating macroeconomic and trade datasets such as GDP and population forecasts, bilateral import–export flows, tariff structures, elasticity differentials between developed and developing economies, geographic distance, and import demand projections. Using weighted trade values from 2020–2024 as the base period to project country-to-country export potential for 2030, these inputs are operationalized through calculated drivers such as gravity model parameters, tariff impact factors, and projected GDP per-capita growth. Through an analysis of hidden potentials, demand hotspots, and market conditions that are most favorable to success, this method enables firms to focus on target countries, maximize returns, and global expansion with data, backed by accuracy.
By factoring in the projected importer demand gap that is currently unmet and could be potential opportunity, it identifies the potential for the Exporter (Country) among 190 countries, against the general trade analysis, which identifies the biggest importer or exporter.
To discover high-growth global markets and optimize your business strategy:
Click Here
Pricing
- Single User License$ 1,995
- Department License$ 2,400
- Site License$ 3,120
- Global License$ 3,795

Leadership Perspectives from Industry Events
Search
Thought Leadership and Analyst Meet


Our Clients
6WResearch In News
- India Air Conditioner Market Set for Strong Rebound in 2026 After Weather-Led Correction and GST-Driven Recovery: 6Wresearch
- ADAS in India: How Automatic Emergency Braking, Blind Spot Detection & Driver Monitoring are Transforming Road Safety
- Doha a strategic location for EV manufacturing hub: IPA Qatar
- Demand for luxury TVs surging in the GCC, says Samsung
- Empowering Growth: The Thriving Journey of Bangladesh’s Cable Industry
- Demand for luxury TVs surging in the GCC, says Samsung
Latest Reports
- Poland Fire Protection Systems Market (2026-2032)
- Cape Verde Portable Hand-Thrown Extinguisher Market (2026-2032)
- Canada Portable Hand-Thrown Extinguisher Market (2026-2032)
- Cameroon Portable Hand-Thrown Extinguisher Market (2026-2032)
- Burundi Portable Hand-Thrown Extinguisher Market (2026-2032)
- Burkina Faso Portable Hand-Thrown Extinguisher Market (2026-2032)
- Bulgaria Portable Hand-Thrown Extinguisher Market (2026-2032)
- Brunei Portable Hand-Thrown Extinguisher Market (2026-2032)
- Botswana Portable Hand-Thrown Extinguisher Market (2026-2032)
- Bosnia and Herzegovina Portable Hand-Thrown Extinguisher Market (2026-2032)
Industry Events and Analyst Meet

HIMTEX 2026

India Refining Summit 2026

India EV Show 2026

EV tech India Expo 2026

Auto Tech Asia 2026
Whitepaper
- Middle East & Africa Commercial Security Market Click here to view more.
- Middle East & Africa Fire Safety Systems & Equipment Market Click here to view more.
- GCC Drone Market Click here to view more.
- Middle East Lighting Fixture Market Click here to view more.
- GCC Physical & Perimeter Security Market Click here to view more.